| Multiple Linear Regression - Estimated Regression Equation |
| wisselkoers[t] = + 349.988239271188 -2.52476554136672consumptieprijzen[t] + 1.29489382228422M1[t] + 2.31327863793316M2[t] + 1.52204502734436M3[t] -0.371286169745872M4[t] + 1.19713341446275M5[t] + 2.26907632053482M6[t] + 0.990607404803453M7[t] + 0.5481196762725M8[t] -0.212386393374486M9[t] + 1.17543883368711M10[t] + 0.246538544527837M11[t] + 0.266161533870994t + e[t] |
| Multiple Linear Regression - Ordinary Least Squares | |||||
| Variable | Parameter | S.D. | T-STAT H0: parameter = 0 | 2-tail p-value | 1-tail p-value |
| (Intercept) | 349.988239271188 | 69.001185 | 5.0722 | 7e-06 | 3e-06 |
| consumptieprijzen | -2.52476554136672 | 0.694008 | -3.6379 | 0.000693 | 0.000346 |
| M1 | 1.29489382228422 | 3.366384 | 0.3847 | 0.702266 | 0.351133 |
| M2 | 2.31327863793316 | 3.358342 | 0.6888 | 0.494399 | 0.247199 |
| M3 | 1.52204502734436 | 3.353631 | 0.4538 | 0.652071 | 0.326035 |
| M4 | -0.371286169745872 | 3.349987 | -0.1108 | 0.912232 | 0.456116 |
| M5 | 1.19713341446275 | 3.348802 | 0.3575 | 0.722367 | 0.361183 |
| M6 | 2.26907632053482 | 3.344319 | 0.6785 | 0.500862 | 0.250431 |
| M7 | 0.990607404803453 | 3.346479 | 0.296 | 0.768551 | 0.384276 |
| M8 | 0.5481196762725 | 3.347239 | 0.1638 | 0.870643 | 0.435322 |
| M9 | -0.212386393374486 | 3.342312 | -0.0635 | 0.949608 | 0.474804 |
| M10 | 1.17543883368711 | 3.351688 | 0.3507 | 0.727414 | 0.363707 |
| M11 | 0.246538544527837 | 3.337674 | 0.0739 | 0.941438 | 0.470719 |
| t | 0.266161533870994 | 0.146192 | 1.8206 | 0.075172 | 0.037586 |
| Multiple Linear Regression - Regression Statistics | |
| Multiple R | 0.742032416370845 |
| R-squared | 0.550612106945155 |
| Adjusted R-squared | 0.423611180647047 |
| F-TEST (value) | 4.33549677939125 |
| F-TEST (DF numerator) | 13 |
| F-TEST (DF denominator) | 46 |
| p-value | 0.000102863886039639 |
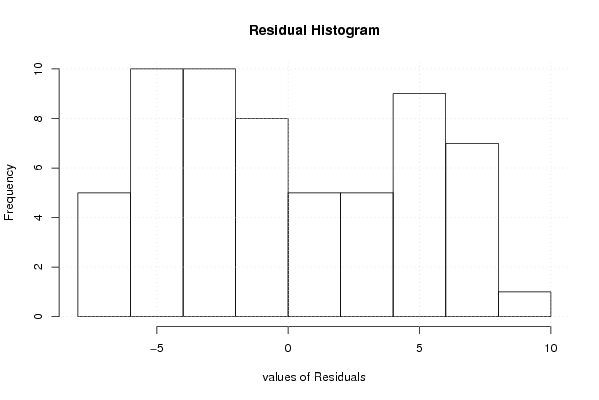
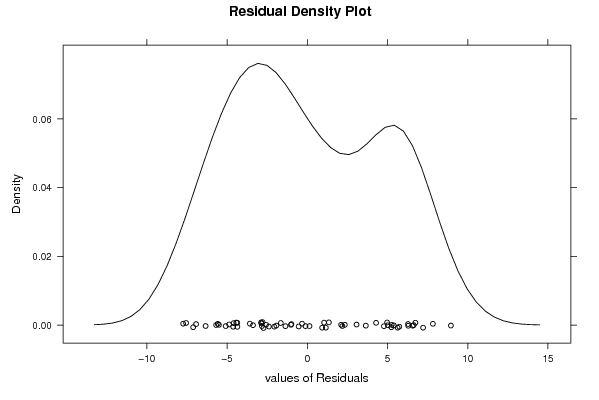
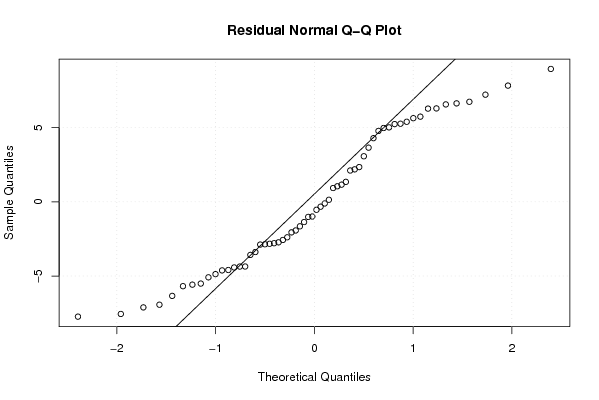
| Multiple Linear Regression - Residual Statistics | |
| Residual Standard Deviation | 5.27035806442279 |
| Sum Squared Residuals | 1277.72700985241 |
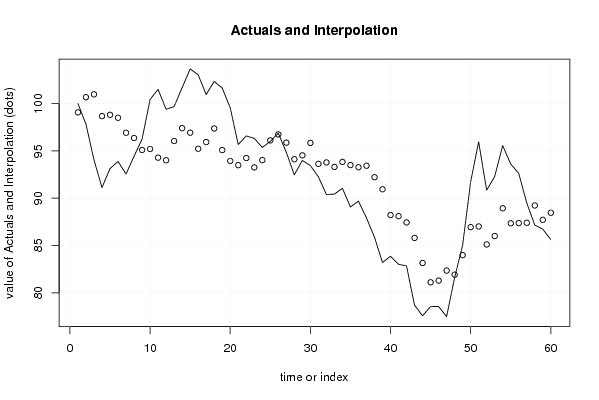
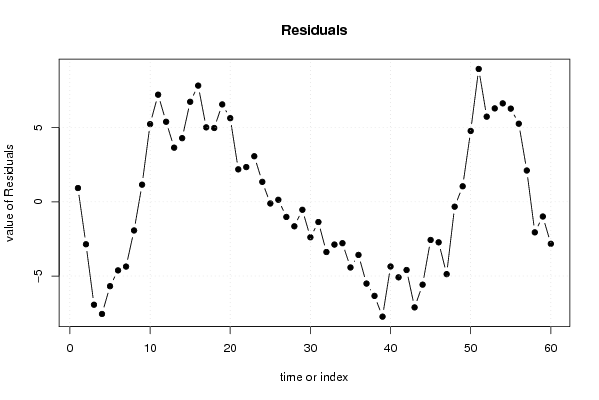
| Multiple Linear Regression - Actuals, Interpolation, and Residuals | |||
| Time or Index | Actuals | Interpolation Forecast | Residuals Prediction Error |
| 1 | 100 | 99.072740490672 | 0.927259509328086 |
| 2 | 97.82226485 | 100.682224493585 | -2.85995964358523 |
| 3 | 94.04971502 | 100.981994152405 | -6.93227913240457 |
| 4 | 91.12460521 | 98.6799539782913 | -7.55534876829128 |
| 5 | 93.13202153 | 98.8148611918346 | -5.68283966183461 |
| 6 | 93.88342812 | 98.5032823121893 | -4.61985419218933 |
| 7 | 92.55349954 | 96.9160850591301 | -4.36258551913011 |
| 8 | 94.43494835 | 96.3648309291006 | -1.92988257910063 |
| 9 | 96.25017563 | 95.0956350912495 | 1.15454053875047 |
| 10 | 100.4355715 | 95.199919248032 | 5.2356522519681 |
| 11 | 101.5036685 | 94.2872284516718 | 7.21644004832823 |
| 12 | 99.39789728 | 94.0069087897475 | 5.39098849025254 |
| 13 | 99.68990733 | 96.0428730491868 | 3.64703428081316 |
| 14 | 101.6895041 | 97.402405187762 | 4.28709891223807 |
| 15 | 103.6652759 | 96.9273234687632 | 6.73795243123682 |
| 16 | 103.0532766 | 95.2251682689653 | 7.82810833103466 |
| 17 | 100.9500712 | 95.9349650759833 | 5.01510612401666 |
| 18 | 102.345366 | 97.3730502313645 | 4.9723157686355 |
| 19 | 101.6472299 | 95.0859874652853 | 6.56124243471468 |
| 20 | 99.56809393 | 93.934848537674 | 5.63324539232602 |
| 21 | 95.67727392 | 93.490494359617 | 2.18677956038294 |
| 22 | 96.58494865 | 94.2446536717003 | 2.34029497829966 |
| 23 | 96.32604937 | 93.2569773387616 | 3.0690720312384 |
| 24 | 95.37109101 | 94.0264564513204 | 1.34463455867964 |
| 25 | 96.00056203 | 96.1124110684788 | -0.111849038478814 |
| 26 | 96.88367859 | 96.7470820102213 | 0.136596579778710 |
| 27 | 94.85280372 | 95.8720771769935 | -1.01927345699349 |
| 28 | 92.46943974 | 94.1199316194766 | -1.65049187947662 |
| 29 | 93.99180173 | 94.5297860277037 | -0.537984297703675 |
| 30 | 93.45262168 | 95.8428952887872 | -2.39027360878722 |
| 31 | 92.26698759 | 93.6308180592866 | -1.36383046928660 |
| 32 | 90.39653498 | 93.779429442277 | -3.38289446227706 |
| 33 | 90.43001228 | 93.3100800853606 | -2.88006780536060 |
| 34 | 91.04995327 | 93.8392827877081 | -2.78932951770810 |
| 35 | 89.07845784 | 93.5014816100703 | -4.42302377007029 |
| 36 | 89.69314509 | 93.2711525583416 | -3.57800746834159 |
| 37 | 87.92459054 | 93.4324766359803 | -5.50788609598033 |
| 38 | 85.8789319 | 92.2175025747816 | -6.33857067478166 |
| 39 | 83.20612366 | 90.9425743748483 | -7.73645071484828 |
| 40 | 83.85722053 | 88.2156155794269 | -4.35839504942691 |
| 41 | 83.01393462 | 88.1005709791273 | -5.08663635912728 |
| 42 | 82.84508195 | 87.4390590904955 | -4.59397714049549 |
| 43 | 78.68864276 | 85.8018714797172 | -7.11322871971719 |
| 44 | 77.56959675 | 83.1510203056747 | -5.58142355567472 |
| 45 | 78.53689529 | 81.106972913272 | -2.57007762327196 |
| 46 | 78.55717715 | 81.2862428591095 | -2.72906570910947 |
| 47 | 77.4761291 | 82.3481729599881 | -4.87204385998813 |
| 48 | 81.58931659 | 81.9178824773832 | -0.328565887383194 |
| 49 | 85.02428326 | 83.9788419156821 | 1.0454413443179 |
| 50 | 91.71290159 | 86.9380667636499 | 4.77483482635009 |
| 51 | 95.96293061 | 87.0128797369905 | 8.95005087300952 |
| 52 | 90.84689022 | 85.1107628538399 | 5.73612736616014 |
| 53 | 92.28788036 | 85.9955261653511 | 6.2923541946489 |
| 54 | 95.56511274 | 88.9333235671635 | 6.63178917283654 |
| 55 | 93.62452884 | 87.3461265665808 | 6.27840227341922 |
| 56 | 92.63071726 | 87.3697620552736 | 5.2609552047264 |
| 57 | 89.50914211 | 87.4003167805008 | 2.10882532949915 |
| 58 | 87.17171779 | 89.2292697934502 | -2.05755200345018 |
| 59 | 86.72624975 | 87.7166941995082 | -0.990444449508212 |
| 60 | 85.63212844 | 88.4611781332074 | -2.82904969320738 |
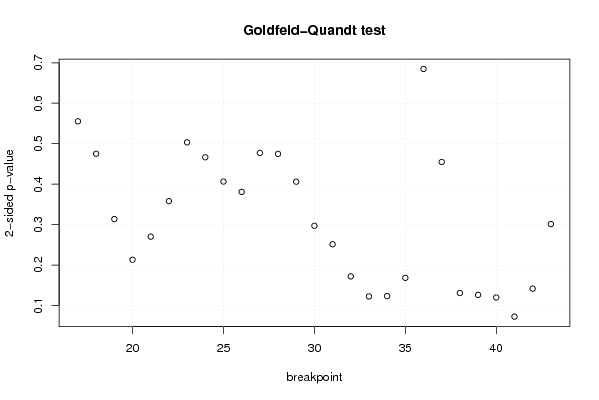
| Goldfeld-Quandt test for Heteroskedasticity | |||
| p-values | Alternative Hypothesis | ||
| breakpoint index | greater | 2-sided | less |
| 17 | 0.277632309414992 | 0.555264618829984 | 0.722367690585008 |
| 18 | 0.237550774907982 | 0.475101549815964 | 0.762449225092018 |
| 19 | 0.156906228274629 | 0.313812456549258 | 0.843093771725371 |
| 20 | 0.106631230423521 | 0.213262460847041 | 0.89336876957648 |
| 21 | 0.135190253883415 | 0.270380507766829 | 0.864809746116585 |
| 22 | 0.179066659397847 | 0.358133318795694 | 0.820933340602153 |
| 23 | 0.251688495113011 | 0.503376990226023 | 0.748311504886989 |
| 24 | 0.233222769500974 | 0.466445539001947 | 0.766777230499026 |
| 25 | 0.203229066420603 | 0.406458132841205 | 0.796770933579397 |
| 26 | 0.190434145635742 | 0.380868291271483 | 0.809565854364258 |
| 27 | 0.238615328714949 | 0.477230657429899 | 0.76138467128505 |
| 28 | 0.237434077181306 | 0.474868154362612 | 0.762565922818694 |
| 29 | 0.203051205214658 | 0.406102410429315 | 0.796948794785342 |
| 30 | 0.148611967039167 | 0.297223934078333 | 0.851388032960833 |
| 31 | 0.125792877441967 | 0.251585754883934 | 0.874207122558033 |
| 32 | 0.0861037319441527 | 0.172207463888305 | 0.913896268055847 |
| 33 | 0.0613247907320256 | 0.122649581464051 | 0.938675209267974 |
| 34 | 0.0617795350553275 | 0.123559070110655 | 0.938220464944673 |
| 35 | 0.0842955926177929 | 0.168591185235586 | 0.915704407382207 |
| 36 | 0.342343029013193 | 0.684686058026387 | 0.657656970986807 |
| 37 | 0.77256394904283 | 0.45487210191434 | 0.22743605095717 |
| 38 | 0.934422198310935 | 0.131155603378131 | 0.0655778016890653 |
| 39 | 0.936747253377237 | 0.126505493245526 | 0.063252746622763 |
| 40 | 0.939988897957376 | 0.120022204085248 | 0.0600111020426239 |
| 41 | 0.963645517483246 | 0.0727089650335073 | 0.0363544825167537 |
| 42 | 0.929036457537514 | 0.141927084924972 | 0.070963542462486 |
| 43 | 0.849291964258967 | 0.301416071482067 | 0.150708035741033 |
| Meta Analysis of Goldfeld-Quandt test for Heteroskedasticity | |||
| Description | # significant tests | % significant tests | OK/NOK |
| 1% type I error level | 0 | 0 | OK |
| 5% type I error level | 0 | 0 | OK |
| 10% type I error level | 1 | 0.0370370370370370 | OK |