| Multiple Linear Regression - Estimated Regression Equation |
| Y[t] = + 98.85059602649 -14.9166390728477X[t] + 9.55899144591611M1[t] -16.0242356512141M2[t] -5.28014486754967M3[t] + 12.3672737306843M4[t] + 12.0313645143488M5[t] + 5.31545529801325M6[t] -2.52045391832229M7[t] -2.51636313465784M8[t] -1.41227235099337M9[t] + 7.17181843267108M10[t] + 0.775909216335541M11[t] + 0.215909216335541t + e[t] |
| Multiple Linear Regression - Ordinary Least Squares | |||||
| Variable | Parameter | S.D. | T-STAT H0: parameter = 0 | 2-tail p-value | 1-tail p-value |
| (Intercept) | 98.85059602649 | 2.308625 | 42.818 | 0 | 0 |
| X | -14.9166390728477 | 1.978489 | -7.5394 | 0 | 0 |
| M1 | 9.55899144591611 | 2.613236 | 3.6579 | 0.000641 | 0.000321 |
| M2 | -16.0242356512141 | 2.745086 | -5.8374 | 0 | 0 |
| M3 | -5.28014486754967 | 2.742979 | -1.925 | 0.060298 | 0.030149 |
| M4 | 12.3672737306843 | 2.743548 | 4.5078 | 4.3e-05 | 2.2e-05 |
| M5 | 12.0313645143488 | 2.738862 | 4.3928 | 6.3e-05 | 3.2e-05 |
| M6 | 5.31545529801325 | 2.734794 | 1.9436 | 0.05794 | 0.02897 |
| M7 | -2.52045391832229 | 2.731347 | -0.9228 | 0.360831 | 0.180415 |
| M8 | -2.51636313465784 | 2.728524 | -0.9222 | 0.361112 | 0.180556 |
| M9 | -1.41227235099337 | 2.726326 | -0.518 | 0.606879 | 0.30344 |
| M10 | 7.17181843267108 | 2.724755 | 2.6321 | 0.011445 | 0.005722 |
| M11 | 0.775909216335541 | 2.723812 | 0.2849 | 0.777002 | 0.388501 |
| t | 0.215909216335541 | 0.041385 | 5.2171 | 4e-06 | 2e-06 |
| Multiple Linear Regression - Regression Statistics | |
| Multiple R | 0.911311400399914 |
| R-squared | 0.830488468498853 |
| Adjusted R-squared | 0.783602300211301 |
| F-TEST (value) | 17.712867116918 |
| F-TEST (DF numerator) | 13 |
| F-TEST (DF denominator) | 47 |
| p-value | 7.07212066686225e-14 |
| Multiple Linear Regression - Residual Statistics | |
| Residual Standard Deviation | 4.30622765600411 |
| Sum Squared Residuals | 871.549041390728 |
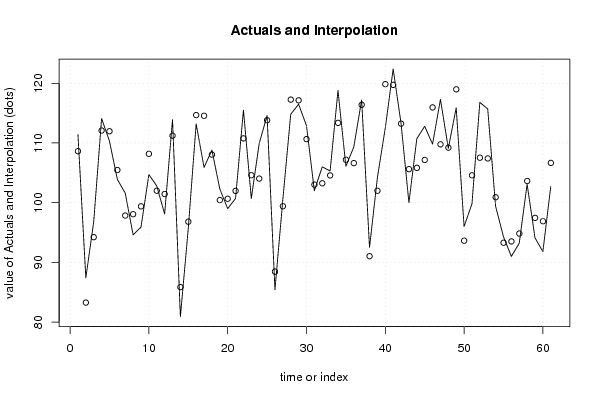
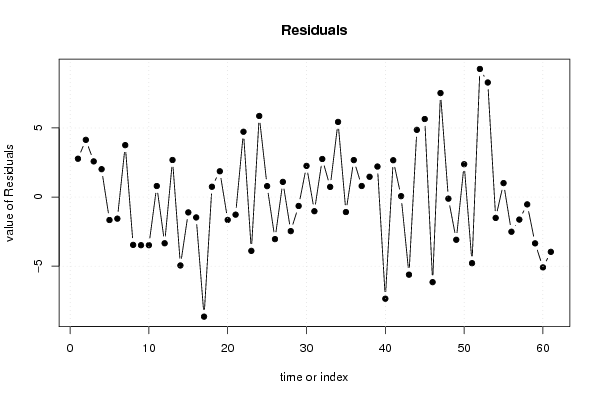
| Multiple Linear Regression - Actuals, Interpolation, and Residuals | |||
| Time or Index | Actuals | Interpolation Forecast | Residuals Prediction Error |
| 1 | 111.4 | 108.625496688742 | 2.77450331125823 |
| 2 | 87.4 | 83.258178807947 | 4.14182119205302 |
| 3 | 96.8 | 94.218178807947 | 2.58182119205298 |
| 4 | 114.1 | 112.081506622517 | 2.01849337748342 |
| 5 | 110.3 | 111.961506622517 | -1.66150662251656 |
| 6 | 103.9 | 105.461506622517 | -1.56150662251655 |
| 7 | 101.6 | 97.8415066225165 | 3.75849337748346 |
| 8 | 94.6 | 98.0615066225166 | -3.46150662251656 |
| 9 | 95.9 | 99.3815066225166 | -3.48150662251655 |
| 10 | 104.7 | 108.181506622517 | -3.48150662251655 |
| 11 | 102.8 | 102.001506622517 | 0.798493377483445 |
| 12 | 98.1 | 101.441506622517 | -3.34150662251656 |
| 13 | 113.9 | 111.216407284768 | 2.6835927152318 |
| 14 | 80.9 | 85.8490894039735 | -4.94908940397352 |
| 15 | 95.7 | 96.8090894039735 | -1.10908940397351 |
| 16 | 113.2 | 114.672417218543 | -1.47241721854304 |
| 17 | 105.9 | 114.552417218543 | -8.65241721854304 |
| 18 | 108.8 | 108.052417218543 | 0.747582781456949 |
| 19 | 102.3 | 100.432417218543 | 1.86758278145695 |
| 20 | 99 | 100.652417218543 | -1.65241721854304 |
| 21 | 100.7 | 101.972417218543 | -1.27241721854305 |
| 22 | 115.5 | 110.772417218543 | 4.72758278145695 |
| 23 | 100.7 | 104.592417218543 | -3.89241721854304 |
| 24 | 109.9 | 104.032417218543 | 5.86758278145696 |
| 25 | 114.6 | 113.807317880795 | 0.792682119205299 |
| 26 | 85.4 | 88.44 | -3.04000000000001 |
| 27 | 100.5 | 99.4 | 1.10000000000000 |
| 28 | 114.8 | 117.263327814570 | -2.46332781456953 |
| 29 | 116.5 | 117.143327814570 | -0.643327814569542 |
| 30 | 112.9 | 110.643327814570 | 2.25667218543047 |
| 31 | 102 | 103.023327814570 | -1.02332781456954 |
| 32 | 106 | 103.243327814570 | 2.75667218543047 |
| 33 | 105.3 | 104.563327814570 | 0.736672185430459 |
| 34 | 118.8 | 113.363327814570 | 5.43667218543046 |
| 35 | 106.1 | 107.183327814570 | -1.08332781456954 |
| 36 | 109.3 | 106.623327814570 | 2.67667218543046 |
| 37 | 117.2 | 116.398228476821 | 0.801771523178817 |
| 38 | 92.5 | 91.0309105960265 | 1.46908940397350 |
| 39 | 104.2 | 101.990910596026 | 2.20908940397351 |
| 40 | 112.5 | 119.854238410596 | -7.35423841059602 |
| 41 | 122.4 | 119.734238410596 | 2.66576158940398 |
| 42 | 113.3 | 113.234238410596 | 0.0657615894039687 |
| 43 | 100 | 105.614238410596 | -5.61423841059603 |
| 44 | 110.7 | 105.834238410596 | 4.86576158940398 |
| 45 | 112.8 | 107.154238410596 | 5.64576158940397 |
| 46 | 109.8 | 115.954238410596 | -6.15423841059603 |
| 47 | 117.3 | 109.774238410596 | 7.52576158940397 |
| 48 | 109.1 | 109.214238410596 | -0.114238410596029 |
| 49 | 115.9 | 118.989139072848 | -3.08913907284767 |
| 50 | 96 | 93.621821192053 | 2.37817880794700 |
| 51 | 99.8 | 104.581821192053 | -4.78182119205298 |
| 52 | 116.8 | 107.528509933775 | 9.27149006622517 |
| 53 | 115.7 | 107.408509933775 | 8.29149006622516 |
| 54 | 99.4 | 100.908509933775 | -1.50850993377483 |
| 55 | 94.3 | 93.2885099337748 | 1.01149006622516 |
| 56 | 91 | 93.5085099337748 | -2.50850993377483 |
| 57 | 93.2 | 94.8285099337748 | -1.62850993377483 |
| 58 | 103.1 | 103.628509933775 | -0.528509933774839 |
| 59 | 94.1 | 97.4485099337748 | -3.34850993377484 |
| 60 | 91.8 | 96.8885099337748 | -5.08850993377484 |
| 61 | 102.7 | 106.663410596026 | -3.96341059602648 |
| Goldfeld-Quandt test for Heteroskedasticity | |||
| p-values | Alternative Hypothesis | ||
| breakpoint index | greater | 2-sided | less |
| 17 | 0.253278761677422 | 0.506557523354845 | 0.746721238322578 |
| 18 | 0.298159054606797 | 0.596318109213594 | 0.701840945393203 |
| 19 | 0.18210115042017 | 0.36420230084034 | 0.81789884957983 |
| 20 | 0.162175029512201 | 0.324350059024402 | 0.837824970487799 |
| 21 | 0.140275498665304 | 0.280550997330608 | 0.859724501334696 |
| 22 | 0.281099139455318 | 0.562198278910636 | 0.718900860544682 |
| 23 | 0.242114361928597 | 0.484228723857194 | 0.757885638071403 |
| 24 | 0.375554373022973 | 0.751108746045947 | 0.624445626977027 |
| 25 | 0.280854085376917 | 0.561708170753834 | 0.719145914623083 |
| 26 | 0.233311476238726 | 0.466622952477453 | 0.766688523761273 |
| 27 | 0.163883873527759 | 0.327767747055519 | 0.83611612647224 |
| 28 | 0.123389280249298 | 0.246778560498595 | 0.876610719750702 |
| 29 | 0.155473287151311 | 0.310946574302621 | 0.84452671284869 |
| 30 | 0.113796345102078 | 0.227592690204156 | 0.886203654897922 |
| 31 | 0.0831409789683891 | 0.166281957936778 | 0.916859021031611 |
| 32 | 0.0743333003678874 | 0.148666600735775 | 0.925666699632113 |
| 33 | 0.0573738475173432 | 0.114747695034686 | 0.942626152482657 |
| 34 | 0.0542565987997916 | 0.108513197599583 | 0.945743401200208 |
| 35 | 0.0438346530073836 | 0.0876693060147673 | 0.956165346992616 |
| 36 | 0.0254263718734956 | 0.0508527437469911 | 0.974573628126504 |
| 37 | 0.0143043350008936 | 0.0286086700017871 | 0.985695664999106 |
| 38 | 0.0098359173218155 | 0.019671834643631 | 0.990164082678185 |
| 39 | 0.00465505544254089 | 0.00931011088508178 | 0.99534494455746 |
| 40 | 0.081651434605367 | 0.163302869210734 | 0.918348565394633 |
| 41 | 0.116169748568398 | 0.232339497136796 | 0.883830251431602 |
| 42 | 0.0661980568780347 | 0.132396113756069 | 0.933801943121965 |
| 43 | 0.177083641042444 | 0.354167282084888 | 0.822916358957556 |
| 44 | 0.126005658545489 | 0.252011317090978 | 0.87399434145451 |
| Meta Analysis of Goldfeld-Quandt test for Heteroskedasticity | |||
| Description | # significant tests | % significant tests | OK/NOK |
| 1% type I error level | 1 | 0.0357142857142857 | NOK |
| 5% type I error level | 3 | 0.107142857142857 | NOK |
| 10% type I error level | 5 | 0.178571428571429 | NOK |