| Multiple Linear Regression - Estimated Regression Equation |
| saldo_zichtrek[t] = + 34.5166727272727 + 4.21449393939394crisis[t] + e[t] |
| Multiple Linear Regression - Ordinary Least Squares | |||||
| Variable | Parameter | S.D. | T-STAT H0: parameter = 0 | 2-tail p-value | 1-tail p-value |
| (Intercept) | 34.5166727272727 | 0.287777 | 119.9426 | 0 | 0 |
| crisis | 4.21449393939394 | 0.917581 | 4.593 | 2.3e-05 | 1.2e-05 |
| Multiple Linear Regression - Regression Statistics | |
| Multiple R | 0.513210100478173 |
| R-squared | 0.263384607232816 |
| Adjusted R-squared | 0.250899600575745 |
| F-TEST (value) | 21.0960726307380 |
| F-TEST (DF numerator) | 1 |
| F-TEST (DF denominator) | 59 |
| p-value | 2.34371282262780e-05 |
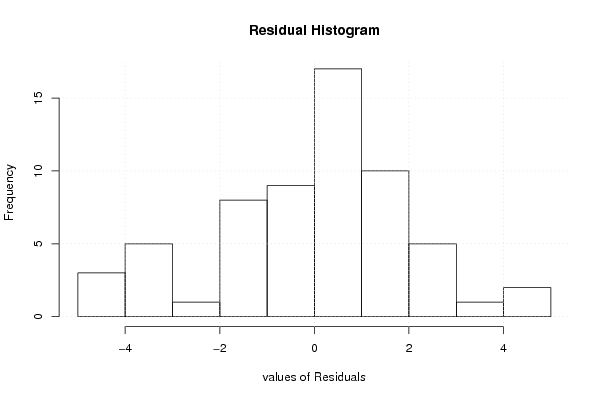
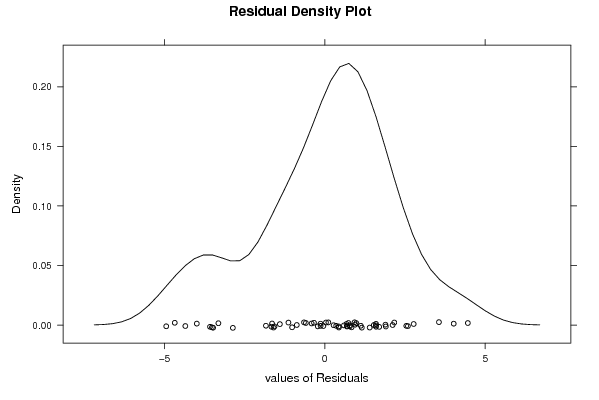
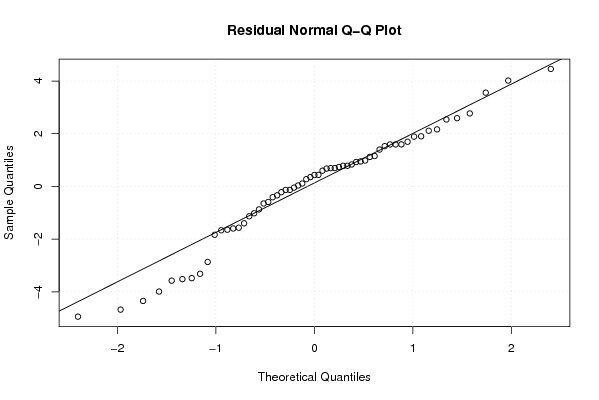
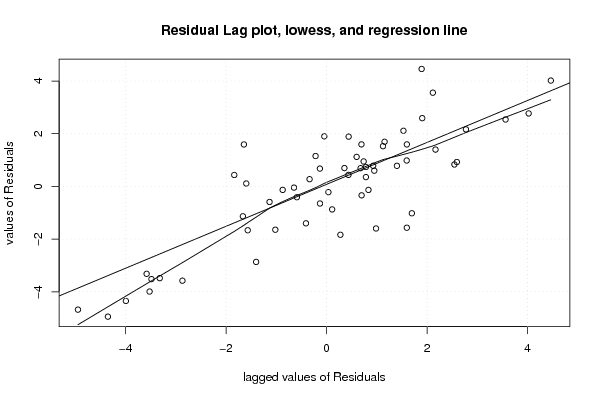
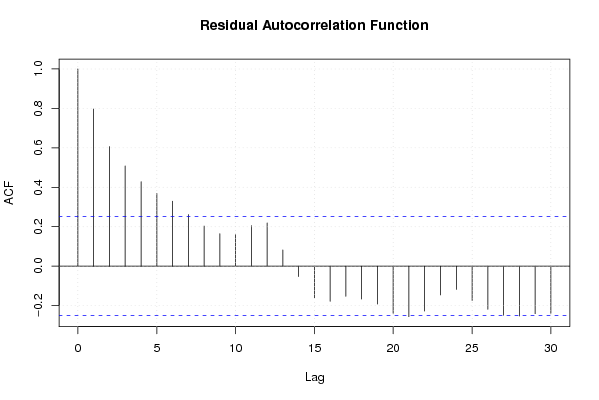
| Multiple Linear Regression - Residual Statistics | |
| Residual Standard Deviation | 2.13420768826542 |
| Sum Squared Residuals | 268.735704942424 |
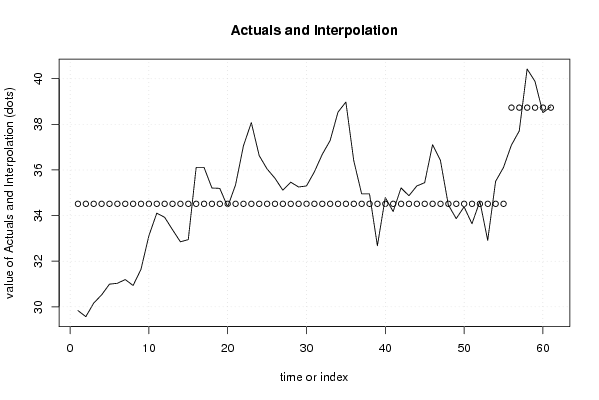
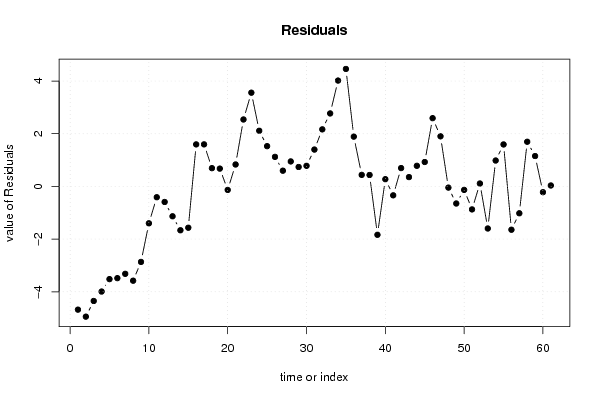
| Multiple Linear Regression - Actuals, Interpolation, and Residuals | |||
| Time or Index | Actuals | Interpolation Forecast | Residuals Prediction Error |
| 1 | 29.837 | 34.5166727272727 | -4.67967272727266 |
| 2 | 29.571 | 34.5166727272727 | -4.94567272727273 |
| 3 | 30.167 | 34.5166727272727 | -4.34967272727273 |
| 4 | 30.524 | 34.5166727272727 | -3.99267272727273 |
| 5 | 30.996 | 34.5166727272727 | -3.52067272727273 |
| 6 | 31.033 | 34.5166727272727 | -3.48367272727273 |
| 7 | 31.198 | 34.5166727272727 | -3.31867272727273 |
| 8 | 30.937 | 34.5166727272727 | -3.57967272727273 |
| 9 | 31.649 | 34.5166727272727 | -2.86767272727273 |
| 10 | 33.115 | 34.5166727272727 | -1.40167272727273 |
| 11 | 34.106 | 34.5166727272727 | -0.410672727272726 |
| 12 | 33.926 | 34.5166727272727 | -0.590672727272726 |
| 13 | 33.382 | 34.5166727272727 | -1.13467272727273 |
| 14 | 32.851 | 34.5166727272727 | -1.66567272727273 |
| 15 | 32.948 | 34.5166727272727 | -1.56867272727273 |
| 16 | 36.112 | 34.5166727272727 | 1.59532727272727 |
| 17 | 36.113 | 34.5166727272727 | 1.59632727272727 |
| 18 | 35.21 | 34.5166727272727 | 0.693327272727273 |
| 19 | 35.193 | 34.5166727272727 | 0.67632727272727 |
| 20 | 34.383 | 34.5166727272727 | -0.133672727272725 |
| 21 | 35.349 | 34.5166727272727 | 0.832327272727269 |
| 22 | 37.058 | 34.5166727272727 | 2.54132727272727 |
| 23 | 38.076 | 34.5166727272727 | 3.55932727272727 |
| 24 | 36.63 | 34.5166727272727 | 2.11332727272727 |
| 25 | 36.045 | 34.5166727272727 | 1.52832727272727 |
| 26 | 35.638 | 34.5166727272727 | 1.12132727272727 |
| 27 | 35.114 | 34.5166727272727 | 0.597327272727269 |
| 28 | 35.465 | 34.5166727272727 | 0.948327272727276 |
| 29 | 35.254 | 34.5166727272727 | 0.73732727272727 |
| 30 | 35.299 | 34.5166727272727 | 0.782327272727272 |
| 31 | 35.916 | 34.5166727272727 | 1.39932727272727 |
| 32 | 36.683 | 34.5166727272727 | 2.16632727272727 |
| 33 | 37.288 | 34.5166727272727 | 2.77132727272727 |
| 34 | 38.536 | 34.5166727272727 | 4.01932727272727 |
| 35 | 38.977 | 34.5166727272727 | 4.46032727272727 |
| 36 | 36.407 | 34.5166727272727 | 1.89032727272727 |
| 37 | 34.955 | 34.5166727272727 | 0.438327272727270 |
| 38 | 34.951 | 34.5166727272727 | 0.434327272727273 |
| 39 | 32.68 | 34.5166727272727 | -1.83667272727273 |
| 40 | 34.791 | 34.5166727272727 | 0.274327272727269 |
| 41 | 34.178 | 34.5166727272727 | -0.338672727272731 |
| 42 | 35.213 | 34.5166727272727 | 0.696327272727273 |
| 43 | 34.871 | 34.5166727272727 | 0.354327272727274 |
| 44 | 35.299 | 34.5166727272727 | 0.782327272727272 |
| 45 | 35.443 | 34.5166727272727 | 0.92632727272727 |
| 46 | 37.108 | 34.5166727272727 | 2.59132727272727 |
| 47 | 36.419 | 34.5166727272727 | 1.90232727272727 |
| 48 | 34.471 | 34.5166727272727 | -0.0456727272727315 |
| 49 | 33.868 | 34.5166727272727 | -0.648672727272726 |
| 50 | 34.385 | 34.5166727272727 | -0.13167272727273 |
| 51 | 33.643 | 34.5166727272727 | -0.873672727272727 |
| 52 | 34.627 | 34.5166727272727 | 0.110327272727274 |
| 53 | 32.919 | 34.5166727272727 | -1.59767272727273 |
| 54 | 35.5 | 34.5166727272727 | 0.983327272727272 |
| 55 | 36.11 | 34.5166727272727 | 1.59332727272727 |
| 56 | 37.086 | 38.7311666666667 | -1.64516666666667 |
| 57 | 37.711 | 38.7311666666667 | -1.02016666666667 |
| 58 | 40.427 | 38.7311666666667 | 1.69583333333333 |
| 59 | 39.884 | 38.7311666666667 | 1.15283333333333 |
| 60 | 38.512 | 38.7311666666667 | -0.219166666666666 |
| 61 | 38.767 | 38.7311666666667 | 0.0358333333333365 |
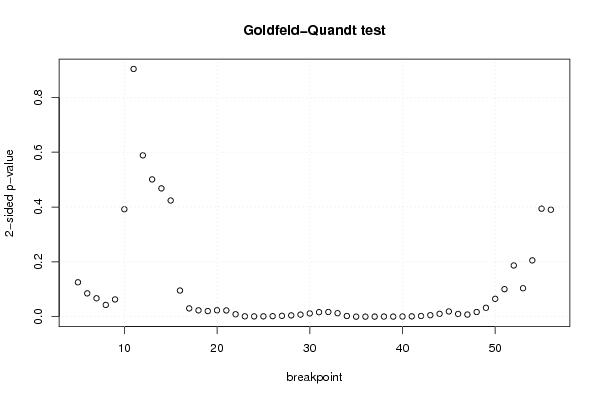
| Goldfeld-Quandt test for Heteroskedasticity | |||
| p-values | Alternative Hypothesis | ||
| breakpoint index | greater | 2-sided | less |
| 5 | 0.0626829249541198 | 0.125365849908240 | 0.93731707504588 |
| 6 | 0.0425476041584414 | 0.0850952083168828 | 0.957452395841559 |
| 7 | 0.0335711086672994 | 0.0671422173345989 | 0.9664288913327 |
| 8 | 0.0214191998969079 | 0.0428383997938157 | 0.978580800103092 |
| 9 | 0.0314467435808462 | 0.0628934871616924 | 0.968553256419154 |
| 10 | 0.195929313880225 | 0.39185862776045 | 0.804070686119775 |
| 11 | 0.548227536309479 | 0.903544927381042 | 0.451772463690521 |
| 12 | 0.705799848517888 | 0.588400302964225 | 0.294200151482112 |
| 13 | 0.749661470500532 | 0.500677058998937 | 0.250338529499468 |
| 14 | 0.766007026929998 | 0.467985946140004 | 0.233992973070002 |
| 15 | 0.788132348790623 | 0.423735302418754 | 0.211867651209377 |
| 16 | 0.952303259761956 | 0.0953934804760876 | 0.0476967402380438 |
| 17 | 0.984868633872509 | 0.0302627322549829 | 0.0151313661274914 |
| 18 | 0.988424289531949 | 0.0231514209361024 | 0.0115757104680512 |
| 19 | 0.98979121083946 | 0.0204175783210785 | 0.0102087891605392 |
| 20 | 0.988277652861986 | 0.0234446942760281 | 0.0117223471380140 |
| 21 | 0.988634663265912 | 0.0227306734681756 | 0.0113653367340878 |
| 22 | 0.99562199029027 | 0.00875601941945832 | 0.00437800970972916 |
| 23 | 0.99934114998921 | 0.00131770002158000 | 0.000658850010790001 |
| 24 | 0.99948844091538 | 0.00102311816923886 | 0.000511559084619431 |
| 25 | 0.99937896943544 | 0.00124206112911999 | 0.000621030564559994 |
| 26 | 0.999081993547636 | 0.00183601290472694 | 0.00091800645236347 |
| 27 | 0.99848833046609 | 0.00302333906782059 | 0.00151166953391029 |
| 28 | 0.997648640820287 | 0.00470271835942593 | 0.00235135917971297 |
| 29 | 0.996241276135172 | 0.00751744772965543 | 0.00375872386482772 |
| 30 | 0.994088222102705 | 0.0118235557945894 | 0.00591177789729468 |
| 31 | 0.991808248211715 | 0.0163835035765698 | 0.00819175178828492 |
| 32 | 0.991450428436195 | 0.0170991431276096 | 0.00854957156380479 |
| 33 | 0.993668281443066 | 0.0126634371138674 | 0.00633171855693368 |
| 34 | 0.998773609428611 | 0.00245278114277755 | 0.00122639057138877 |
| 35 | 0.99995832955128 | 8.33408974416619e-05 | 4.16704487208309e-05 |
| 36 | 0.999956403416268 | 8.71931674632327e-05 | 4.35965837316164e-05 |
| 37 | 0.999897893580323 | 0.000204212839354634 | 0.000102106419677317 |
| 38 | 0.999768535888144 | 0.000462928223711566 | 0.000231464111855783 |
| 39 | 0.999868165313213 | 0.000263669373573840 | 0.000131834686786920 |
| 40 | 0.99969404446581 | 0.000611911068378223 | 0.000305955534189112 |
| 41 | 0.999413214068093 | 0.00117357186381343 | 0.000586785931906717 |
| 42 | 0.998745920588225 | 0.00250815882354923 | 0.00125407941177462 |
| 43 | 0.997353017491479 | 0.00529396501704243 | 0.00264698250852122 |
| 44 | 0.994798578598467 | 0.0104028428030652 | 0.0052014214015326 |
| 45 | 0.99045595115564 | 0.0190880976887180 | 0.00954404884435901 |
| 46 | 0.995017729196032 | 0.00996454160793606 | 0.00498227080396803 |
| 47 | 0.99615164102922 | 0.0076967179415577 | 0.00384835897077885 |
| 48 | 0.99150163676243 | 0.0169967264751391 | 0.00849836323756957 |
| 49 | 0.983814096790247 | 0.0323718064195052 | 0.0161859032097526 |
| 50 | 0.967449251517028 | 0.065101496965944 | 0.032550748482972 |
| 51 | 0.949798582060281 | 0.100402835879438 | 0.0502014179397191 |
| 52 | 0.906582440518672 | 0.186835118962657 | 0.0934175594813285 |
| 53 | 0.948127105495879 | 0.103745789008243 | 0.0518728945041213 |
| 54 | 0.897294372831929 | 0.205411254336142 | 0.102705627168071 |
| 55 | 0.803048279296365 | 0.39390344140727 | 0.196951720703635 |
| 56 | 0.804979680346282 | 0.390040639307436 | 0.195020319653718 |
| Meta Analysis of Goldfeld-Quandt test for Heteroskedasticity | |||
| Description | # significant tests | % significant tests | OK/NOK |
| 1% type I error level | 20 | 0.384615384615385 | NOK |
| 5% type I error level | 34 | 0.653846153846154 | NOK |
| 10% type I error level | 39 | 0.75 | NOK |