| Multiple Linear Regression - Estimated Regression Equation |
| wm[t] = + 3.03276769585098 + 0.397803021818835wv[t] + e[t] |
| Multiple Linear Regression - Ordinary Least Squares | |||||
| Variable | Parameter | S.D. | T-STAT H0: parameter = 0 | 2-tail p-value | 1-tail p-value |
| (Intercept) | 3.03276769585098 | 0.537548 | 5.6419 | 1e-06 | 0 |
| wv | 0.397803021818835 | 0.072424 | 5.4927 | 1e-06 | 1e-06 |
| Multiple Linear Regression - Regression Statistics | |
| Multiple R | 0.591710957513193 |
| R-squared | 0.35012185724118 |
| Adjusted R-squared | 0.338516890406201 |
| F-TEST (value) | 30.1700006746995 |
| F-TEST (DF numerator) | 1 |
| F-TEST (DF denominator) | 56 |
| p-value | 1.00029949146041e-06 |
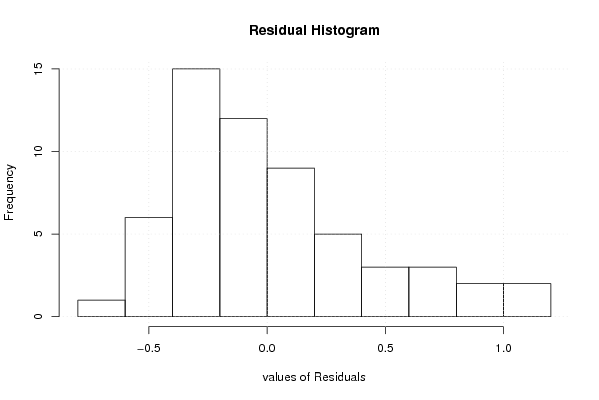
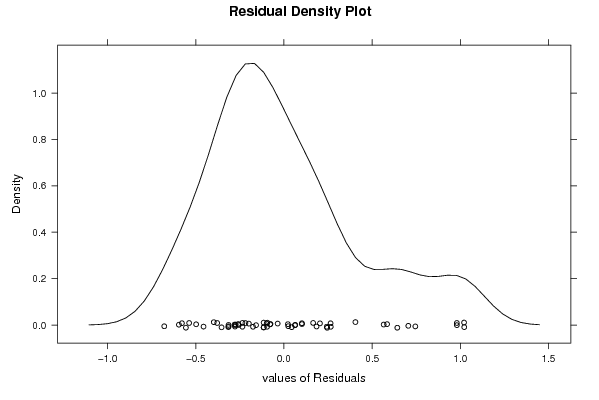
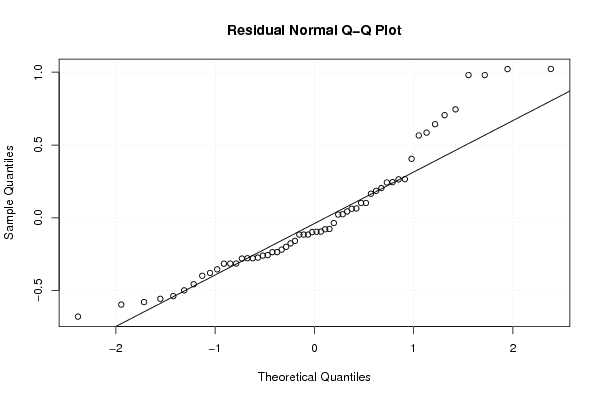
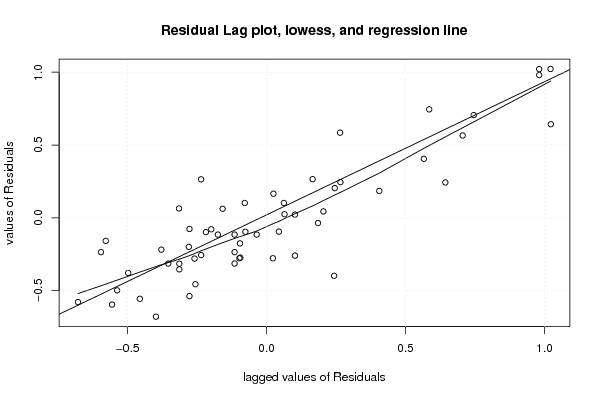
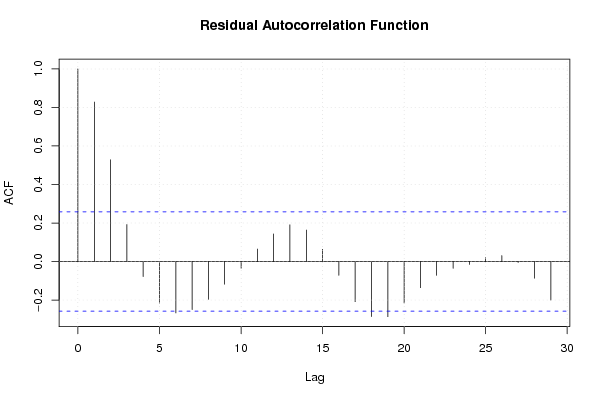
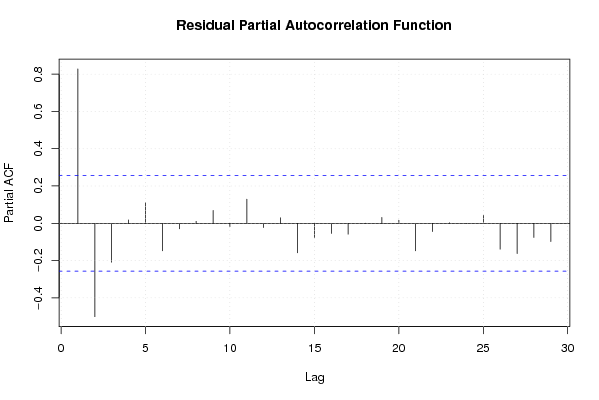
| Multiple Linear Regression - Residual Statistics | |
| Residual Standard Deviation | 0.430961123434683 |
| Sum Squared Residuals | 10.4007394350767 |
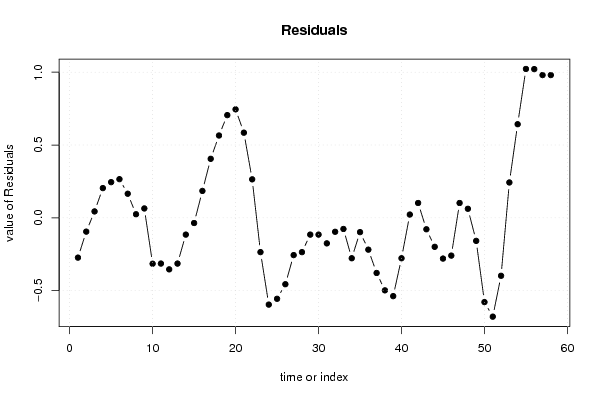
| Multiple Linear Regression - Actuals, Interpolation, and Residuals | |||
| Time or Index | Actuals | Interpolation Forecast | Residuals Prediction Error |
| 1 | 6.3 | 6.57321459003865 | -0.273214590038652 |
| 2 | 6.2 | 6.29475247476543 | -0.0947524747654248 |
| 3 | 6.1 | 6.05607066167412 | 0.0439293383258764 |
| 4 | 6.3 | 6.09585096385601 | 0.204149036143993 |
| 5 | 6.5 | 6.25497217258354 | 0.245027827416459 |
| 6 | 6.6 | 6.33453277694731 | 0.265467223052692 |
| 7 | 6.5 | 6.33453277694731 | 0.165467223052692 |
| 8 | 6.2 | 6.17541156821977 | 0.0245884317802262 |
| 9 | 6.2 | 6.13563126603789 | 0.0643687339621099 |
| 10 | 5.9 | 6.21519187040166 | -0.315191870401657 |
| 11 | 6.1 | 6.41409338131107 | -0.314093381311075 |
| 12 | 6.1 | 6.45387368349296 | -0.353873683492958 |
| 13 | 6.1 | 6.41409338131107 | -0.314093381311075 |
| 14 | 6.1 | 6.21519187040166 | -0.115191870401658 |
| 15 | 6.1 | 6.13563126603789 | -0.0356312660378906 |
| 16 | 6.4 | 6.21519187040166 | 0.184808129598343 |
| 17 | 6.7 | 6.29475247476542 | 0.405247525234576 |
| 18 | 6.9 | 6.33453277694731 | 0.565467223052692 |
| 19 | 7 | 6.29475247476542 | 0.705247525234576 |
| 20 | 7 | 6.25497217258354 | 0.74502782741646 |
| 21 | 6.8 | 6.21519187040166 | 0.584808129598342 |
| 22 | 6.4 | 6.13563126603789 | 0.26436873396211 |
| 23 | 5.9 | 6.13563126603789 | -0.23563126603789 |
| 24 | 5.5 | 6.09585096385601 | -0.595850963856007 |
| 25 | 5.5 | 6.05607066167412 | -0.556070661674123 |
| 26 | 5.6 | 6.05607066167412 | -0.456070661674124 |
| 27 | 5.8 | 6.05607066167412 | -0.256070661674123 |
| 28 | 5.9 | 6.13563126603789 | -0.23563126603789 |
| 29 | 6.1 | 6.21519187040166 | -0.115191870401658 |
| 30 | 6.1 | 6.21519187040166 | -0.115191870401658 |
| 31 | 6 | 6.17541156821977 | -0.175411568219774 |
| 32 | 6 | 6.09585096385601 | -0.095850963856007 |
| 33 | 5.9 | 5.97651005731036 | -0.0765100573103562 |
| 34 | 5.5 | 5.77760854640094 | -0.277608546400939 |
| 35 | 5.6 | 5.69804794203717 | -0.0980479420371725 |
| 36 | 5.4 | 5.6184873376734 | -0.218487337673405 |
| 37 | 5.2 | 5.57870703549152 | -0.378707035491522 |
| 38 | 5.2 | 5.69804794203717 | -0.498047942037172 |
| 39 | 5.2 | 5.73782824421906 | -0.537828244219055 |
| 40 | 5.5 | 5.77760854640094 | -0.277608546400939 |
| 41 | 5.8 | 5.77760854640094 | 0.0223914535990607 |
| 42 | 5.8 | 5.69804794203717 | 0.101952057962828 |
| 43 | 5.5 | 5.57870703549152 | -0.0787070354915217 |
| 44 | 5.3 | 5.49914643112775 | -0.199146431127755 |
| 45 | 5.1 | 5.3798055245821 | -0.279805524582105 |
| 46 | 5.2 | 5.45936612894587 | -0.259366128945871 |
| 47 | 5.8 | 5.69804794203717 | 0.101952057962828 |
| 48 | 5.8 | 5.73782824421906 | 0.0621717557809444 |
| 49 | 5.5 | 5.65826763985529 | -0.158267639855288 |
| 50 | 5 | 5.57870703549152 | -0.578707035491522 |
| 51 | 4.9 | 5.57870703549152 | -0.678707035491521 |
| 52 | 5.3 | 5.69804794203717 | -0.398047942037172 |
| 53 | 6.1 | 5.8571691507647 | 0.242830849235294 |
| 54 | 6.5 | 5.8571691507647 | 0.642830849235294 |
| 55 | 6.8 | 5.77760854640094 | 1.02239145359906 |
| 56 | 6.6 | 5.57870703549152 | 1.02129296450848 |
| 57 | 6.4 | 5.41958582676399 | 0.980414173236013 |
| 58 | 6.4 | 5.41958582676399 | 0.980414173236013 |
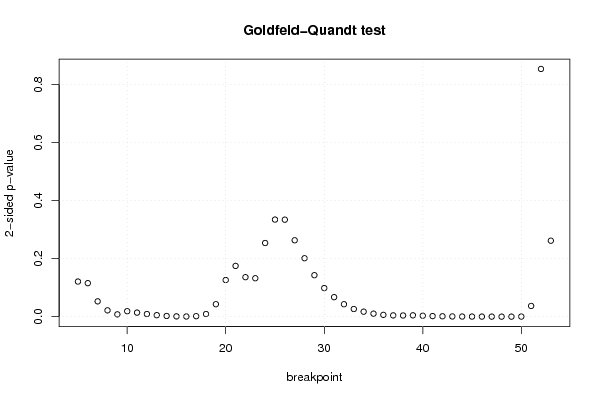
| Goldfeld-Quandt test for Heteroskedasticity | |||
| p-values | Alternative Hypothesis | ||
| breakpoint index | greater | 2-sided | less |
| 5 | 0.0605137986150324 | 0.121027597230065 | 0.939486201384968 |
| 6 | 0.0577400812090342 | 0.115480162418068 | 0.942259918790966 |
| 7 | 0.0264304204017075 | 0.0528608408034151 | 0.973569579598292 |
| 8 | 0.0109075027624124 | 0.0218150055248249 | 0.989092497237588 |
| 9 | 0.00396170849199775 | 0.0079234169839955 | 0.996038291508002 |
| 10 | 0.00941642718787281 | 0.0188328543757456 | 0.990583572812127 |
| 11 | 0.00698519159346992 | 0.0139703831869398 | 0.99301480840653 |
| 12 | 0.00455869755960083 | 0.00911739511920166 | 0.9954413024404 |
| 13 | 0.00257203556198926 | 0.00514407112397851 | 0.99742796443801 |
| 14 | 0.00121128112040257 | 0.00242256224080514 | 0.998788718879597 |
| 15 | 0.000519111005473103 | 0.00103822201094621 | 0.999480888994527 |
| 16 | 0.000285792232864783 | 0.000571584465729566 | 0.999714207767135 |
| 17 | 0.000810441515594277 | 0.00162088303118855 | 0.999189558484406 |
| 18 | 0.00453914078980642 | 0.00907828157961284 | 0.995460859210194 |
| 19 | 0.0214704836273814 | 0.0429409672547629 | 0.978529516372619 |
| 20 | 0.0631246429752348 | 0.126249285950470 | 0.936875357024765 |
| 21 | 0.087514990767626 | 0.175029981535252 | 0.912485009232374 |
| 22 | 0.06805737867638 | 0.13611475735276 | 0.93194262132362 |
| 23 | 0.066226952738082 | 0.132453905476164 | 0.933773047261918 |
| 24 | 0.126956688683435 | 0.25391337736687 | 0.873043311316565 |
| 25 | 0.167320688148515 | 0.334641376297031 | 0.832679311851485 |
| 26 | 0.167148055586969 | 0.334296111173938 | 0.832851944413031 |
| 27 | 0.131663295363510 | 0.263326590727020 | 0.86833670463649 |
| 28 | 0.100688142182938 | 0.201376284365876 | 0.899311857817062 |
| 29 | 0.0714846444001248 | 0.142969288800250 | 0.928515355599875 |
| 30 | 0.0492378504388421 | 0.0984757008776843 | 0.950762149561158 |
| 31 | 0.0335909898773240 | 0.0671819797546479 | 0.966409010122676 |
| 32 | 0.0214066528679148 | 0.0428133057358296 | 0.978593347132085 |
| 33 | 0.0131713171236495 | 0.026342634247299 | 0.98682868287635 |
| 34 | 0.0085838239856091 | 0.0171676479712182 | 0.99141617601439 |
| 35 | 0.00516969979295925 | 0.0103393995859185 | 0.99483030020704 |
| 36 | 0.00310603293510551 | 0.00621206587021103 | 0.996893967064894 |
| 37 | 0.00219133479420471 | 0.00438266958840942 | 0.997808665205795 |
| 38 | 0.002046242983419 | 0.004092485966838 | 0.99795375701658 |
| 39 | 0.00229345274006921 | 0.00458690548013841 | 0.99770654725993 |
| 40 | 0.00160362517363808 | 0.00320725034727616 | 0.998396374826362 |
| 41 | 0.000992864205933396 | 0.00198572841186679 | 0.999007135794067 |
| 42 | 0.000649557541350113 | 0.00129911508270023 | 0.99935044245865 |
| 43 | 0.000367384038595838 | 0.000734768077191676 | 0.999632615961404 |
| 44 | 0.000212180766065121 | 0.000424361532130241 | 0.999787819233935 |
| 45 | 0.000147316029121720 | 0.000294632058243440 | 0.999852683970878 |
| 46 | 0.000127104168340875 | 0.000254208336681751 | 0.99987289583166 |
| 47 | 6.66496981859274e-05 | 0.000133299396371855 | 0.999933350301814 |
| 48 | 3.12618384571333e-05 | 6.25236769142666e-05 | 0.999968738161543 |
| 49 | 1.97475682157916e-05 | 3.94951364315832e-05 | 0.999980252431784 |
| 50 | 0.000161791436775501 | 0.000323582873551002 | 0.999838208563224 |
| 51 | 0.0184690128250700 | 0.0369380256501401 | 0.98153098717493 |
| 52 | 0.573063903468884 | 0.853872193062232 | 0.426936096531116 |
| 53 | 0.869064250688448 | 0.261871498623105 | 0.130935749311552 |
| Meta Analysis of Goldfeld-Quandt test for Heteroskedasticity | |||
| Description | # significant tests | % significant tests | OK/NOK |
| 1% type I error level | 23 | 0.469387755102041 | NOK |
| 5% type I error level | 32 | 0.653061224489796 | NOK |
| 10% type I error level | 35 | 0.714285714285714 | NOK |