| Multiple Linear Regression - Estimated Regression Equation |
| Y[t] = + 8.55056685635983 -0.000128679428252901X[t] + 0.0738198554733517M1[t] -0.371626817583526M2[t] -0.529082118656772M3[t] -0.590577953777158M4[t] -0.308473981755963M5[t] -0.0330163030212729M6[t] + 0.165507164044993M7[t] + 0.0760396380719248M8[t] -0.0464566797393355M9[t] -0.179002860352318M10[t] -0.410294417357079M11[t] -0.0192537224129794t + e[t] |
| Multiple Linear Regression - Ordinary Least Squares | |||||
| Variable | Parameter | S.D. | T-STAT H0: parameter = 0 | 2-tail p-value | 1-tail p-value |
| (Intercept) | 8.55056685635983 | 0.89064 | 9.6005 | 0 | 0 |
| X | -0.000128679428252901 | 0.00016 | -0.8049 | 0.424948 | 0.212474 |
| M1 | 0.0738198554733517 | 0.377536 | 0.1955 | 0.84582 | 0.42291 |
| M2 | -0.371626817583526 | 0.402273 | -0.9238 | 0.3603 | 0.18015 |
| M3 | -0.529082118656772 | 0.395282 | -1.3385 | 0.187175 | 0.093588 |
| M4 | -0.590577953777158 | 0.39124 | -1.5095 | 0.137865 | 0.068932 |
| M5 | -0.308473981755963 | 0.389053 | -0.7929 | 0.431829 | 0.215915 |
| M6 | -0.0330163030212729 | 0.397889 | -0.083 | 0.934221 | 0.46711 |
| M7 | 0.165507164044993 | 0.388255 | 0.4263 | 0.671846 | 0.335923 |
| M8 | 0.0760396380719248 | 0.390305 | 0.1948 | 0.846373 | 0.423186 |
| M9 | -0.0464566797393355 | 0.390087 | -0.1191 | 0.905709 | 0.452855 |
| M10 | -0.179002860352318 | 0.39007 | -0.4589 | 0.648421 | 0.324211 |
| M11 | -0.410294417357079 | 0.387826 | -1.0579 | 0.295493 | 0.147747 |
| t | -0.0192537224129794 | 0.005158 | -3.7325 | 0.000511 | 0.000256 |
| Multiple Linear Regression - Regression Statistics | |
| Multiple R | 0.572985276305044 |
| R-squared | 0.328312126862368 |
| Adjusted R-squared | 0.142526119398767 |
| F-TEST (value) | 1.76715206567261 |
| F-TEST (DF numerator) | 13 |
| F-TEST (DF denominator) | 47 |
| p-value | 0.0776405512042548 |
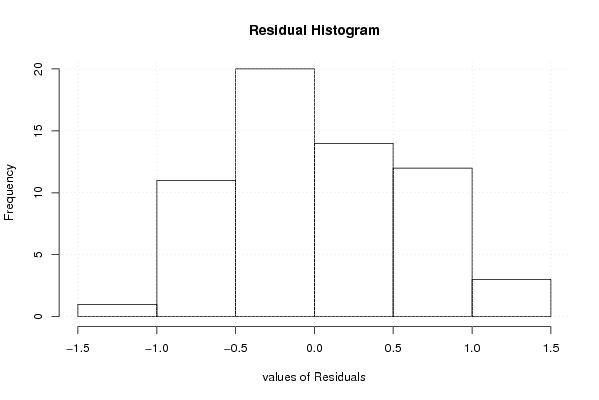
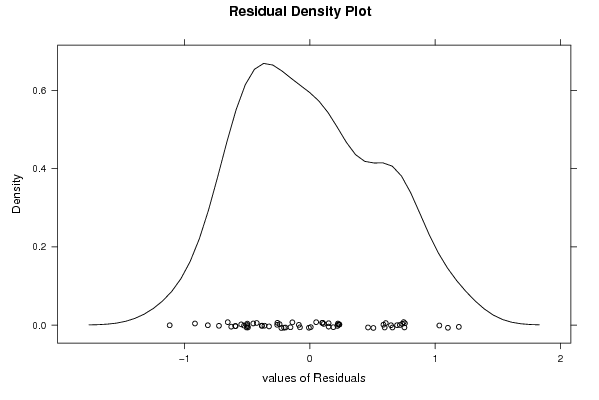
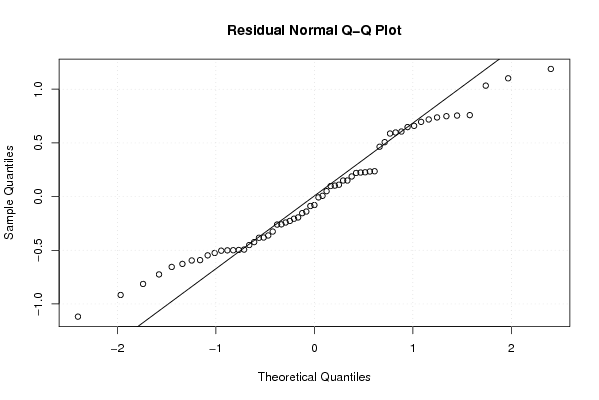
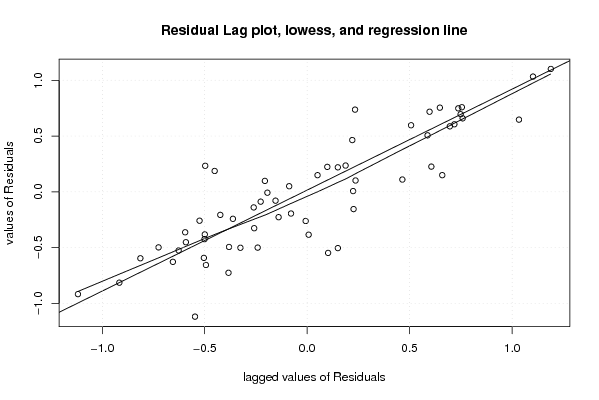
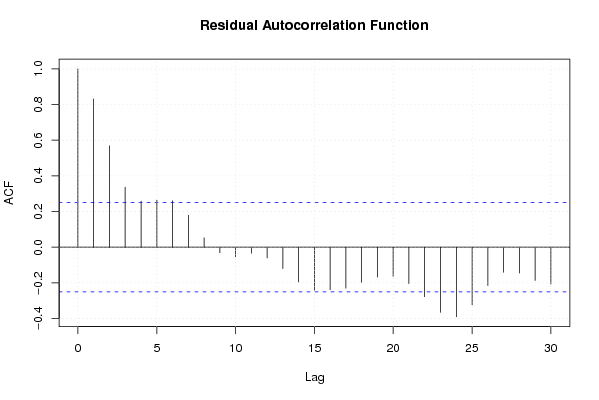
| Multiple Linear Regression - Residual Statistics | |
| Residual Standard Deviation | 0.612630271023394 |
| Sum Squared Residuals | 17.6398449017873 |
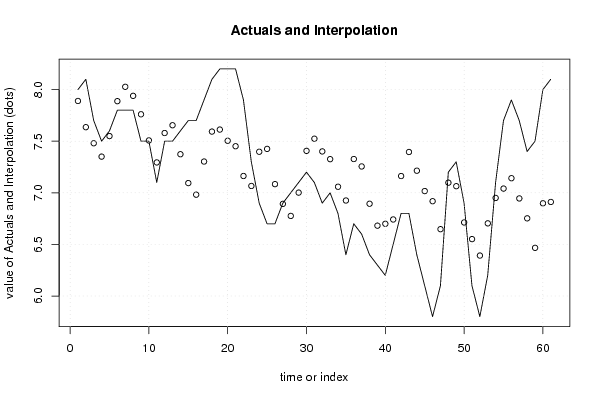
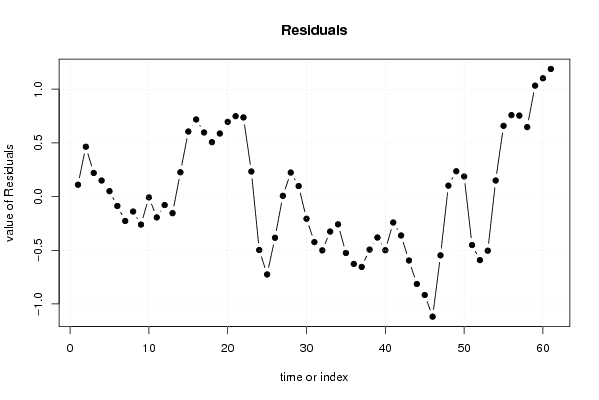
| Multiple Linear Regression - Actuals, Interpolation, and Residuals | |||
| Time or Index | Actuals | Interpolation Forecast | Residuals Prediction Error |
| 1 | 8 | 7.88967536833406 | 0.110324631665942 |
| 2 | 8.1 | 7.63575187634246 | 0.464248123657535 |
| 3 | 7.7 | 7.48001759966146 | 0.219982400338537 |
| 4 | 7.5 | 7.35049853882025 | 0.149501461179753 |
| 5 | 7.6 | 7.54952379201502 | 0.0504762079849763 |
| 6 | 7.8 | 7.88782522356209 | -0.087825223562086 |
| 7 | 7.8 | 8.02694698660047 | -0.226946986600467 |
| 8 | 7.8 | 7.93945784387615 | -0.139457843876148 |
| 9 | 7.5 | 7.76090548717158 | -0.260905487171578 |
| 10 | 7.5 | 7.50744883582582 | -0.0074488358258244 |
| 11 | 7.1 | 7.29422059060143 | -0.194220590601427 |
| 12 | 7.5 | 7.57897207780863 | -0.0789720778086287 |
| 13 | 7.5 | 7.65451295767422 | -0.154512957674223 |
| 14 | 7.6 | 7.37369546517776 | 0.226304534822237 |
| 15 | 7.7 | 7.09417157851747 | 0.605828421482531 |
| 16 | 7.7 | 6.98176688163389 | 0.71823311836611 |
| 17 | 7.9 | 7.30290891224067 | 0.59709108775933 |
| 18 | 8.1 | 7.59308423762115 | 0.506915762378853 |
| 19 | 8.2 | 7.61266281181258 | 0.587337188187416 |
| 20 | 8.2 | 7.50407024285479 | 0.695929757145211 |
| 21 | 8.2 | 7.4512376875533 | 0.748762312446696 |
| 22 | 7.9 | 7.16278023172276 | 0.73721976827724 |
| 23 | 7.3 | 7.066392907352 | 0.233607092648004 |
| 24 | 6.9 | 7.3975976681585 | -0.497597668158496 |
| 25 | 6.7 | 7.42526980071401 | -0.725269800714011 |
| 26 | 6.7 | 7.08397297693869 | -0.383972976938687 |
| 27 | 6.9 | 6.89285185748814 | 0.00714814251186351 |
| 28 | 7 | 6.77607206004396 | 0.223927939956041 |
| 29 | 7.1 | 7.00186263431534 | 0.0981373656846603 |
| 30 | 7.2 | 7.40643397141265 | -0.206433971412645 |
| 31 | 7.1 | 7.5240662699328 | -0.424066269932792 |
| 32 | 6.9 | 7.40106160501067 | -0.501061605010672 |
| 33 | 7 | 7.32583882919318 | -0.325838829193182 |
| 34 | 6.8 | 7.05861347902437 | -0.258613479024368 |
| 35 | 6.4 | 6.92529515874502 | -0.525295158745021 |
| 36 | 6.7 | 7.32714492566236 | -0.627144925662364 |
| 37 | 6.6 | 7.25534786017839 | -0.655347860178387 |
| 38 | 6.4 | 6.89397704559561 | -0.493977045595610 |
| 39 | 6.3 | 6.68149514105508 | -0.381495141055078 |
| 40 | 6.2 | 6.6997000638482 | -0.499700063848193 |
| 41 | 6.5 | 6.74160773514618 | -0.241607735146178 |
| 42 | 6.8 | 7.16239268020335 | -0.362392680203350 |
| 43 | 6.8 | 7.3953217464381 | -0.595321746438095 |
| 44 | 6.4 | 7.21402530051741 | -0.814025300517411 |
| 45 | 6.1 | 7.01668574728792 | -0.91668574728792 |
| 46 | 5.8 | 6.91854516584342 | -1.11854516584342 |
| 47 | 6.1 | 6.64741117790521 | -0.547411177905212 |
| 48 | 7.2 | 7.0980304481304 | 0.101969551869596 |
| 49 | 7.3 | 7.06406513455278 | 0.235934865447219 |
| 50 | 6.9 | 6.71260263594548 | 0.187397364054524 |
| 51 | 6.1 | 6.55146382327785 | -0.451463823277853 |
| 52 | 5.8 | 6.39196245565371 | -0.591962455653711 |
| 53 | 6.2 | 6.70409692628279 | -0.504096926282789 |
| 54 | 7.1 | 6.95026388720077 | 0.149736112799227 |
| 55 | 7.7 | 7.04100218521606 | 0.658997814783937 |
| 56 | 7.9 | 7.14138500774098 | 0.75861499225902 |
| 57 | 7.7 | 6.94533224879402 | 0.754667751205984 |
| 58 | 7.4 | 6.75261228758363 | 0.647387712416369 |
| 59 | 7.5 | 6.46668016539634 | 1.03331983460366 |
| 60 | 8 | 6.8982548802401 | 1.10174511975989 |
| 61 | 8.1 | 6.91112887854654 | 1.18887112145346 |
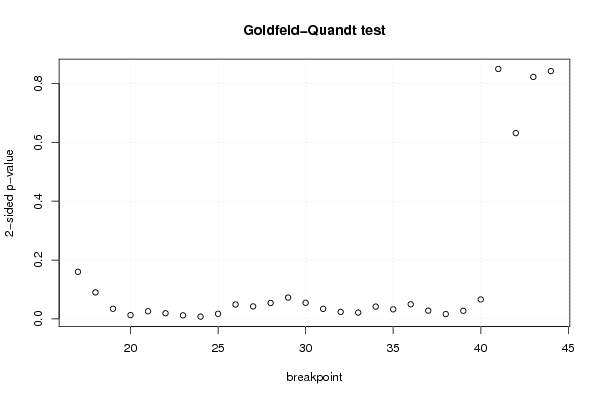
| Goldfeld-Quandt test for Heteroskedasticity | |||
| p-values | Alternative Hypothesis | ||
| breakpoint index | greater | 2-sided | less |
| 17 | 0.079937227776215 | 0.15987445555243 | 0.920062772223785 |
| 18 | 0.0450569346603546 | 0.0901138693207093 | 0.954943065339645 |
| 19 | 0.0172198156982225 | 0.034439631396445 | 0.982780184301777 |
| 20 | 0.00638093653319808 | 0.0127618730663962 | 0.993619063466802 |
| 21 | 0.0129874557005699 | 0.0259749114011398 | 0.98701254429943 |
| 22 | 0.00958584666748967 | 0.0191716933349793 | 0.99041415333251 |
| 23 | 0.00604143075932119 | 0.0120828615186424 | 0.993958569240679 |
| 24 | 0.00380986067289928 | 0.00761972134579856 | 0.9961901393271 |
| 25 | 0.00861941999895475 | 0.0172388399979095 | 0.991380580001045 |
| 26 | 0.0244149665077097 | 0.0488299330154194 | 0.97558503349229 |
| 27 | 0.0212239353623586 | 0.0424478707247173 | 0.97877606463764 |
| 28 | 0.026986367118293 | 0.053972734236586 | 0.973013632881707 |
| 29 | 0.0362145464013921 | 0.0724290928027842 | 0.963785453598608 |
| 30 | 0.0273376458397556 | 0.0546752916795111 | 0.972662354160244 |
| 31 | 0.0170488829159141 | 0.0340977658318282 | 0.982951117084086 |
| 32 | 0.0118875248032109 | 0.0237750496064217 | 0.988112475196789 |
| 33 | 0.0106991930169611 | 0.0213983860339223 | 0.989300806983039 |
| 34 | 0.0209100789066254 | 0.0418201578132509 | 0.979089921093375 |
| 35 | 0.0162855215702096 | 0.0325710431404192 | 0.98371447842979 |
| 36 | 0.024833822324723 | 0.049667644649446 | 0.975166177675277 |
| 37 | 0.0140573697285998 | 0.0281147394571997 | 0.9859426302714 |
| 38 | 0.00820236045698902 | 0.0164047209139780 | 0.99179763954301 |
| 39 | 0.0137534187496892 | 0.0275068374993784 | 0.98624658125031 |
| 40 | 0.0329435821232518 | 0.0658871642465036 | 0.967056417876748 |
| 41 | 0.424658503512361 | 0.849317007024721 | 0.57534149648764 |
| 42 | 0.684294871755839 | 0.631410256488322 | 0.315705128244161 |
| 43 | 0.588847311689932 | 0.822305376620137 | 0.411152688310068 |
| 44 | 0.420971325356986 | 0.841942650713973 | 0.579028674643014 |
| Meta Analysis of Goldfeld-Quandt test for Heteroskedasticity | |||
| Description | # significant tests | % significant tests | OK/NOK |
| 1% type I error level | 1 | 0.0357142857142857 | NOK |
| 5% type I error level | 18 | 0.642857142857143 | NOK |
| 10% type I error level | 23 | 0.821428571428571 | NOK |