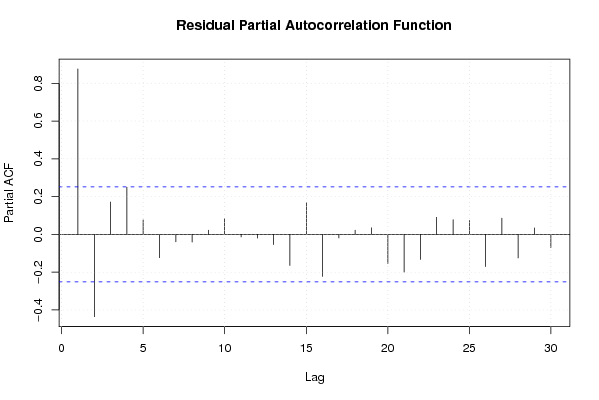
| Multiple Linear Regression - Estimated Regression Equation |
| WerklM[t] = + 6.52362952102874 + 0.000158604824453189Bouwv[t] + 0.0284956355211745M1[t] -0.0471686646110958M2[t] -0.275876137837123M3[t] -0.39960341957532M4[t] -0.232418826118232M5[t] + 0.210864635565684M6[t] + 0.257811253422546M7[t] + 0.213211850240498M8[t] + 0.0753688758530607M9[t] -0.228691681107129M10[t] -0.366391706061917M11[t] + e[t] |
| Multiple Linear Regression - Ordinary Least Squares | |||||
| Variable | Parameter | S.D. | T-STAT H0: parameter = 0 | 2-tail p-value | 1-tail p-value |
| (Intercept) | 6.52362952102874 | 0.795352 | 8.2022 | 0 | 0 |
| Bouwv | 0.000158604824453189 | 0.000158 | 1.0046 | 0.320133 | 0.160066 |
| M1 | 0.0284956355211745 | 0.425141 | 0.067 | 0.946839 | 0.47342 |
| M2 | -0.0471686646110958 | 0.442524 | -0.1066 | 0.915558 | 0.457779 |
| M3 | -0.275876137837123 | 0.438748 | -0.6288 | 0.532474 | 0.266237 |
| M4 | -0.39960341957532 | 0.437016 | -0.9144 | 0.365082 | 0.182541 |
| M5 | -0.232418826118232 | 0.437736 | -0.531 | 0.597897 | 0.298948 |
| M6 | 0.210864635565684 | 0.442207 | 0.4768 | 0.635636 | 0.317818 |
| M7 | 0.257811253422546 | 0.43655 | 0.5906 | 0.557582 | 0.278791 |
| M8 | 0.213211850240498 | 0.437794 | 0.487 | 0.628465 | 0.314233 |
| M9 | 0.0753688758530607 | 0.437962 | 0.1721 | 0.86409 | 0.432045 |
| M10 | -0.228691681107129 | 0.439227 | -0.5207 | 0.604991 | 0.302496 |
| M11 | -0.366391706061917 | 0.436755 | -0.8389 | 0.405686 | 0.202843 |
| Multiple Linear Regression - Regression Statistics | |
| Multiple R | 0.359465052427854 |
| R-squared | 0.129215123916960 |
| Adjusted R-squared | -0.0884810951038002 |
| F-TEST (value) | 0.593557042461255 |
| F-TEST (DF numerator) | 12 |
| F-TEST (DF denominator) | 48 |
| p-value | 0.836476353996469 |
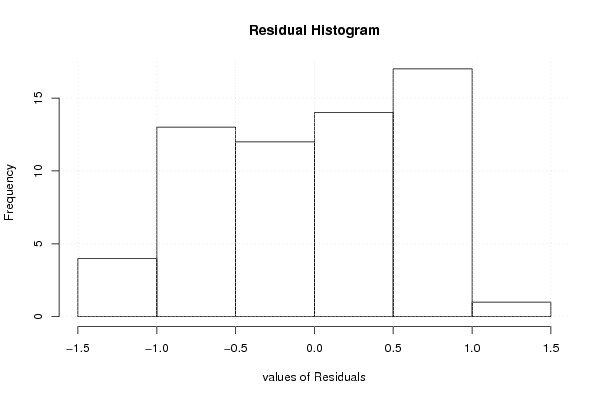
| Multiple Linear Regression - Residual Statistics | |
| Residual Standard Deviation | 0.690237336376786 |
| Sum Squared Residuals | 22.868523865369 |
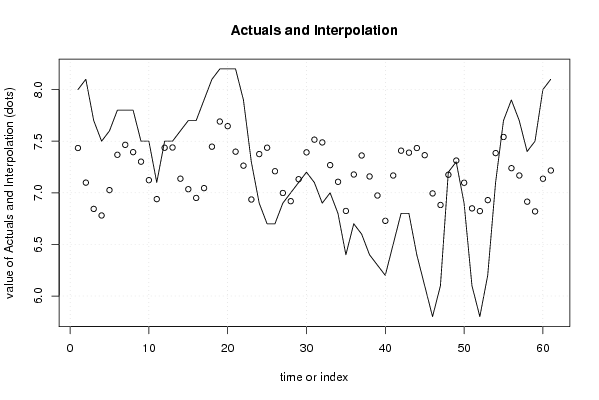
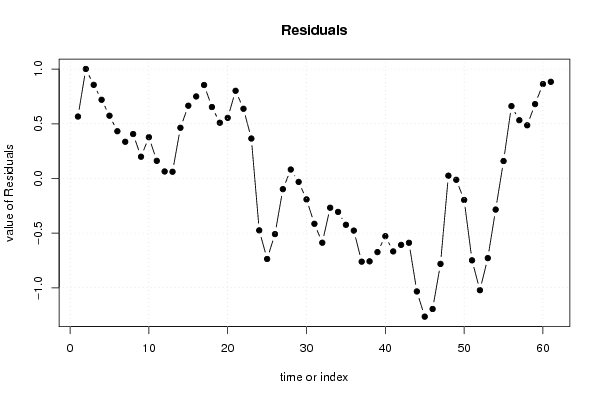
| Multiple Linear Regression - Actuals, Interpolation, and Residuals | |||
| Time or Index | Actuals | Interpolation Forecast | Residuals Prediction Error |
| 1 | 8 | 7.43396798050962 | 0.566032019490377 |
| 2 | 8.1 | 7.09850897792305 | 1.00149102207695 |
| 3 | 7.7 | 6.84394891831115 | 0.856051081688851 |
| 4 | 7.5 | 6.78033286504071 | 0.71966713495929 |
| 5 | 7.6 | 7.02618545142658 | 0.57381454857342 |
| 6 | 7.8 | 7.36827903510936 | 0.431720964890638 |
| 7 | 7.8 | 7.46471035819562 | 0.335289641804381 |
| 8 | 7.8 | 7.3939411589788 | 0.406058841021206 |
| 9 | 7.5 | 7.30145916438497 | 0.198540835615031 |
| 10 | 7.5 | 7.1226964187428 | 0.377303581257201 |
| 11 | 7.1 | 6.93900099469659 | 0.160999005303413 |
| 12 | 7.5 | 7.43640028575684 | 0.063599714243164 |
| 13 | 7.5 | 7.43904333489214 | 0.0609566651078591 |
| 14 | 7.6 | 7.13673274061626 | 0.463267259383735 |
| 15 | 7.7 | 7.03475052212834 | 0.665249477871665 |
| 16 | 7.7 | 6.95004002720562 | 0.749959972794378 |
| 17 | 7.9 | 7.04537663518542 | 0.854623364814584 |
| 18 | 8.1 | 7.44678842321369 | 0.65321157678631 |
| 19 | 8.2 | 7.69056362821696 | 0.509436371783041 |
| 20 | 8.2 | 7.64580562021046 | 0.554194379789542 |
| 21 | 8.2 | 7.39836671212587 | 0.801633287874132 |
| 22 | 7.9 | 7.26274447873496 | 0.637255521265037 |
| 23 | 7.3 | 6.93503587408526 | 0.364964125914743 |
| 24 | 6.9 | 7.3751788235179 | -0.475178823517905 |
| 25 | 6.7 | 7.4368228673498 | -0.736822867349796 |
| 26 | 6.7 | 7.20905654056692 | -0.509056540566918 |
| 27 | 6.9 | 6.99811280767965 | -0.098112807679648 |
| 28 | 7 | 6.91879487678834 | 0.081205123211656 |
| 29 | 7.1 | 7.13165765968795 | -0.0316576596879509 |
| 30 | 7.2 | 7.39206975877734 | -0.192069758777340 |
| 31 | 7.1 | 7.51498808754728 | -0.414988087547280 |
| 32 | 6.9 | 7.48799381987954 | -0.587993819879535 |
| 33 | 7 | 7.2681521512498 | -0.268152151249799 |
| 34 | 6.8 | 7.10636012182412 | -0.306360121824120 |
| 35 | 6.4 | 6.82417110179248 | -0.424171101792477 |
| 36 | 6.7 | 7.17724000260033 | -0.477240002600326 |
| 37 | 6.6 | 7.36148557573453 | -0.761485575734532 |
| 38 | 6.4 | 7.15846160156635 | -0.758461601566351 |
| 39 | 6.3 | 6.97384626953831 | -0.67384626953831 |
| 40 | 6.2 | 6.72815187779561 | -0.528151877795611 |
| 41 | 6.5 | 7.16766095483882 | -0.667660954838824 |
| 42 | 6.8 | 7.40808884604711 | -0.608088846047113 |
| 43 | 6.8 | 7.388897252107 | -0.588897252106994 |
| 44 | 6.4 | 7.43375096991655 | -1.03375096991654 |
| 45 | 6.1 | 7.36442527969289 | -1.26442527969289 |
| 46 | 5.8 | 6.99422651093572 | -1.19422651093572 |
| 47 | 6.1 | 6.88190325789344 | -0.781903257893439 |
| 48 | 7.2 | 7.17486093023353 | 0.0251390697664716 |
| 49 | 7.3 | 7.3124766849785 | -0.0124766849784967 |
| 50 | 6.9 | 7.09724013932742 | -0.19724013932742 |
| 51 | 6.1 | 6.84934148234256 | -0.749341482342558 |
| 52 | 5.8 | 6.82268035316971 | -1.02268035316971 |
| 53 | 6.2 | 6.92911929886123 | -0.729119298861229 |
| 54 | 7.1 | 7.38477393685249 | -0.284773936852494 |
| 55 | 7.7 | 7.54084067393315 | 0.159159326066852 |
| 56 | 7.9 | 7.23850843101467 | 0.661491568985331 |
| 57 | 7.7 | 7.16759669254648 | 0.532403307453522 |
| 58 | 7.4 | 6.9139724697624 | 0.486027530237598 |
| 59 | 7.5 | 6.81988877153224 | 0.680111228467759 |
| 60 | 8 | 7.1363199578914 | 0.863680042108597 |
| 61 | 8.1 | 7.21620355653541 | 0.883796443464588 |
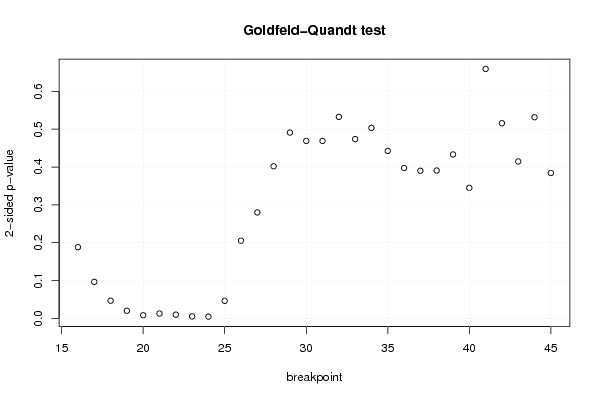
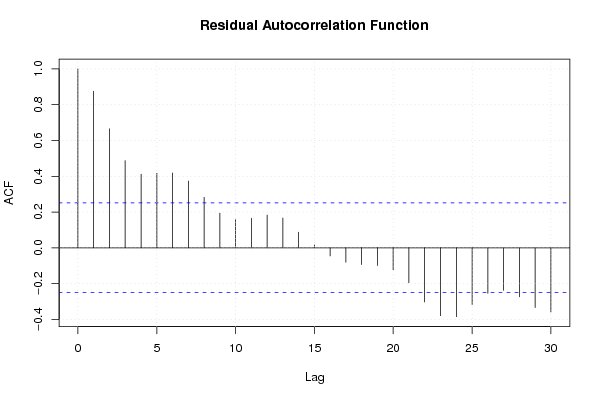
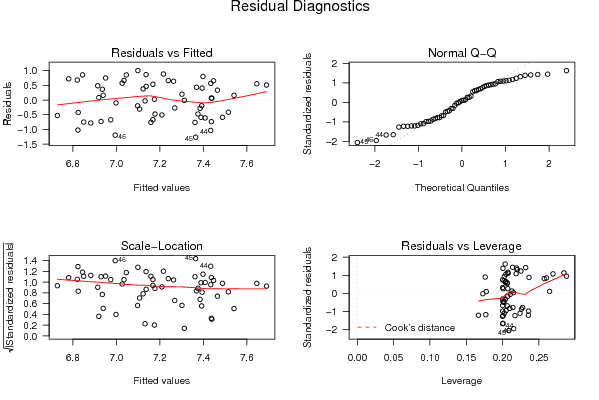
| Goldfeld-Quandt test for Heteroskedasticity | |||
| p-values | Alternative Hypothesis | ||
| breakpoint index | greater | 2-sided | less |
| 16 | 0.0941201440765923 | 0.188240288153185 | 0.905879855923408 |
| 17 | 0.0483429637253793 | 0.0966859274507587 | 0.95165703627462 |
| 18 | 0.0233947956617210 | 0.0467895913234419 | 0.976605204338279 |
| 19 | 0.0101214543368396 | 0.0202429086736793 | 0.98987854566316 |
| 20 | 0.00418759659172501 | 0.00837519318345002 | 0.995812403408275 |
| 21 | 0.00652389819525539 | 0.0130477963905108 | 0.993476101804745 |
| 22 | 0.00500999305297843 | 0.0100199861059569 | 0.994990006947022 |
| 23 | 0.00272217759595647 | 0.00544435519191293 | 0.997277822404044 |
| 24 | 0.00236870385774549 | 0.00473740771549099 | 0.997631296142254 |
| 25 | 0.0232206805166318 | 0.0464413610332636 | 0.976779319483368 |
| 26 | 0.102686043943336 | 0.205372087886673 | 0.897313956056664 |
| 27 | 0.140065089775731 | 0.280130179551462 | 0.859934910224269 |
| 28 | 0.200974093774471 | 0.401948187548942 | 0.799025906225529 |
| 29 | 0.245533950679169 | 0.491067901358339 | 0.75446604932083 |
| 30 | 0.234516145656401 | 0.469032291312803 | 0.765483854343599 |
| 31 | 0.234526839099737 | 0.469053678199473 | 0.765473160900263 |
| 32 | 0.266258277293215 | 0.532516554586431 | 0.733741722706785 |
| 33 | 0.236897104672323 | 0.473794209344646 | 0.763102895327677 |
| 34 | 0.251662274186424 | 0.503324548372848 | 0.748337725813576 |
| 35 | 0.221264117824420 | 0.442528235648839 | 0.77873588217558 |
| 36 | 0.198706226622532 | 0.397412453245065 | 0.801293773377468 |
| 37 | 0.19510662028544 | 0.39021324057088 | 0.80489337971456 |
| 38 | 0.195413364514495 | 0.39082672902899 | 0.804586635485505 |
| 39 | 0.216643900312282 | 0.433287800624564 | 0.783356099687718 |
| 40 | 0.172570831920131 | 0.345141663840261 | 0.82742916807987 |
| 41 | 0.329573970950378 | 0.659147941900756 | 0.670426029049622 |
| 42 | 0.257887808077945 | 0.515775616155891 | 0.742112191922055 |
| 43 | 0.792647533725612 | 0.414704932548776 | 0.207352466274388 |
| 44 | 0.734202475732465 | 0.53159504853507 | 0.265797524267535 |
| 45 | 0.807894496466596 | 0.384211007066809 | 0.192105503533404 |
| Meta Analysis of Goldfeld-Quandt test for Heteroskedasticity | |||
| Description | # significant tests | % significant tests | OK/NOK |
| 1% type I error level | 3 | 0.1 | NOK |
| 5% type I error level | 8 | 0.266666666666667 | NOK |
| 10% type I error level | 9 | 0.3 | NOK |