| Multiple Linear Regression - Estimated Regression Equation |
| Y[t] = + 50.2362928119604 -10.5265285686030X[t] -0.202061509463685Y1[t] + 0.236569774841816Y2[t] + 0.554834223280099Y3[t] -0.0160517215222272Y4[t] + 15.3454731041248M1[t] -1.3210319312054M2[t] -18.4272530266396M3[t] -18.0250317516137M4[t] -11.374623572876M5[t] + 1.64234957827378M6[t] -3.43736217073495M7[t] -8.17796939620031M8[t] -2.59167880781004M9[t] -24.2441038493184M10[t] -20.5106923504080M11[t] + 0.121203282376966t + e[t] |
| Multiple Linear Regression - Ordinary Least Squares | |||||
| Variable | Parameter | S.D. | T-STAT H0: parameter = 0 | 2-tail p-value | 1-tail p-value |
| (Intercept) | 50.2362928119604 | 17.613864 | 2.8521 | 0.006912 | 0.003456 |
| X | -10.5265285686030 | 2.790755 | -3.7719 | 0.000538 | 0.000269 |
| Y1 | -0.202061509463685 | 0.156023 | -1.2951 | 0.202908 | 0.101454 |
| Y2 | 0.236569774841816 | 0.120681 | 1.9603 | 0.057134 | 0.028567 |
| Y3 | 0.554834223280099 | 0.121799 | 4.5553 | 5e-05 | 2.5e-05 |
| Y4 | -0.0160517215222272 | 0.149372 | -0.1075 | 0.914974 | 0.457487 |
| M1 | 15.3454731041248 | 5.05474 | 3.0359 | 0.004259 | 0.00213 |
| M2 | -1.3210319312054 | 7.150494 | -0.1847 | 0.854385 | 0.427192 |
| M3 | -18.4272530266396 | 4.747283 | -3.8816 | 0.000389 | 0.000195 |
| M4 | -18.0250317516137 | 3.206325 | -5.6217 | 2e-06 | 1e-06 |
| M5 | -11.374623572876 | 2.91686 | -3.8996 | 0.000369 | 0.000185 |
| M6 | 1.64234957827378 | 3.432236 | 0.4785 | 0.634961 | 0.31748 |
| M7 | -3.43736217073495 | 4.611566 | -0.7454 | 0.460512 | 0.230256 |
| M8 | -8.17796939620031 | 4.622097 | -1.7693 | 0.08466 | 0.04233 |
| M9 | -2.59167880781004 | 3.509868 | -0.7384 | 0.464693 | 0.232347 |
| M10 | -24.2441038493184 | 4.060683 | -5.9704 | 1e-06 | 0 |
| M11 | -20.5106923504080 | 4.351302 | -4.7137 | 3.1e-05 | 1.5e-05 |
| t | 0.121203282376966 | 0.058058 | 2.0876 | 0.043413 | 0.021707 |
| Multiple Linear Regression - Regression Statistics | |
| Multiple R | 0.947256615280796 |
| R-squared | 0.89729509519323 |
| Adjusted R-squared | 0.852526290533869 |
| F-TEST (value) | 20.0428647139588 |
| F-TEST (DF numerator) | 17 |
| F-TEST (DF denominator) | 39 |
| p-value | 3.530509218308e-14 |
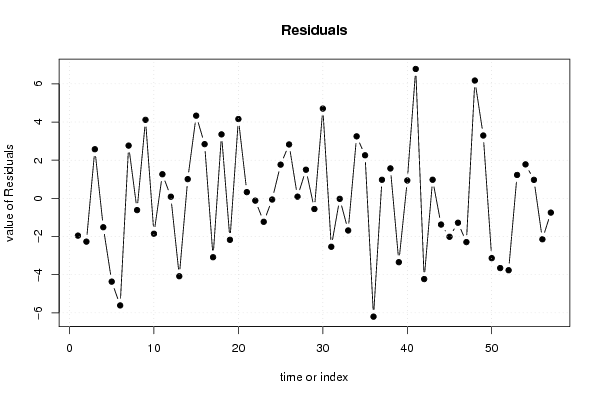
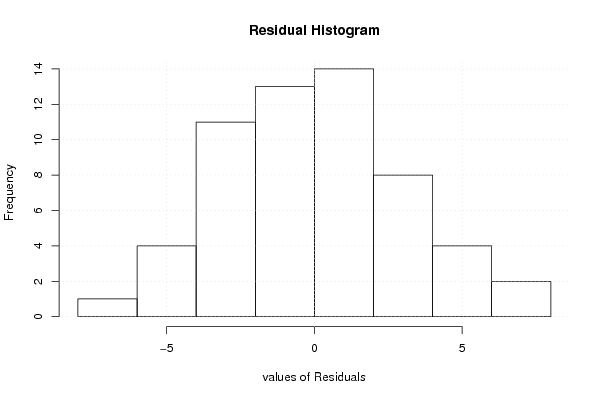
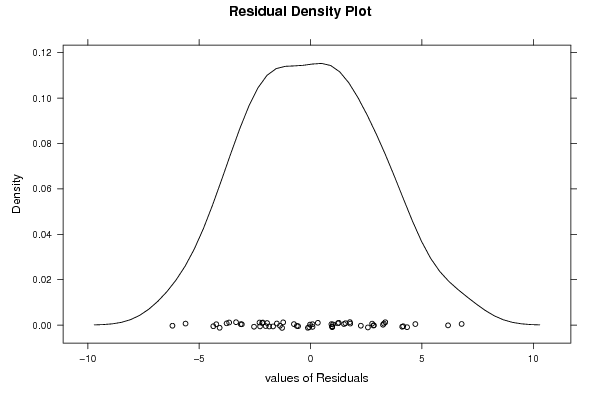
| Multiple Linear Regression - Residual Statistics | |
| Residual Standard Deviation | 3.49639337270593 |
| Sum Squared Residuals | 476.765898051377 |
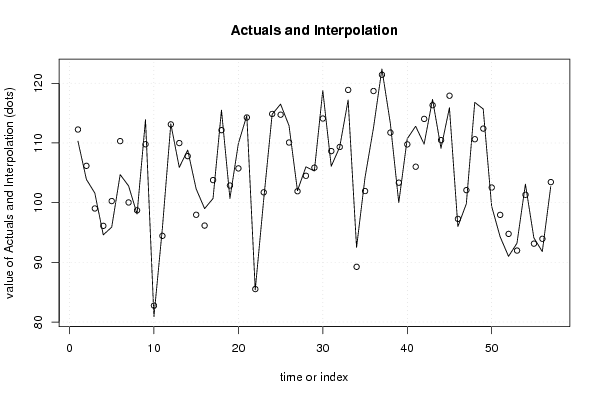
| Multiple Linear Regression - Actuals, Interpolation, and Residuals | |||
| Time or Index | Actuals | Interpolation Forecast | Residuals Prediction Error |
| 1 | 110.3 | 112.252054510448 | -1.95205451044806 |
| 2 | 103.9 | 106.167926613587 | -2.26792661358659 |
| 3 | 101.6 | 99.0248831971348 | 2.57511680286515 |
| 4 | 94.6 | 96.1129378365177 | -1.51293783651767 |
| 5 | 95.9 | 100.264926894534 | -4.36492689453374 |
| 6 | 104.7 | 110.311047246063 | -5.61104724606301 |
| 7 | 102.8 | 100.035017599986 | 2.7649824000144 |
| 8 | 98.1 | 98.714991084406 | -0.614991084405923 |
| 9 | 113.9 | 109.784365404339 | 4.11563459566102 |
| 10 | 80.9 | 82.753253680297 | -1.853253680297 |
| 11 | 95.7 | 94.4364781378625 | 1.26352186213746 |
| 12 | 113.2 | 113.112884679785 | 0.0871153202149736 |
| 13 | 105.9 | 109.981570750037 | -4.08157075003667 |
| 14 | 108.8 | 107.792542390679 | 1.00745760932087 |
| 15 | 102.3 | 97.9666202727048 | 4.33337972729524 |
| 16 | 99 | 96.1583020320791 | 2.84169796792085 |
| 17 | 100.7 | 103.785209752577 | -3.08520975257667 |
| 18 | 115.5 | 112.146228919302 | 3.35377108069795 |
| 19 | 100.7 | 102.872761982909 | -2.17276198290899 |
| 20 | 109.9 | 105.741289908142 | 4.15871009185848 |
| 21 | 114.6 | 114.272843802142 | 0.327156197858334 |
| 22 | 85.4 | 85.5192628940012 | -0.119262894001209 |
| 23 | 100.5 | 101.727992026091 | -1.22799202609066 |
| 24 | 114.8 | 114.860966452005 | -0.0609664520048876 |
| 25 | 116.5 | 114.733764442354 | 1.76623555764602 |
| 26 | 112.9 | 110.074612943529 | 2.82538705647099 |
| 27 | 102 | 101.910933579692 | 0.0890664203080536 |
| 28 | 106 | 104.498855962627 | 1.50114403737323 |
| 29 | 105.3 | 105.858919709715 | -0.558919709714725 |
| 30 | 118.8 | 114.094911462960 | 4.70508853703975 |
| 31 | 106.1 | 108.637274433892 | -2.53727443389214 |
| 32 | 109.3 | 109.325152778972 | -0.0251527789720770 |
| 33 | 117.2 | 118.883111898311 | -1.68311189831134 |
| 34 | 92.5 | 89.2495346177033 | 3.25046538229669 |
| 35 | 104.2 | 101.943296281823 | 2.25670371817728 |
| 36 | 112.5 | 118.699623670331 | -6.19962367033133 |
| 37 | 122.4 | 121.425841978890 | 0.97415802111033 |
| 38 | 113.3 | 111.731698347409 | 1.56830165259076 |
| 39 | 100 | 103.344799952820 | -3.34479995282032 |
| 40 | 110.7 | 109.762487156868 | 0.937512843131833 |
| 41 | 112.8 | 106.017758986406 | 6.78224101359374 |
| 42 | 109.8 | 114.029678337094 | -4.22967833709365 |
| 43 | 117.3 | 116.324365011363 | 0.975634988636562 |
| 44 | 109.1 | 110.473188871372 | -1.37318887137233 |
| 45 | 115.9 | 117.913649146018 | -2.01364914601842 |
| 46 | 96 | 97.2779488079985 | -1.27794880799848 |
| 47 | 99.8 | 102.092233554224 | -2.29223355422409 |
| 48 | 116.8 | 110.626525197879 | 6.17347480212124 |
| 49 | 115.7 | 112.406768318272 | 3.29323168172839 |
| 50 | 99.4 | 102.533219704796 | -3.13321970479604 |
| 51 | 94.3 | 97.9527629976481 | -3.65276299764814 |
| 52 | 91 | 94.7674170119082 | -3.76741701190823 |
| 53 | 93.2 | 91.9731846567686 | 1.22681534323140 |
| 54 | 103.1 | 101.318134034581 | 1.78186596541895 |
| 55 | 94.1 | 93.1305809718498 | 0.969419028150166 |
| 56 | 91.8 | 93.9453773571081 | -2.14537735710815 |
| 57 | 102.7 | 103.446029749190 | -0.746029749189583 |
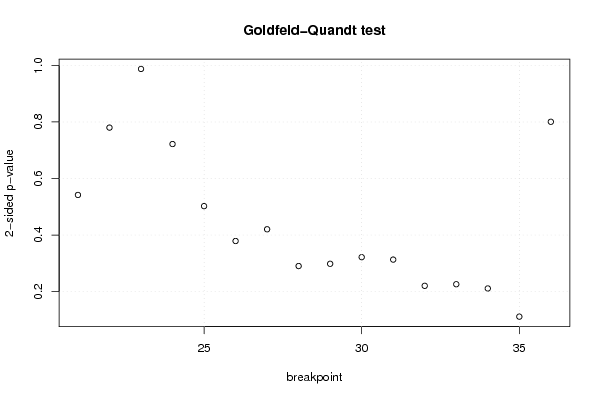
| Goldfeld-Quandt test for Heteroskedasticity | |||
| p-values | Alternative Hypothesis | ||
| breakpoint index | greater | 2-sided | less |
| 21 | 0.729110849558781 | 0.541778300882437 | 0.270889150441219 |
| 22 | 0.610023103158455 | 0.77995379368309 | 0.389976896841545 |
| 23 | 0.506269408139698 | 0.987461183720605 | 0.493730591860302 |
| 24 | 0.360919085599711 | 0.721838171199421 | 0.63908091440029 |
| 25 | 0.251155399477751 | 0.502310798955501 | 0.74884460052225 |
| 26 | 0.189462830120848 | 0.378925660241697 | 0.810537169879152 |
| 27 | 0.210222141834129 | 0.420444283668259 | 0.78977785816587 |
| 28 | 0.145181702966681 | 0.290363405933361 | 0.85481829703332 |
| 29 | 0.149184836200164 | 0.298369672400327 | 0.850815163799836 |
| 30 | 0.160905471659361 | 0.321810943318722 | 0.839094528340639 |
| 31 | 0.156597369257074 | 0.313194738514148 | 0.843402630742926 |
| 32 | 0.110233445838266 | 0.220466891676532 | 0.889766554161734 |
| 33 | 0.113041874342426 | 0.226083748684852 | 0.886958125657574 |
| 34 | 0.105586526540899 | 0.211173053081798 | 0.894413473459101 |
| 35 | 0.0557112159048024 | 0.111422431809605 | 0.944288784095198 |
| 36 | 0.59968594742987 | 0.80062810514026 | 0.40031405257013 |
| Meta Analysis of Goldfeld-Quandt test for Heteroskedasticity | |||
| Description | # significant tests | % significant tests | OK/NOK |
| 1% type I error level | 0 | 0 | OK |
| 5% type I error level | 0 | 0 | OK |
| 10% type I error level | 0 | 0 | OK |