Free Statistics

of Irreproducible Research!

Author's title

Author*The author of this computation has been verified*
R Software Modulerwasp_multipleregression.wasp
Title produced by softwareMultiple Regression
Date of computationFri, 20 Nov 2009 10:00:23 -0700
Cite this page as followsStatistical Computations at FreeStatistics.org, Office for Research Development and Education, URL https://freestatistics.org/blog/index.php?v=date/2009/Nov/20/t1258736644r6tv9k8webn8cy1.htm/, Retrieved Fri, 19 Apr 2024 23:47:34 +0000
Statistical Computations at FreeStatistics.org, Office for Research Development and Education, URL https://freestatistics.org/blog/index.php?pk=58332, Retrieved Fri, 19 Apr 2024 23:47:34 +0000
QR Codes:

Original text written by user:
IsPrivate?No (this computation is public)
User-defined keywords
Estimated Impact166
Family? (F = Feedback message, R = changed R code, M = changed R Module, P = changed Parameters, D = changed Data)
-     [Multiple Regression] [Q1 The Seatbeltlaw] [2007-11-14 19:27:43] [8cd6641b921d30ebe00b648d1481bba0]
- RMPD  [Multiple Regression] [Seatbelt] [2009-11-12 14:03:14] [b98453cac15ba1066b407e146608df68]
-   PD      [Multiple Regression] [WS7] [2009-11-20 17:00:23] [b8ce264f75295a954feffaf60221d1b0] [Current]
-    D        [Multiple Regression] [verbetering] [2009-11-27 09:55:38] [f5d341d4bbba73282fc6e80153a6d315]
-    D        [Multiple Regression] [Multiple Regressi...] [2009-12-18 17:57:07] [4d62210f0915d3a20cbf115865da7cd4]
Feedback Forum

Post a new message
Dataseries X:
363	14.3
364	14.2
363	15.9
358	15.3
357	15.5
357	15.1
380	15
378	12.1
376	15.8
380	16.9
379	15.1
384	13.7
392	14.8
394	14.7
392	16
396	15.4
392	15
396	15.5
419	15.1
421	11.7
420	16.3
418	16.7
410	15
418	14.9
426	14.6
428	15.3
430	17.9
424	16.4
423	15.4
427	17.9
441	15.9
449	13.9
452	17.8
462	17.9
455	17.4
461	16.7
461	16
463	16.6
462	19.1
456	17.8
455	17.2
456	18.6
472	16.3
472	15.1
471	19.2
465	17.7
459	19.1
465	18
468	17.5
467	17.8
463	21.1
460	17.2
462	19.4
461	19.8
476	17.6
476	16.2
471	19.5
453	19.9
443	20
442	17.3


Summary of computational transaction
Raw Inputview raw input (R code)
Raw Outputview raw output of R engine
Computing time6 seconds
R Server'Gwilym Jenkins' @ 72.249.127.135

\begin{tabular}{lllllllll}
\hline
Summary of computational transaction \tabularnewline
Raw Input & view raw input (R code)  \tabularnewline
Raw Output & view raw output of R engine  \tabularnewline
Computing time & 6 seconds \tabularnewline
R Server & 'Gwilym Jenkins' @ 72.249.127.135 \tabularnewline
\hline
\end{tabular}
%Source: https://freestatistics.org/blog/index.php?pk=58332&T=0

[TABLE]
[ROW][C]Summary of computational transaction[/C][/ROW]
[ROW][C]Raw Input[/C][C]view raw input (R code) [/C][/ROW]
[ROW][C]Raw Output[/C][C]view raw output of R engine [/C][/ROW]
[ROW][C]Computing time[/C][C]6 seconds[/C][/ROW]
[ROW][C]R Server[/C][C]'Gwilym Jenkins' @ 72.249.127.135[/C][/ROW]
[/TABLE]
Source: https://freestatistics.org/blog/index.php?pk=58332&T=0

Globally Unique Identifier (entire table): ba.freestatistics.org/blog/index.php?pk=58332&T=0

As an alternative you can also use a QR Code:  

The GUIDs for individual cells are displayed in the table below:

Summary of computational transaction
Raw Inputview raw input (R code)
Raw Outputview raw output of R engine
Computing time6 seconds
R Server'Gwilym Jenkins' @ 72.249.127.135


Multiple Linear Regression - Estimated Regression Equation
WK>25j[t] = + 390.495158429888 -2.19378103570580ExpBE[t] + 10.6069652991252M1[t] + 10.2304297706313M2[t] + 11.8414563135492M3[t] + 2.98448805864265M4[t] -0.0308036769922362M5[t] + 1.30892941593749M6[t] + 14.246841747458M7[t] + 8.873604871128M8[t] + 14.0824323126034M9[t] + 9.7110161976826M10[t] + 0.0233314613383325M11[t] + 2.19079421849136t + e[t]

\begin{tabular}{lllllllll}
\hline
Multiple Linear Regression - Estimated Regression Equation \tabularnewline
WK>25j[t] =  +  390.495158429888 -2.19378103570580ExpBE[t] +  10.6069652991252M1[t] +  10.2304297706313M2[t] +  11.8414563135492M3[t] +  2.98448805864265M4[t] -0.0308036769922362M5[t] +  1.30892941593749M6[t] +  14.246841747458M7[t] +  8.873604871128M8[t] +  14.0824323126034M9[t] +  9.7110161976826M10[t] +  0.0233314613383325M11[t] +  2.19079421849136t  + e[t] \tabularnewline
\hline
\end{tabular}
%Source: https://freestatistics.org/blog/index.php?pk=58332&T=1

[TABLE]
[ROW][C]Multiple Linear Regression - Estimated Regression Equation[/C][/ROW]
[ROW][C]WK>25j[t] =  +  390.495158429888 -2.19378103570580ExpBE[t] +  10.6069652991252M1[t] +  10.2304297706313M2[t] +  11.8414563135492M3[t] +  2.98448805864265M4[t] -0.0308036769922362M5[t] +  1.30892941593749M6[t] +  14.246841747458M7[t] +  8.873604871128M8[t] +  14.0824323126034M9[t] +  9.7110161976826M10[t] +  0.0233314613383325M11[t] +  2.19079421849136t  + e[t][/C][/ROW]
[/TABLE]
Source: https://freestatistics.org/blog/index.php?pk=58332&T=1

Globally Unique Identifier (entire table): ba.freestatistics.org/blog/index.php?pk=58332&T=1

As an alternative you can also use a QR Code:  

The GUIDs for individual cells are displayed in the table below:

Multiple Linear Regression - Estimated Regression Equation
WK>25j[t] = + 390.495158429888 -2.19378103570580ExpBE[t] + 10.6069652991252M1[t] + 10.2304297706313M2[t] + 11.8414563135492M3[t] + 2.98448805864265M4[t] -0.0308036769922362M5[t] + 1.30892941593749M6[t] + 14.246841747458M7[t] + 8.873604871128M8[t] + 14.0824323126034M9[t] + 9.7110161976826M10[t] + 0.0233314613383325M11[t] + 2.19079421849136t + e[t]


Multiple Linear Regression - Ordinary Least Squares
VariableParameterS.D.T-STATH0: parameter = 02-tail p-value1-tail p-value
(Intercept)390.49515842988841.9935219.298900
ExpBE-2.193781035705803.135346-0.69970.4876420.243821
M110.60696529912529.5255581.11350.2712670.135634
M210.23042977063139.5772691.06820.2910050.145502
M311.841456313549212.5382440.94440.3498860.174943
M42.984488058642659.9261010.30070.765020.38251
M5-0.03080367699223629.914293-0.00310.9975340.498767
M61.3089294159374910.9256940.11980.9051610.452581
M714.2468417474589.4726881.5040.1394190.06971
M88.87360487112811.3078120.78470.4366330.218317
M914.082432312603411.060171.27330.2093240.104662
M109.711016197682611.0865580.87590.3856210.19281
M110.023331461338332510.2402840.00230.9981920.499096
t2.190794218491360.2815847.780300

\begin{tabular}{lllllllll}
\hline
Multiple Linear Regression - Ordinary Least Squares \tabularnewline
Variable & Parameter & S.D. & T-STATH0: parameter = 0 & 2-tail p-value & 1-tail p-value \tabularnewline
(Intercept) & 390.495158429888 & 41.993521 & 9.2989 & 0 & 0 \tabularnewline
ExpBE & -2.19378103570580 & 3.135346 & -0.6997 & 0.487642 & 0.243821 \tabularnewline
M1 & 10.6069652991252 & 9.525558 & 1.1135 & 0.271267 & 0.135634 \tabularnewline
M2 & 10.2304297706313 & 9.577269 & 1.0682 & 0.291005 & 0.145502 \tabularnewline
M3 & 11.8414563135492 & 12.538244 & 0.9444 & 0.349886 & 0.174943 \tabularnewline
M4 & 2.98448805864265 & 9.926101 & 0.3007 & 0.76502 & 0.38251 \tabularnewline
M5 & -0.0308036769922362 & 9.914293 & -0.0031 & 0.997534 & 0.498767 \tabularnewline
M6 & 1.30892941593749 & 10.925694 & 0.1198 & 0.905161 & 0.452581 \tabularnewline
M7 & 14.246841747458 & 9.472688 & 1.504 & 0.139419 & 0.06971 \tabularnewline
M8 & 8.873604871128 & 11.307812 & 0.7847 & 0.436633 & 0.218317 \tabularnewline
M9 & 14.0824323126034 & 11.06017 & 1.2733 & 0.209324 & 0.104662 \tabularnewline
M10 & 9.7110161976826 & 11.086558 & 0.8759 & 0.385621 & 0.19281 \tabularnewline
M11 & 0.0233314613383325 & 10.240284 & 0.0023 & 0.998192 & 0.499096 \tabularnewline
t & 2.19079421849136 & 0.281584 & 7.7803 & 0 & 0 \tabularnewline
\hline
\end{tabular}
%Source: https://freestatistics.org/blog/index.php?pk=58332&T=2

[TABLE]
[ROW][C]Multiple Linear Regression - Ordinary Least Squares[/C][/ROW]
[ROW][C]Variable[/C][C]Parameter[/C][C]S.D.[/C][C]T-STATH0: parameter = 0[/C][C]2-tail p-value[/C][C]1-tail p-value[/C][/ROW]
[ROW][C](Intercept)[/C][C]390.495158429888[/C][C]41.993521[/C][C]9.2989[/C][C]0[/C][C]0[/C][/ROW]
[ROW][C]ExpBE[/C][C]-2.19378103570580[/C][C]3.135346[/C][C]-0.6997[/C][C]0.487642[/C][C]0.243821[/C][/ROW]
[ROW][C]M1[/C][C]10.6069652991252[/C][C]9.525558[/C][C]1.1135[/C][C]0.271267[/C][C]0.135634[/C][/ROW]
[ROW][C]M2[/C][C]10.2304297706313[/C][C]9.577269[/C][C]1.0682[/C][C]0.291005[/C][C]0.145502[/C][/ROW]
[ROW][C]M3[/C][C]11.8414563135492[/C][C]12.538244[/C][C]0.9444[/C][C]0.349886[/C][C]0.174943[/C][/ROW]
[ROW][C]M4[/C][C]2.98448805864265[/C][C]9.926101[/C][C]0.3007[/C][C]0.76502[/C][C]0.38251[/C][/ROW]
[ROW][C]M5[/C][C]-0.0308036769922362[/C][C]9.914293[/C][C]-0.0031[/C][C]0.997534[/C][C]0.498767[/C][/ROW]
[ROW][C]M6[/C][C]1.30892941593749[/C][C]10.925694[/C][C]0.1198[/C][C]0.905161[/C][C]0.452581[/C][/ROW]
[ROW][C]M7[/C][C]14.246841747458[/C][C]9.472688[/C][C]1.504[/C][C]0.139419[/C][C]0.06971[/C][/ROW]
[ROW][C]M8[/C][C]8.873604871128[/C][C]11.307812[/C][C]0.7847[/C][C]0.436633[/C][C]0.218317[/C][/ROW]
[ROW][C]M9[/C][C]14.0824323126034[/C][C]11.06017[/C][C]1.2733[/C][C]0.209324[/C][C]0.104662[/C][/ROW]
[ROW][C]M10[/C][C]9.7110161976826[/C][C]11.086558[/C][C]0.8759[/C][C]0.385621[/C][C]0.19281[/C][/ROW]
[ROW][C]M11[/C][C]0.0233314613383325[/C][C]10.240284[/C][C]0.0023[/C][C]0.998192[/C][C]0.499096[/C][/ROW]
[ROW][C]t[/C][C]2.19079421849136[/C][C]0.281584[/C][C]7.7803[/C][C]0[/C][C]0[/C][/ROW]
[/TABLE]
Source: https://freestatistics.org/blog/index.php?pk=58332&T=2

Globally Unique Identifier (entire table): ba.freestatistics.org/blog/index.php?pk=58332&T=2

As an alternative you can also use a QR Code:  

The GUIDs for individual cells are displayed in the table below:

Multiple Linear Regression - Ordinary Least Squares
VariableParameterS.D.T-STATH0: parameter = 02-tail p-value1-tail p-value
(Intercept)390.49515842988841.9935219.298900
ExpBE-2.193781035705803.135346-0.69970.4876420.243821
M110.60696529912529.5255581.11350.2712670.135634
M210.23042977063139.5772691.06820.2910050.145502
M311.841456313549212.5382440.94440.3498860.174943
M42.984488058642659.9261010.30070.765020.38251
M5-0.03080367699223629.914293-0.00310.9975340.498767
M61.3089294159374910.9256940.11980.9051610.452581
M714.2468417474589.4726881.5040.1394190.06971
M88.87360487112811.3078120.78470.4366330.218317
M914.082432312603411.060171.27330.2093240.104662
M109.711016197682611.0865580.87590.3856210.19281
M110.023331461338332510.2402840.00230.9981920.499096
t2.190794218491360.2815847.780300


Multiple Linear Regression - Regression Statistics
Multiple R0.937327976220717
R-squared0.878583735006024
Adjusted R-squared0.844270442725118
F-TEST (value)25.604763536343
F-TEST (DF numerator)13
F-TEST (DF denominator)46
p-value1.11022302462516e-16
Multiple Linear Regression - Residual Statistics
Residual Standard Deviation14.8903066765169
Sum Squared Residuals10199.1767143533

\begin{tabular}{lllllllll}
\hline
Multiple Linear Regression - Regression Statistics \tabularnewline
Multiple R & 0.937327976220717 \tabularnewline
R-squared & 0.878583735006024 \tabularnewline
Adjusted R-squared & 0.844270442725118 \tabularnewline
F-TEST (value) & 25.604763536343 \tabularnewline
F-TEST (DF numerator) & 13 \tabularnewline
F-TEST (DF denominator) & 46 \tabularnewline
p-value & 1.11022302462516e-16 \tabularnewline
Multiple Linear Regression - Residual Statistics \tabularnewline
Residual Standard Deviation & 14.8903066765169 \tabularnewline
Sum Squared Residuals & 10199.1767143533 \tabularnewline
\hline
\end{tabular}
%Source: https://freestatistics.org/blog/index.php?pk=58332&T=3

[TABLE]
[ROW][C]Multiple Linear Regression - Regression Statistics[/C][/ROW]
[ROW][C]Multiple R[/C][C]0.937327976220717[/C][/ROW]
[ROW][C]R-squared[/C][C]0.878583735006024[/C][/ROW]
[ROW][C]Adjusted R-squared[/C][C]0.844270442725118[/C][/ROW]
[ROW][C]F-TEST (value)[/C][C]25.604763536343[/C][/ROW]
[ROW][C]F-TEST (DF numerator)[/C][C]13[/C][/ROW]
[ROW][C]F-TEST (DF denominator)[/C][C]46[/C][/ROW]
[ROW][C]p-value[/C][C]1.11022302462516e-16[/C][/ROW]
[ROW][C]Multiple Linear Regression - Residual Statistics[/C][/ROW]
[ROW][C]Residual Standard Deviation[/C][C]14.8903066765169[/C][/ROW]
[ROW][C]Sum Squared Residuals[/C][C]10199.1767143533[/C][/ROW]
[/TABLE]
Source: https://freestatistics.org/blog/index.php?pk=58332&T=3

Globally Unique Identifier (entire table): ba.freestatistics.org/blog/index.php?pk=58332&T=3

As an alternative you can also use a QR Code:  

The GUIDs for individual cells are displayed in the table below:

Multiple Linear Regression - Regression Statistics
Multiple R0.937327976220717
R-squared0.878583735006024
Adjusted R-squared0.844270442725118
F-TEST (value)25.604763536343
F-TEST (DF numerator)13
F-TEST (DF denominator)46
p-value1.11022302462516e-16
Multiple Linear Regression - Residual Statistics
Residual Standard Deviation14.8903066765169
Sum Squared Residuals10199.1767143533


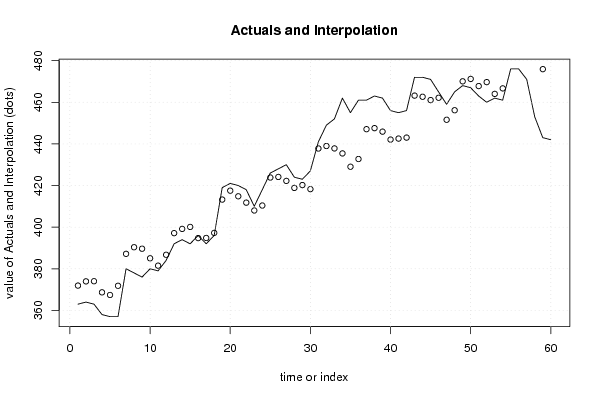
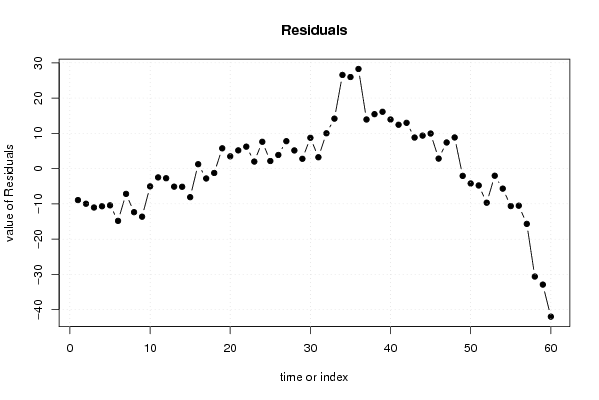
Multiple Linear Regression - Actuals, Interpolation, and Residuals
Time or IndexActualsInterpolationForecastResidualsPrediction Error
1363371.921849136911-8.92184913691128
2364373.95548593048-9.95548593048008
3363374.027878931189-11.0278789311894
4358368.677973516198-10.6779735161977
5357367.414719791913-10.4147197919130
6357371.822759517616-14.8227595176165
7380387.170844171199-7.17084417119895
8378390.350366516907-12.3503665169071
9376389.632998344762-13.6329983447624
10380385.039217309057-5.03921730905656
11379381.491132655474-2.49113265547411
12384386.729888862615-2.72988886261529
13392397.114489240955-5.11448924095547
14394399.148126034524-5.14812603452353
15392400.098031449515-8.09803144951522
16396394.7481260345241.25187396547647
17392394.801140931662-2.80114093166232
18396397.234777725231-1.23477772523054
19419413.2409966895255.75900331047528
20421417.5174095530863.4825904469142
21420414.8256384488065.17436155119415
22418411.7675041380946.23249586190588
23410408.0000413809411.99995861905893
24418410.3868822416657.6131177583353
25426423.8427760699932.15722393000698
26428424.1213880349963.87861196500358
27430422.2193781035717.7806218964294
28424418.8438756207145.15612437928589
29423420.2131591392762.78684086072363
30427418.2592338614338.74076613856701
31441437.7755024828563.22449751714354
32449438.98062189642910.0193781035706
33452437.82449751714414.1755024828565
34462435.42449751714426.5755024828565
35455429.02449751714425.9755024828565
36461432.72760699929128.2723930007094
37461447.06101324190113.9389867580987
38463447.55900331047515.4409966895247
39462445.8763714826216.12362851738
40456442.06211279262213.9378872073776
41455442.55388389690212.4461161030977
42456443.01311775833512.9868822416647
43472463.1875206904718.8124793095295
44472462.6376152754799.36238472452115
45471461.0427346890529.9572653109482
46465462.1527843461812.84721565381893
47459451.584600378347.41539962165995
48465456.1652222747698.83477772523053
49468470.059872310239-2.05987231023896
50467471.215996689525-4.21599668952469
51463467.778340033105-4.77834003310478
52460469.667912035942-9.66791203594225
53462464.017096240246-2.01709624024594
54461466.670111137385-5.67011113738472
55476486.625135965949-10.6251359659494
56476486.513986758099-10.5139867580988
57471486.674131000236-15.6741310002364
58453483.615996689525-30.6159966895247
59443475.899728068101-32.8997280681012
60442483.99039962166-41.9903996216599

\begin{tabular}{lllllllll}
\hline
Multiple Linear Regression - Actuals, Interpolation, and Residuals \tabularnewline
Time or Index & Actuals & InterpolationForecast & ResidualsPrediction Error \tabularnewline
1 & 363 & 371.921849136911 & -8.92184913691128 \tabularnewline
2 & 364 & 373.95548593048 & -9.95548593048008 \tabularnewline
3 & 363 & 374.027878931189 & -11.0278789311894 \tabularnewline
4 & 358 & 368.677973516198 & -10.6779735161977 \tabularnewline
5 & 357 & 367.414719791913 & -10.4147197919130 \tabularnewline
6 & 357 & 371.822759517616 & -14.8227595176165 \tabularnewline
7 & 380 & 387.170844171199 & -7.17084417119895 \tabularnewline
8 & 378 & 390.350366516907 & -12.3503665169071 \tabularnewline
9 & 376 & 389.632998344762 & -13.6329983447624 \tabularnewline
10 & 380 & 385.039217309057 & -5.03921730905656 \tabularnewline
11 & 379 & 381.491132655474 & -2.49113265547411 \tabularnewline
12 & 384 & 386.729888862615 & -2.72988886261529 \tabularnewline
13 & 392 & 397.114489240955 & -5.11448924095547 \tabularnewline
14 & 394 & 399.148126034524 & -5.14812603452353 \tabularnewline
15 & 392 & 400.098031449515 & -8.09803144951522 \tabularnewline
16 & 396 & 394.748126034524 & 1.25187396547647 \tabularnewline
17 & 392 & 394.801140931662 & -2.80114093166232 \tabularnewline
18 & 396 & 397.234777725231 & -1.23477772523054 \tabularnewline
19 & 419 & 413.240996689525 & 5.75900331047528 \tabularnewline
20 & 421 & 417.517409553086 & 3.4825904469142 \tabularnewline
21 & 420 & 414.825638448806 & 5.17436155119415 \tabularnewline
22 & 418 & 411.767504138094 & 6.23249586190588 \tabularnewline
23 & 410 & 408.000041380941 & 1.99995861905893 \tabularnewline
24 & 418 & 410.386882241665 & 7.6131177583353 \tabularnewline
25 & 426 & 423.842776069993 & 2.15722393000698 \tabularnewline
26 & 428 & 424.121388034996 & 3.87861196500358 \tabularnewline
27 & 430 & 422.219378103571 & 7.7806218964294 \tabularnewline
28 & 424 & 418.843875620714 & 5.15612437928589 \tabularnewline
29 & 423 & 420.213159139276 & 2.78684086072363 \tabularnewline
30 & 427 & 418.259233861433 & 8.74076613856701 \tabularnewline
31 & 441 & 437.775502482856 & 3.22449751714354 \tabularnewline
32 & 449 & 438.980621896429 & 10.0193781035706 \tabularnewline
33 & 452 & 437.824497517144 & 14.1755024828565 \tabularnewline
34 & 462 & 435.424497517144 & 26.5755024828565 \tabularnewline
35 & 455 & 429.024497517144 & 25.9755024828565 \tabularnewline
36 & 461 & 432.727606999291 & 28.2723930007094 \tabularnewline
37 & 461 & 447.061013241901 & 13.9389867580987 \tabularnewline
38 & 463 & 447.559003310475 & 15.4409966895247 \tabularnewline
39 & 462 & 445.87637148262 & 16.12362851738 \tabularnewline
40 & 456 & 442.062112792622 & 13.9378872073776 \tabularnewline
41 & 455 & 442.553883896902 & 12.4461161030977 \tabularnewline
42 & 456 & 443.013117758335 & 12.9868822416647 \tabularnewline
43 & 472 & 463.187520690471 & 8.8124793095295 \tabularnewline
44 & 472 & 462.637615275479 & 9.36238472452115 \tabularnewline
45 & 471 & 461.042734689052 & 9.9572653109482 \tabularnewline
46 & 465 & 462.152784346181 & 2.84721565381893 \tabularnewline
47 & 459 & 451.58460037834 & 7.41539962165995 \tabularnewline
48 & 465 & 456.165222274769 & 8.83477772523053 \tabularnewline
49 & 468 & 470.059872310239 & -2.05987231023896 \tabularnewline
50 & 467 & 471.215996689525 & -4.21599668952469 \tabularnewline
51 & 463 & 467.778340033105 & -4.77834003310478 \tabularnewline
52 & 460 & 469.667912035942 & -9.66791203594225 \tabularnewline
53 & 462 & 464.017096240246 & -2.01709624024594 \tabularnewline
54 & 461 & 466.670111137385 & -5.67011113738472 \tabularnewline
55 & 476 & 486.625135965949 & -10.6251359659494 \tabularnewline
56 & 476 & 486.513986758099 & -10.5139867580988 \tabularnewline
57 & 471 & 486.674131000236 & -15.6741310002364 \tabularnewline
58 & 453 & 483.615996689525 & -30.6159966895247 \tabularnewline
59 & 443 & 475.899728068101 & -32.8997280681012 \tabularnewline
60 & 442 & 483.99039962166 & -41.9903996216599 \tabularnewline
\hline
\end{tabular}
%Source: https://freestatistics.org/blog/index.php?pk=58332&T=4

[TABLE]
[ROW][C]Multiple Linear Regression - Actuals, Interpolation, and Residuals[/C][/ROW]
[ROW][C]Time or Index[/C][C]Actuals[/C][C]InterpolationForecast[/C][C]ResidualsPrediction Error[/C][/ROW]
[ROW][C]1[/C][C]363[/C][C]371.921849136911[/C][C]-8.92184913691128[/C][/ROW]
[ROW][C]2[/C][C]364[/C][C]373.95548593048[/C][C]-9.95548593048008[/C][/ROW]
[ROW][C]3[/C][C]363[/C][C]374.027878931189[/C][C]-11.0278789311894[/C][/ROW]
[ROW][C]4[/C][C]358[/C][C]368.677973516198[/C][C]-10.6779735161977[/C][/ROW]
[ROW][C]5[/C][C]357[/C][C]367.414719791913[/C][C]-10.4147197919130[/C][/ROW]
[ROW][C]6[/C][C]357[/C][C]371.822759517616[/C][C]-14.8227595176165[/C][/ROW]
[ROW][C]7[/C][C]380[/C][C]387.170844171199[/C][C]-7.17084417119895[/C][/ROW]
[ROW][C]8[/C][C]378[/C][C]390.350366516907[/C][C]-12.3503665169071[/C][/ROW]
[ROW][C]9[/C][C]376[/C][C]389.632998344762[/C][C]-13.6329983447624[/C][/ROW]
[ROW][C]10[/C][C]380[/C][C]385.039217309057[/C][C]-5.03921730905656[/C][/ROW]
[ROW][C]11[/C][C]379[/C][C]381.491132655474[/C][C]-2.49113265547411[/C][/ROW]
[ROW][C]12[/C][C]384[/C][C]386.729888862615[/C][C]-2.72988886261529[/C][/ROW]
[ROW][C]13[/C][C]392[/C][C]397.114489240955[/C][C]-5.11448924095547[/C][/ROW]
[ROW][C]14[/C][C]394[/C][C]399.148126034524[/C][C]-5.14812603452353[/C][/ROW]
[ROW][C]15[/C][C]392[/C][C]400.098031449515[/C][C]-8.09803144951522[/C][/ROW]
[ROW][C]16[/C][C]396[/C][C]394.748126034524[/C][C]1.25187396547647[/C][/ROW]
[ROW][C]17[/C][C]392[/C][C]394.801140931662[/C][C]-2.80114093166232[/C][/ROW]
[ROW][C]18[/C][C]396[/C][C]397.234777725231[/C][C]-1.23477772523054[/C][/ROW]
[ROW][C]19[/C][C]419[/C][C]413.240996689525[/C][C]5.75900331047528[/C][/ROW]
[ROW][C]20[/C][C]421[/C][C]417.517409553086[/C][C]3.4825904469142[/C][/ROW]
[ROW][C]21[/C][C]420[/C][C]414.825638448806[/C][C]5.17436155119415[/C][/ROW]
[ROW][C]22[/C][C]418[/C][C]411.767504138094[/C][C]6.23249586190588[/C][/ROW]
[ROW][C]23[/C][C]410[/C][C]408.000041380941[/C][C]1.99995861905893[/C][/ROW]
[ROW][C]24[/C][C]418[/C][C]410.386882241665[/C][C]7.6131177583353[/C][/ROW]
[ROW][C]25[/C][C]426[/C][C]423.842776069993[/C][C]2.15722393000698[/C][/ROW]
[ROW][C]26[/C][C]428[/C][C]424.121388034996[/C][C]3.87861196500358[/C][/ROW]
[ROW][C]27[/C][C]430[/C][C]422.219378103571[/C][C]7.7806218964294[/C][/ROW]
[ROW][C]28[/C][C]424[/C][C]418.843875620714[/C][C]5.15612437928589[/C][/ROW]
[ROW][C]29[/C][C]423[/C][C]420.213159139276[/C][C]2.78684086072363[/C][/ROW]
[ROW][C]30[/C][C]427[/C][C]418.259233861433[/C][C]8.74076613856701[/C][/ROW]
[ROW][C]31[/C][C]441[/C][C]437.775502482856[/C][C]3.22449751714354[/C][/ROW]
[ROW][C]32[/C][C]449[/C][C]438.980621896429[/C][C]10.0193781035706[/C][/ROW]
[ROW][C]33[/C][C]452[/C][C]437.824497517144[/C][C]14.1755024828565[/C][/ROW]
[ROW][C]34[/C][C]462[/C][C]435.424497517144[/C][C]26.5755024828565[/C][/ROW]
[ROW][C]35[/C][C]455[/C][C]429.024497517144[/C][C]25.9755024828565[/C][/ROW]
[ROW][C]36[/C][C]461[/C][C]432.727606999291[/C][C]28.2723930007094[/C][/ROW]
[ROW][C]37[/C][C]461[/C][C]447.061013241901[/C][C]13.9389867580987[/C][/ROW]
[ROW][C]38[/C][C]463[/C][C]447.559003310475[/C][C]15.4409966895247[/C][/ROW]
[ROW][C]39[/C][C]462[/C][C]445.87637148262[/C][C]16.12362851738[/C][/ROW]
[ROW][C]40[/C][C]456[/C][C]442.062112792622[/C][C]13.9378872073776[/C][/ROW]
[ROW][C]41[/C][C]455[/C][C]442.553883896902[/C][C]12.4461161030977[/C][/ROW]
[ROW][C]42[/C][C]456[/C][C]443.013117758335[/C][C]12.9868822416647[/C][/ROW]
[ROW][C]43[/C][C]472[/C][C]463.187520690471[/C][C]8.8124793095295[/C][/ROW]
[ROW][C]44[/C][C]472[/C][C]462.637615275479[/C][C]9.36238472452115[/C][/ROW]
[ROW][C]45[/C][C]471[/C][C]461.042734689052[/C][C]9.9572653109482[/C][/ROW]
[ROW][C]46[/C][C]465[/C][C]462.152784346181[/C][C]2.84721565381893[/C][/ROW]
[ROW][C]47[/C][C]459[/C][C]451.58460037834[/C][C]7.41539962165995[/C][/ROW]
[ROW][C]48[/C][C]465[/C][C]456.165222274769[/C][C]8.83477772523053[/C][/ROW]
[ROW][C]49[/C][C]468[/C][C]470.059872310239[/C][C]-2.05987231023896[/C][/ROW]
[ROW][C]50[/C][C]467[/C][C]471.215996689525[/C][C]-4.21599668952469[/C][/ROW]
[ROW][C]51[/C][C]463[/C][C]467.778340033105[/C][C]-4.77834003310478[/C][/ROW]
[ROW][C]52[/C][C]460[/C][C]469.667912035942[/C][C]-9.66791203594225[/C][/ROW]
[ROW][C]53[/C][C]462[/C][C]464.017096240246[/C][C]-2.01709624024594[/C][/ROW]
[ROW][C]54[/C][C]461[/C][C]466.670111137385[/C][C]-5.67011113738472[/C][/ROW]
[ROW][C]55[/C][C]476[/C][C]486.625135965949[/C][C]-10.6251359659494[/C][/ROW]
[ROW][C]56[/C][C]476[/C][C]486.513986758099[/C][C]-10.5139867580988[/C][/ROW]
[ROW][C]57[/C][C]471[/C][C]486.674131000236[/C][C]-15.6741310002364[/C][/ROW]
[ROW][C]58[/C][C]453[/C][C]483.615996689525[/C][C]-30.6159966895247[/C][/ROW]
[ROW][C]59[/C][C]443[/C][C]475.899728068101[/C][C]-32.8997280681012[/C][/ROW]
[ROW][C]60[/C][C]442[/C][C]483.99039962166[/C][C]-41.9903996216599[/C][/ROW]
[/TABLE]
Source: https://freestatistics.org/blog/index.php?pk=58332&T=4

Globally Unique Identifier (entire table): ba.freestatistics.org/blog/index.php?pk=58332&T=4

As an alternative you can also use a QR Code:  

The GUIDs for individual cells are displayed in the table below:

Multiple Linear Regression - Actuals, Interpolation, and Residuals
Time or IndexActualsInterpolationForecastResidualsPrediction Error
1363371.921849136911-8.92184913691128
2364373.95548593048-9.95548593048008
3363374.027878931189-11.0278789311894
4358368.677973516198-10.6779735161977
5357367.414719791913-10.4147197919130
6357371.822759517616-14.8227595176165
7380387.170844171199-7.17084417119895
8378390.350366516907-12.3503665169071
9376389.632998344762-13.6329983447624
10380385.039217309057-5.03921730905656
11379381.491132655474-2.49113265547411
12384386.729888862615-2.72988886261529
13392397.114489240955-5.11448924095547
14394399.148126034524-5.14812603452353
15392400.098031449515-8.09803144951522
16396394.7481260345241.25187396547647
17392394.801140931662-2.80114093166232
18396397.234777725231-1.23477772523054
19419413.2409966895255.75900331047528
20421417.5174095530863.4825904469142
21420414.8256384488065.17436155119415
22418411.7675041380946.23249586190588
23410408.0000413809411.99995861905893
24418410.3868822416657.6131177583353
25426423.8427760699932.15722393000698
26428424.1213880349963.87861196500358
27430422.2193781035717.7806218964294
28424418.8438756207145.15612437928589
29423420.2131591392762.78684086072363
30427418.2592338614338.74076613856701
31441437.7755024828563.22449751714354
32449438.98062189642910.0193781035706
33452437.82449751714414.1755024828565
34462435.42449751714426.5755024828565
35455429.02449751714425.9755024828565
36461432.72760699929128.2723930007094
37461447.06101324190113.9389867580987
38463447.55900331047515.4409966895247
39462445.8763714826216.12362851738
40456442.06211279262213.9378872073776
41455442.55388389690212.4461161030977
42456443.01311775833512.9868822416647
43472463.1875206904718.8124793095295
44472462.6376152754799.36238472452115
45471461.0427346890529.9572653109482
46465462.1527843461812.84721565381893
47459451.584600378347.41539962165995
48465456.1652222747698.83477772523053
49468470.059872310239-2.05987231023896
50467471.215996689525-4.21599668952469
51463467.778340033105-4.77834003310478
52460469.667912035942-9.66791203594225
53462464.017096240246-2.01709624024594
54461466.670111137385-5.67011113738472
55476486.625135965949-10.6251359659494
56476486.513986758099-10.5139867580988
57471486.674131000236-15.6741310002364
58453483.615996689525-30.6159966895247
59443475.899728068101-32.8997280681012
60442483.99039962166-41.9903996216599


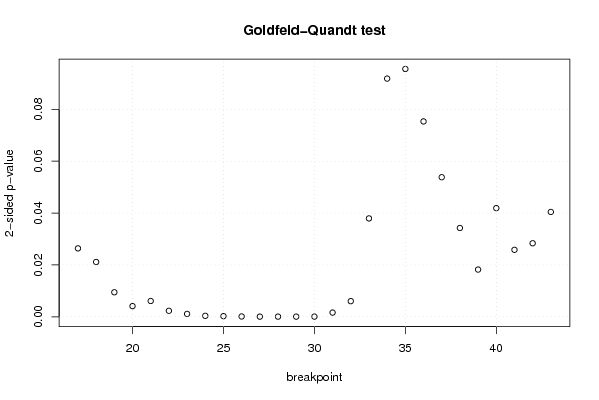
Goldfeld-Quandt test for Heteroskedasticity
p-valuesAlternative Hypothesis
breakpoint indexgreater2-sidedless
170.01318510262980010.02637020525960020.9868148973702
180.01056257556569150.02112515113138310.989437424434308
190.004722780051688320.009445560103376640.995277219948312
200.002048354812701200.004096709625402410.997951645187299
210.003042320771984550.00608464154396910.996957679228015
220.001155143681993350.002310287363986710.998844856318007
230.0005495414425328970.001099082885065790.999450458557467
240.0001821229773598630.0003642459547197250.99981787702264
250.0001175800081121250.000235160016224250.999882419991888
265.74731260398207e-050.0001149462520796410.99994252687396
272.64589758728815e-055.2917951745763e-050.999973541024127
282.75281750802481e-055.50563501604961e-050.99997247182492
292.26462357928356e-054.52924715856713e-050.999977353764207
302.85361502470566e-055.70723004941132e-050.999971463849753
310.0008084164456358740.001616832891271750.999191583554364
320.003008594170200580.006017188340401160.9969914058298
330.0189600424686340.0379200849372680.981039957531366
340.04591131284600170.09182262569200340.954088687153998
350.04777238255631650.0955447651126330.952227617443683
360.03765732620294240.07531465240588480.962342673797058
370.02689852810948060.05379705621896120.97310147189052
380.01711555984160640.03423111968321270.982884440158394
390.009099063069474080.01819812613894820.990900936930526
400.02094169556851610.04188339113703230.979058304431484
410.01290610392447130.02581220784894260.987093896075529
420.01416865494653060.02833730989306110.98583134505347
430.02020786470785710.04041572941571420.979792135292143

\begin{tabular}{lllllllll}
\hline
Goldfeld-Quandt test for Heteroskedasticity \tabularnewline
p-values & Alternative Hypothesis \tabularnewline
breakpoint index & greater & 2-sided & less \tabularnewline
17 & 0.0131851026298001 & 0.0263702052596002 & 0.9868148973702 \tabularnewline
18 & 0.0105625755656915 & 0.0211251511313831 & 0.989437424434308 \tabularnewline
19 & 0.00472278005168832 & 0.00944556010337664 & 0.995277219948312 \tabularnewline
20 & 0.00204835481270120 & 0.00409670962540241 & 0.997951645187299 \tabularnewline
21 & 0.00304232077198455 & 0.0060846415439691 & 0.996957679228015 \tabularnewline
22 & 0.00115514368199335 & 0.00231028736398671 & 0.998844856318007 \tabularnewline
23 & 0.000549541442532897 & 0.00109908288506579 & 0.999450458557467 \tabularnewline
24 & 0.000182122977359863 & 0.000364245954719725 & 0.99981787702264 \tabularnewline
25 & 0.000117580008112125 & 0.00023516001622425 & 0.999882419991888 \tabularnewline
26 & 5.74731260398207e-05 & 0.000114946252079641 & 0.99994252687396 \tabularnewline
27 & 2.64589758728815e-05 & 5.2917951745763e-05 & 0.999973541024127 \tabularnewline
28 & 2.75281750802481e-05 & 5.50563501604961e-05 & 0.99997247182492 \tabularnewline
29 & 2.26462357928356e-05 & 4.52924715856713e-05 & 0.999977353764207 \tabularnewline
30 & 2.85361502470566e-05 & 5.70723004941132e-05 & 0.999971463849753 \tabularnewline
31 & 0.000808416445635874 & 0.00161683289127175 & 0.999191583554364 \tabularnewline
32 & 0.00300859417020058 & 0.00601718834040116 & 0.9969914058298 \tabularnewline
33 & 0.018960042468634 & 0.037920084937268 & 0.981039957531366 \tabularnewline
34 & 0.0459113128460017 & 0.0918226256920034 & 0.954088687153998 \tabularnewline
35 & 0.0477723825563165 & 0.095544765112633 & 0.952227617443683 \tabularnewline
36 & 0.0376573262029424 & 0.0753146524058848 & 0.962342673797058 \tabularnewline
37 & 0.0268985281094806 & 0.0537970562189612 & 0.97310147189052 \tabularnewline
38 & 0.0171155598416064 & 0.0342311196832127 & 0.982884440158394 \tabularnewline
39 & 0.00909906306947408 & 0.0181981261389482 & 0.990900936930526 \tabularnewline
40 & 0.0209416955685161 & 0.0418833911370323 & 0.979058304431484 \tabularnewline
41 & 0.0129061039244713 & 0.0258122078489426 & 0.987093896075529 \tabularnewline
42 & 0.0141686549465306 & 0.0283373098930611 & 0.98583134505347 \tabularnewline
43 & 0.0202078647078571 & 0.0404157294157142 & 0.979792135292143 \tabularnewline
\hline
\end{tabular}
%Source: https://freestatistics.org/blog/index.php?pk=58332&T=5

[TABLE]
[ROW][C]Goldfeld-Quandt test for Heteroskedasticity[/C][/ROW]
[ROW][C]p-values[/C][C]Alternative Hypothesis[/C][/ROW]
[ROW][C]breakpoint index[/C][C]greater[/C][C]2-sided[/C][C]less[/C][/ROW]
[ROW][C]17[/C][C]0.0131851026298001[/C][C]0.0263702052596002[/C][C]0.9868148973702[/C][/ROW]
[ROW][C]18[/C][C]0.0105625755656915[/C][C]0.0211251511313831[/C][C]0.989437424434308[/C][/ROW]
[ROW][C]19[/C][C]0.00472278005168832[/C][C]0.00944556010337664[/C][C]0.995277219948312[/C][/ROW]
[ROW][C]20[/C][C]0.00204835481270120[/C][C]0.00409670962540241[/C][C]0.997951645187299[/C][/ROW]
[ROW][C]21[/C][C]0.00304232077198455[/C][C]0.0060846415439691[/C][C]0.996957679228015[/C][/ROW]
[ROW][C]22[/C][C]0.00115514368199335[/C][C]0.00231028736398671[/C][C]0.998844856318007[/C][/ROW]
[ROW][C]23[/C][C]0.000549541442532897[/C][C]0.00109908288506579[/C][C]0.999450458557467[/C][/ROW]
[ROW][C]24[/C][C]0.000182122977359863[/C][C]0.000364245954719725[/C][C]0.99981787702264[/C][/ROW]
[ROW][C]25[/C][C]0.000117580008112125[/C][C]0.00023516001622425[/C][C]0.999882419991888[/C][/ROW]
[ROW][C]26[/C][C]5.74731260398207e-05[/C][C]0.000114946252079641[/C][C]0.99994252687396[/C][/ROW]
[ROW][C]27[/C][C]2.64589758728815e-05[/C][C]5.2917951745763e-05[/C][C]0.999973541024127[/C][/ROW]
[ROW][C]28[/C][C]2.75281750802481e-05[/C][C]5.50563501604961e-05[/C][C]0.99997247182492[/C][/ROW]
[ROW][C]29[/C][C]2.26462357928356e-05[/C][C]4.52924715856713e-05[/C][C]0.999977353764207[/C][/ROW]
[ROW][C]30[/C][C]2.85361502470566e-05[/C][C]5.70723004941132e-05[/C][C]0.999971463849753[/C][/ROW]
[ROW][C]31[/C][C]0.000808416445635874[/C][C]0.00161683289127175[/C][C]0.999191583554364[/C][/ROW]
[ROW][C]32[/C][C]0.00300859417020058[/C][C]0.00601718834040116[/C][C]0.9969914058298[/C][/ROW]
[ROW][C]33[/C][C]0.018960042468634[/C][C]0.037920084937268[/C][C]0.981039957531366[/C][/ROW]
[ROW][C]34[/C][C]0.0459113128460017[/C][C]0.0918226256920034[/C][C]0.954088687153998[/C][/ROW]
[ROW][C]35[/C][C]0.0477723825563165[/C][C]0.095544765112633[/C][C]0.952227617443683[/C][/ROW]
[ROW][C]36[/C][C]0.0376573262029424[/C][C]0.0753146524058848[/C][C]0.962342673797058[/C][/ROW]
[ROW][C]37[/C][C]0.0268985281094806[/C][C]0.0537970562189612[/C][C]0.97310147189052[/C][/ROW]
[ROW][C]38[/C][C]0.0171155598416064[/C][C]0.0342311196832127[/C][C]0.982884440158394[/C][/ROW]
[ROW][C]39[/C][C]0.00909906306947408[/C][C]0.0181981261389482[/C][C]0.990900936930526[/C][/ROW]
[ROW][C]40[/C][C]0.0209416955685161[/C][C]0.0418833911370323[/C][C]0.979058304431484[/C][/ROW]
[ROW][C]41[/C][C]0.0129061039244713[/C][C]0.0258122078489426[/C][C]0.987093896075529[/C][/ROW]
[ROW][C]42[/C][C]0.0141686549465306[/C][C]0.0283373098930611[/C][C]0.98583134505347[/C][/ROW]
[ROW][C]43[/C][C]0.0202078647078571[/C][C]0.0404157294157142[/C][C]0.979792135292143[/C][/ROW]
[/TABLE]
Source: https://freestatistics.org/blog/index.php?pk=58332&T=5

Globally Unique Identifier (entire table): ba.freestatistics.org/blog/index.php?pk=58332&T=5

As an alternative you can also use a QR Code:  

The GUIDs for individual cells are displayed in the table below:

Goldfeld-Quandt test for Heteroskedasticity
p-valuesAlternative Hypothesis
breakpoint indexgreater2-sidedless
170.01318510262980010.02637020525960020.9868148973702
180.01056257556569150.02112515113138310.989437424434308
190.004722780051688320.009445560103376640.995277219948312
200.002048354812701200.004096709625402410.997951645187299
210.003042320771984550.00608464154396910.996957679228015
220.001155143681993350.002310287363986710.998844856318007
230.0005495414425328970.001099082885065790.999450458557467
240.0001821229773598630.0003642459547197250.99981787702264
250.0001175800081121250.000235160016224250.999882419991888
265.74731260398207e-050.0001149462520796410.99994252687396
272.64589758728815e-055.2917951745763e-050.999973541024127
282.75281750802481e-055.50563501604961e-050.99997247182492
292.26462357928356e-054.52924715856713e-050.999977353764207
302.85361502470566e-055.70723004941132e-050.999971463849753
310.0008084164456358740.001616832891271750.999191583554364
320.003008594170200580.006017188340401160.9969914058298
330.0189600424686340.0379200849372680.981039957531366
340.04591131284600170.09182262569200340.954088687153998
350.04777238255631650.0955447651126330.952227617443683
360.03765732620294240.07531465240588480.962342673797058
370.02689852810948060.05379705621896120.97310147189052
380.01711555984160640.03423111968321270.982884440158394
390.009099063069474080.01819812613894820.990900936930526
400.02094169556851610.04188339113703230.979058304431484
410.01290610392447130.02581220784894260.987093896075529
420.01416865494653060.02833730989306110.98583134505347
430.02020786470785710.04041572941571420.979792135292143


Meta Analysis of Goldfeld-Quandt test for Heteroskedasticity
Description# significant tests% significant testsOK/NOK
1% type I error level140.518518518518518NOK
5% type I error level230.851851851851852NOK
10% type I error level271NOK

\begin{tabular}{lllllllll}
\hline
Meta Analysis of Goldfeld-Quandt test for Heteroskedasticity \tabularnewline
Description & # significant tests & % significant tests & OK/NOK \tabularnewline
1% type I error level & 14 & 0.518518518518518 & NOK \tabularnewline
5% type I error level & 23 & 0.851851851851852 & NOK \tabularnewline
10% type I error level & 27 & 1 & NOK \tabularnewline
\hline
\end{tabular}
%Source: https://freestatistics.org/blog/index.php?pk=58332&T=6

[TABLE]
[ROW][C]Meta Analysis of Goldfeld-Quandt test for Heteroskedasticity[/C][/ROW]
[ROW][C]Description[/C][C]# significant tests[/C][C]% significant tests[/C][C]OK/NOK[/C][/ROW]
[ROW][C]1% type I error level[/C][C]14[/C][C]0.518518518518518[/C][C]NOK[/C][/ROW]
[ROW][C]5% type I error level[/C][C]23[/C][C]0.851851851851852[/C][C]NOK[/C][/ROW]
[ROW][C]10% type I error level[/C][C]27[/C][C]1[/C][C]NOK[/C][/ROW]
[/TABLE]
Source: https://freestatistics.org/blog/index.php?pk=58332&T=6

Globally Unique Identifier (entire table): ba.freestatistics.org/blog/index.php?pk=58332&T=6

As an alternative you can also use a QR Code:  

The GUIDs for individual cells are displayed in the table below:

Meta Analysis of Goldfeld-Quandt test for Heteroskedasticity
Description# significant tests% significant testsOK/NOK
1% type I error level140.518518518518518NOK
5% type I error level230.851851851851852NOK
10% type I error level271NOK


Parameters (Session):
par1 = 1 ; par2 = Include Monthly Dummies ; par3 = Linear Trend ;
Parameters (R input):
par1 = 1 ; par2 = Include Monthly Dummies ; par3 = Linear Trend ;
R code (references can be found in the software module):
library(lattice)
library(lmtest)
n25 <- 25 #minimum number of obs. for Goldfeld-Quandt test
par1 <- as.numeric(par1)
x <- t(y)
k <- length(x[1,])
n <- length(x[,1])
x1 <- cbind(x[,par1], x[,1:k!=par1])
mycolnames <- c(colnames(x)[par1], colnames(x)[1:k!=par1])
colnames(x1) <- mycolnames #colnames(x)[par1]
x <- x1
if (par3 == 'First Differences'){
x2 <- array(0, dim=c(n-1,k), dimnames=list(1:(n-1), paste('(1-B)',colnames(x),sep='')))
for (i in 1:n-1) {
for (j in 1:k) {
x2[i,j] <- x[i+1,j] - x[i,j]
}
}
x <- x2
}
if (par2 == 'Include Monthly Dummies'){
x2 <- array(0, dim=c(n,11), dimnames=list(1:n, paste('M', seq(1:11), sep ='')))
for (i in 1:11){
x2[seq(i,n,12),i] <- 1
}
x <- cbind(x, x2)
}
if (par2 == 'Include Quarterly Dummies'){
x2 <- array(0, dim=c(n,3), dimnames=list(1:n, paste('Q', seq(1:3), sep ='')))
for (i in 1:3){
x2[seq(i,n,4),i] <- 1
}
x <- cbind(x, x2)
}
k <- length(x[1,])
if (par3 == 'Linear Trend'){
x <- cbind(x, c(1:n))
colnames(x)[k+1] <- 't'
}
x
k <- length(x[1,])
df <- as.data.frame(x)
(mylm <- lm(df))
(mysum <- summary(mylm))
if (n > n25) {
kp3 <- k + 3
nmkm3 <- n - k - 3
gqarr <- array(NA, dim=c(nmkm3-kp3+1,3))
numgqtests <- 0
numsignificant1 <- 0
numsignificant5 <- 0
numsignificant10 <- 0
for (mypoint in kp3:nmkm3) {
j <- 0
numgqtests <- numgqtests + 1
for (myalt in c('greater', 'two.sided', 'less')) {
j <- j + 1
gqarr[mypoint-kp3+1,j] <- gqtest(mylm, point=mypoint, alternative=myalt)$p.value
}
if (gqarr[mypoint-kp3+1,2] < 0.01) numsignificant1 <- numsignificant1 + 1
if (gqarr[mypoint-kp3+1,2] < 0.05) numsignificant5 <- numsignificant5 + 1
if (gqarr[mypoint-kp3+1,2] < 0.10) numsignificant10 <- numsignificant10 + 1
}
gqarr
}
bitmap(file='test0.png')
plot(x[,1], type='l', main='Actuals and Interpolation', ylab='value of Actuals and Interpolation (dots)', xlab='time or index')
points(x[,1]-mysum$resid)
grid()
dev.off()
bitmap(file='test1.png')
plot(mysum$resid, type='b', pch=19, main='Residuals', ylab='value of Residuals', xlab='time or index')
grid()
dev.off()
bitmap(file='test2.png')
hist(mysum$resid, main='Residual Histogram', xlab='values of Residuals')
grid()
dev.off()
bitmap(file='test3.png')
densityplot(~mysum$resid,col='black',main='Residual Density Plot', xlab='values of Residuals')
dev.off()
bitmap(file='test4.png')
qqnorm(mysum$resid, main='Residual Normal Q-Q Plot')
qqline(mysum$resid)
grid()
dev.off()
(myerror <- as.ts(mysum$resid))
bitmap(file='test5.png')
dum <- cbind(lag(myerror,k=1),myerror)
dum
dum1 <- dum[2:length(myerror),]
dum1
z <- as.data.frame(dum1)
z
plot(z,main=paste('Residual Lag plot, lowess, and regression line'), ylab='values of Residuals', xlab='lagged values of Residuals')
lines(lowess(z))
abline(lm(z))
grid()
dev.off()
bitmap(file='test6.png')
acf(mysum$resid, lag.max=length(mysum$resid)/2, main='Residual Autocorrelation Function')
grid()
dev.off()
bitmap(file='test7.png')
pacf(mysum$resid, lag.max=length(mysum$resid)/2, main='Residual Partial Autocorrelation Function')
grid()
dev.off()
bitmap(file='test8.png')
opar <- par(mfrow = c(2,2), oma = c(0, 0, 1.1, 0))
plot(mylm, las = 1, sub='Residual Diagnostics')
par(opar)
dev.off()
if (n > n25) {
bitmap(file='test9.png')
plot(kp3:nmkm3,gqarr[,2], main='Goldfeld-Quandt test',ylab='2-sided p-value',xlab='breakpoint')
grid()
dev.off()
}
load(file='createtable')
a<-table.start()
a<-table.row.start(a)
a<-table.element(a, 'Multiple Linear Regression - Estimated Regression Equation', 1, TRUE)
a<-table.row.end(a)
myeq <- colnames(x)[1]
myeq <- paste(myeq, '[t] = ', sep='')
for (i in 1:k){
if (mysum$coefficients[i,1] > 0) myeq <- paste(myeq, '+', '')
myeq <- paste(myeq, mysum$coefficients[i,1], sep=' ')
if (rownames(mysum$coefficients)[i] != '(Intercept)') {
myeq <- paste(myeq, rownames(mysum$coefficients)[i], sep='')
if (rownames(mysum$coefficients)[i] != 't') myeq <- paste(myeq, '[t]', sep='')
}
}
myeq <- paste(myeq, ' + e[t]')
a<-table.row.start(a)
a<-table.element(a, myeq)
a<-table.row.end(a)
a<-table.end(a)
table.save(a,file='mytable1.tab')
a<-table.start()
a<-table.row.start(a)
a<-table.element(a,hyperlink('ols1.htm','Multiple Linear Regression - Ordinary Least Squares',''), 6, TRUE)
a<-table.row.end(a)
a<-table.row.start(a)
a<-table.element(a,'Variable',header=TRUE)
a<-table.element(a,'Parameter',header=TRUE)
a<-table.element(a,'S.D.',header=TRUE)
a<-table.element(a,'T-STAT
H0: parameter = 0',header=TRUE)
a<-table.element(a,'2-tail p-value',header=TRUE)
a<-table.element(a,'1-tail p-value',header=TRUE)
a<-table.row.end(a)
for (i in 1:k){
a<-table.row.start(a)
a<-table.element(a,rownames(mysum$coefficients)[i],header=TRUE)
a<-table.element(a,mysum$coefficients[i,1])
a<-table.element(a, round(mysum$coefficients[i,2],6))
a<-table.element(a, round(mysum$coefficients[i,3],4))
a<-table.element(a, round(mysum$coefficients[i,4],6))
a<-table.element(a, round(mysum$coefficients[i,4]/2,6))
a<-table.row.end(a)
}
a<-table.end(a)
table.save(a,file='mytable2.tab')
a<-table.start()
a<-table.row.start(a)
a<-table.element(a, 'Multiple Linear Regression - Regression Statistics', 2, TRUE)
a<-table.row.end(a)
a<-table.row.start(a)
a<-table.element(a, 'Multiple R',1,TRUE)
a<-table.element(a, sqrt(mysum$r.squared))
a<-table.row.end(a)
a<-table.row.start(a)
a<-table.element(a, 'R-squared',1,TRUE)
a<-table.element(a, mysum$r.squared)
a<-table.row.end(a)
a<-table.row.start(a)
a<-table.element(a, 'Adjusted R-squared',1,TRUE)
a<-table.element(a, mysum$adj.r.squared)
a<-table.row.end(a)
a<-table.row.start(a)
a<-table.element(a, 'F-TEST (value)',1,TRUE)
a<-table.element(a, mysum$fstatistic[1])
a<-table.row.end(a)
a<-table.row.start(a)
a<-table.element(a, 'F-TEST (DF numerator)',1,TRUE)
a<-table.element(a, mysum$fstatistic[2])
a<-table.row.end(a)
a<-table.row.start(a)
a<-table.element(a, 'F-TEST (DF denominator)',1,TRUE)
a<-table.element(a, mysum$fstatistic[3])
a<-table.row.end(a)
a<-table.row.start(a)
a<-table.element(a, 'p-value',1,TRUE)
a<-table.element(a, 1-pf(mysum$fstatistic[1],mysum$fstatistic[2],mysum$fstatistic[3]))
a<-table.row.end(a)
a<-table.row.start(a)
a<-table.element(a, 'Multiple Linear Regression - Residual Statistics', 2, TRUE)
a<-table.row.end(a)
a<-table.row.start(a)
a<-table.element(a, 'Residual Standard Deviation',1,TRUE)
a<-table.element(a, mysum$sigma)
a<-table.row.end(a)
a<-table.row.start(a)
a<-table.element(a, 'Sum Squared Residuals',1,TRUE)
a<-table.element(a, sum(myerror*myerror))
a<-table.row.end(a)
a<-table.end(a)
table.save(a,file='mytable3.tab')
a<-table.start()
a<-table.row.start(a)
a<-table.element(a, 'Multiple Linear Regression - Actuals, Interpolation, and Residuals', 4, TRUE)
a<-table.row.end(a)
a<-table.row.start(a)
a<-table.element(a, 'Time or Index', 1, TRUE)
a<-table.element(a, 'Actuals', 1, TRUE)
a<-table.element(a, 'Interpolation
Forecast', 1, TRUE)
a<-table.element(a, 'Residuals
Prediction Error', 1, TRUE)
a<-table.row.end(a)
for (i in 1:n) {
a<-table.row.start(a)
a<-table.element(a,i, 1, TRUE)
a<-table.element(a,x[i])
a<-table.element(a,x[i]-mysum$resid[i])
a<-table.element(a,mysum$resid[i])
a<-table.row.end(a)
}
a<-table.end(a)
table.save(a,file='mytable4.tab')
if (n > n25) {
a<-table.start()
a<-table.row.start(a)
a<-table.element(a,'Goldfeld-Quandt test for Heteroskedasticity',4,TRUE)
a<-table.row.end(a)
a<-table.row.start(a)
a<-table.element(a,'p-values',header=TRUE)
a<-table.element(a,'Alternative Hypothesis',3,header=TRUE)
a<-table.row.end(a)
a<-table.row.start(a)
a<-table.element(a,'breakpoint index',header=TRUE)
a<-table.element(a,'greater',header=TRUE)
a<-table.element(a,'2-sided',header=TRUE)
a<-table.element(a,'less',header=TRUE)
a<-table.row.end(a)
for (mypoint in kp3:nmkm3) {
a<-table.row.start(a)
a<-table.element(a,mypoint,header=TRUE)
a<-table.element(a,gqarr[mypoint-kp3+1,1])
a<-table.element(a,gqarr[mypoint-kp3+1,2])
a<-table.element(a,gqarr[mypoint-kp3+1,3])
a<-table.row.end(a)
}
a<-table.end(a)
table.save(a,file='mytable5.tab')
a<-table.start()
a<-table.row.start(a)
a<-table.element(a,'Meta Analysis of Goldfeld-Quandt test for Heteroskedasticity',4,TRUE)
a<-table.row.end(a)
a<-table.row.start(a)
a<-table.element(a,'Description',header=TRUE)
a<-table.element(a,'# significant tests',header=TRUE)
a<-table.element(a,'% significant tests',header=TRUE)
a<-table.element(a,'OK/NOK',header=TRUE)
a<-table.row.end(a)
a<-table.row.start(a)
a<-table.element(a,'1% type I error level',header=TRUE)
a<-table.element(a,numsignificant1)
a<-table.element(a,numsignificant1/numgqtests)
if (numsignificant1/numgqtests < 0.01) dum <- 'OK' else dum <- 'NOK'
a<-table.element(a,dum)
a<-table.row.end(a)
a<-table.row.start(a)
a<-table.element(a,'5% type I error level',header=TRUE)
a<-table.element(a,numsignificant5)
a<-table.element(a,numsignificant5/numgqtests)
if (numsignificant5/numgqtests < 0.05) dum <- 'OK' else dum <- 'NOK'
a<-table.element(a,dum)
a<-table.row.end(a)
a<-table.row.start(a)
a<-table.element(a,'10% type I error level',header=TRUE)
a<-table.element(a,numsignificant10)
a<-table.element(a,numsignificant10/numgqtests)
if (numsignificant10/numgqtests < 0.1) dum <- 'OK' else dum <- 'NOK'
a<-table.element(a,dum)
a<-table.row.end(a)
a<-table.end(a)
table.save(a,file='mytable6.tab')
}