| Multiple Linear Regression - Estimated Regression Equation |
| WK>25j[t] = + 390.495158429888 -2.19378103570580ExpBE[t] + 10.6069652991252M1[t] + 10.2304297706313M2[t] + 11.8414563135492M3[t] + 2.98448805864265M4[t] -0.0308036769922362M5[t] + 1.30892941593749M6[t] + 14.246841747458M7[t] + 8.873604871128M8[t] + 14.0824323126034M9[t] + 9.7110161976826M10[t] + 0.0233314613383325M11[t] + 2.19079421849136t + e[t] |
| Multiple Linear Regression - Ordinary Least Squares | |||||
| Variable | Parameter | S.D. | T-STAT H0: parameter = 0 | 2-tail p-value | 1-tail p-value |
| (Intercept) | 390.495158429888 | 41.993521 | 9.2989 | 0 | 0 |
| ExpBE | -2.19378103570580 | 3.135346 | -0.6997 | 0.487642 | 0.243821 |
| M1 | 10.6069652991252 | 9.525558 | 1.1135 | 0.271267 | 0.135634 |
| M2 | 10.2304297706313 | 9.577269 | 1.0682 | 0.291005 | 0.145502 |
| M3 | 11.8414563135492 | 12.538244 | 0.9444 | 0.349886 | 0.174943 |
| M4 | 2.98448805864265 | 9.926101 | 0.3007 | 0.76502 | 0.38251 |
| M5 | -0.0308036769922362 | 9.914293 | -0.0031 | 0.997534 | 0.498767 |
| M6 | 1.30892941593749 | 10.925694 | 0.1198 | 0.905161 | 0.452581 |
| M7 | 14.246841747458 | 9.472688 | 1.504 | 0.139419 | 0.06971 |
| M8 | 8.873604871128 | 11.307812 | 0.7847 | 0.436633 | 0.218317 |
| M9 | 14.0824323126034 | 11.06017 | 1.2733 | 0.209324 | 0.104662 |
| M10 | 9.7110161976826 | 11.086558 | 0.8759 | 0.385621 | 0.19281 |
| M11 | 0.0233314613383325 | 10.240284 | 0.0023 | 0.998192 | 0.499096 |
| t | 2.19079421849136 | 0.281584 | 7.7803 | 0 | 0 |
| Multiple Linear Regression - Regression Statistics | |
| Multiple R | 0.937327976220717 |
| R-squared | 0.878583735006024 |
| Adjusted R-squared | 0.844270442725118 |
| F-TEST (value) | 25.604763536343 |
| F-TEST (DF numerator) | 13 |
| F-TEST (DF denominator) | 46 |
| p-value | 1.11022302462516e-16 |
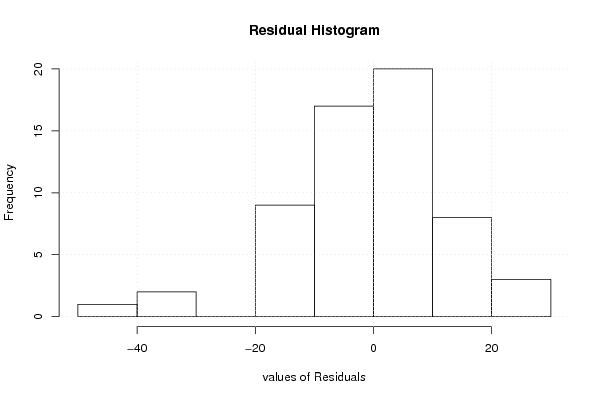
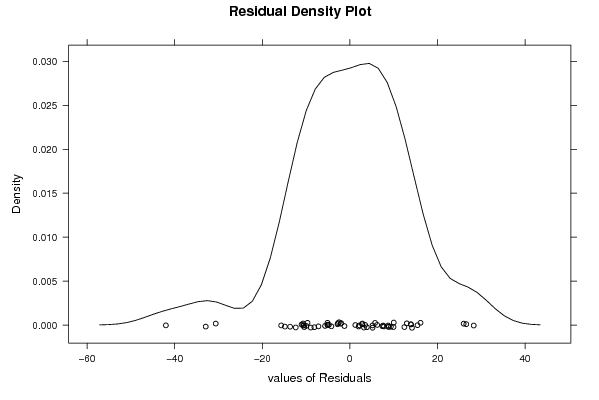
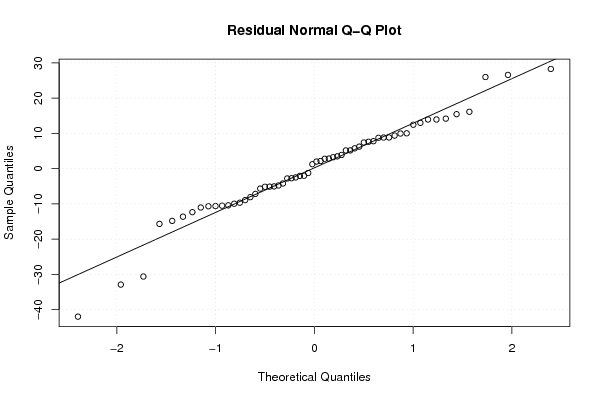
| Multiple Linear Regression - Residual Statistics | |
| Residual Standard Deviation | 14.8903066765169 |
| Sum Squared Residuals | 10199.1767143533 |
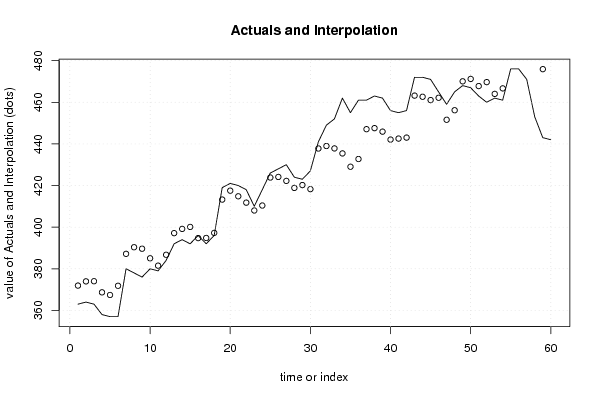
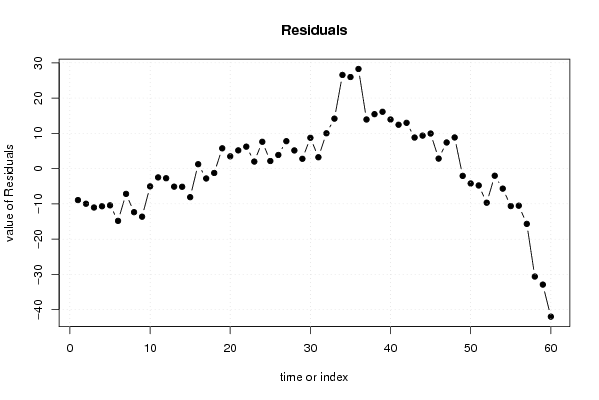
| Multiple Linear Regression - Actuals, Interpolation, and Residuals | |||
| Time or Index | Actuals | Interpolation Forecast | Residuals Prediction Error |
| 1 | 363 | 371.921849136911 | -8.92184913691128 |
| 2 | 364 | 373.95548593048 | -9.95548593048008 |
| 3 | 363 | 374.027878931189 | -11.0278789311894 |
| 4 | 358 | 368.677973516198 | -10.6779735161977 |
| 5 | 357 | 367.414719791913 | -10.4147197919130 |
| 6 | 357 | 371.822759517616 | -14.8227595176165 |
| 7 | 380 | 387.170844171199 | -7.17084417119895 |
| 8 | 378 | 390.350366516907 | -12.3503665169071 |
| 9 | 376 | 389.632998344762 | -13.6329983447624 |
| 10 | 380 | 385.039217309057 | -5.03921730905656 |
| 11 | 379 | 381.491132655474 | -2.49113265547411 |
| 12 | 384 | 386.729888862615 | -2.72988886261529 |
| 13 | 392 | 397.114489240955 | -5.11448924095547 |
| 14 | 394 | 399.148126034524 | -5.14812603452353 |
| 15 | 392 | 400.098031449515 | -8.09803144951522 |
| 16 | 396 | 394.748126034524 | 1.25187396547647 |
| 17 | 392 | 394.801140931662 | -2.80114093166232 |
| 18 | 396 | 397.234777725231 | -1.23477772523054 |
| 19 | 419 | 413.240996689525 | 5.75900331047528 |
| 20 | 421 | 417.517409553086 | 3.4825904469142 |
| 21 | 420 | 414.825638448806 | 5.17436155119415 |
| 22 | 418 | 411.767504138094 | 6.23249586190588 |
| 23 | 410 | 408.000041380941 | 1.99995861905893 |
| 24 | 418 | 410.386882241665 | 7.6131177583353 |
| 25 | 426 | 423.842776069993 | 2.15722393000698 |
| 26 | 428 | 424.121388034996 | 3.87861196500358 |
| 27 | 430 | 422.219378103571 | 7.7806218964294 |
| 28 | 424 | 418.843875620714 | 5.15612437928589 |
| 29 | 423 | 420.213159139276 | 2.78684086072363 |
| 30 | 427 | 418.259233861433 | 8.74076613856701 |
| 31 | 441 | 437.775502482856 | 3.22449751714354 |
| 32 | 449 | 438.980621896429 | 10.0193781035706 |
| 33 | 452 | 437.824497517144 | 14.1755024828565 |
| 34 | 462 | 435.424497517144 | 26.5755024828565 |
| 35 | 455 | 429.024497517144 | 25.9755024828565 |
| 36 | 461 | 432.727606999291 | 28.2723930007094 |
| 37 | 461 | 447.061013241901 | 13.9389867580987 |
| 38 | 463 | 447.559003310475 | 15.4409966895247 |
| 39 | 462 | 445.87637148262 | 16.12362851738 |
| 40 | 456 | 442.062112792622 | 13.9378872073776 |
| 41 | 455 | 442.553883896902 | 12.4461161030977 |
| 42 | 456 | 443.013117758335 | 12.9868822416647 |
| 43 | 472 | 463.187520690471 | 8.8124793095295 |
| 44 | 472 | 462.637615275479 | 9.36238472452115 |
| 45 | 471 | 461.042734689052 | 9.9572653109482 |
| 46 | 465 | 462.152784346181 | 2.84721565381893 |
| 47 | 459 | 451.58460037834 | 7.41539962165995 |
| 48 | 465 | 456.165222274769 | 8.83477772523053 |
| 49 | 468 | 470.059872310239 | -2.05987231023896 |
| 50 | 467 | 471.215996689525 | -4.21599668952469 |
| 51 | 463 | 467.778340033105 | -4.77834003310478 |
| 52 | 460 | 469.667912035942 | -9.66791203594225 |
| 53 | 462 | 464.017096240246 | -2.01709624024594 |
| 54 | 461 | 466.670111137385 | -5.67011113738472 |
| 55 | 476 | 486.625135965949 | -10.6251359659494 |
| 56 | 476 | 486.513986758099 | -10.5139867580988 |
| 57 | 471 | 486.674131000236 | -15.6741310002364 |
| 58 | 453 | 483.615996689525 | -30.6159966895247 |
| 59 | 443 | 475.899728068101 | -32.8997280681012 |
| 60 | 442 | 483.99039962166 | -41.9903996216599 |
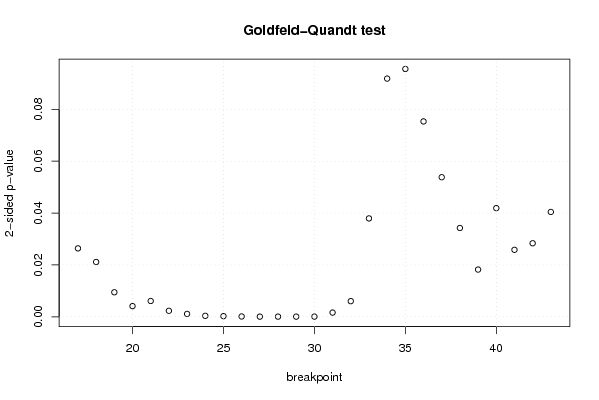
| Goldfeld-Quandt test for Heteroskedasticity | |||
| p-values | Alternative Hypothesis | ||
| breakpoint index | greater | 2-sided | less |
| 17 | 0.0131851026298001 | 0.0263702052596002 | 0.9868148973702 |
| 18 | 0.0105625755656915 | 0.0211251511313831 | 0.989437424434308 |
| 19 | 0.00472278005168832 | 0.00944556010337664 | 0.995277219948312 |
| 20 | 0.00204835481270120 | 0.00409670962540241 | 0.997951645187299 |
| 21 | 0.00304232077198455 | 0.0060846415439691 | 0.996957679228015 |
| 22 | 0.00115514368199335 | 0.00231028736398671 | 0.998844856318007 |
| 23 | 0.000549541442532897 | 0.00109908288506579 | 0.999450458557467 |
| 24 | 0.000182122977359863 | 0.000364245954719725 | 0.99981787702264 |
| 25 | 0.000117580008112125 | 0.00023516001622425 | 0.999882419991888 |
| 26 | 5.74731260398207e-05 | 0.000114946252079641 | 0.99994252687396 |
| 27 | 2.64589758728815e-05 | 5.2917951745763e-05 | 0.999973541024127 |
| 28 | 2.75281750802481e-05 | 5.50563501604961e-05 | 0.99997247182492 |
| 29 | 2.26462357928356e-05 | 4.52924715856713e-05 | 0.999977353764207 |
| 30 | 2.85361502470566e-05 | 5.70723004941132e-05 | 0.999971463849753 |
| 31 | 0.000808416445635874 | 0.00161683289127175 | 0.999191583554364 |
| 32 | 0.00300859417020058 | 0.00601718834040116 | 0.9969914058298 |
| 33 | 0.018960042468634 | 0.037920084937268 | 0.981039957531366 |
| 34 | 0.0459113128460017 | 0.0918226256920034 | 0.954088687153998 |
| 35 | 0.0477723825563165 | 0.095544765112633 | 0.952227617443683 |
| 36 | 0.0376573262029424 | 0.0753146524058848 | 0.962342673797058 |
| 37 | 0.0268985281094806 | 0.0537970562189612 | 0.97310147189052 |
| 38 | 0.0171155598416064 | 0.0342311196832127 | 0.982884440158394 |
| 39 | 0.00909906306947408 | 0.0181981261389482 | 0.990900936930526 |
| 40 | 0.0209416955685161 | 0.0418833911370323 | 0.979058304431484 |
| 41 | 0.0129061039244713 | 0.0258122078489426 | 0.987093896075529 |
| 42 | 0.0141686549465306 | 0.0283373098930611 | 0.98583134505347 |
| 43 | 0.0202078647078571 | 0.0404157294157142 | 0.979792135292143 |
| Meta Analysis of Goldfeld-Quandt test for Heteroskedasticity | |||
| Description | # significant tests | % significant tests | OK/NOK |
| 1% type I error level | 14 | 0.518518518518518 | NOK |
| 5% type I error level | 23 | 0.851851851851852 | NOK |
| 10% type I error level | 27 | 1 | NOK |