| Multiple Linear Regression - Estimated Regression Equation |
| Y[t] = + 0.685919050525686 + 0.845278920723775X[t] + 0.788576291718117`Y-1`[t] -0.607030562122719`Y-2`[t] -0.244013538273027`Y-3`[t] + 0.345411574379241`Y-4`[t] + 0.0826560113300043M1[t] -0.0160550741627145M2[t] + 0.0737205235477154M3[t] + 0.0404901747252967M4[t] + 0.0548013033823734M5[t] + 0.0782958665809638M6[t] -0.00171463003041461M7[t] + 0.0275101232145196M8[t] + 0.0666278757530691M9[t] -0.0270275012858383M10[t] + 0.0108858432721366M11[t] -0.0108698053993793t + e[t] |
| Multiple Linear Regression - Ordinary Least Squares | |||||
| Variable | Parameter | S.D. | T-STAT H0: parameter = 0 | 2-tail p-value | 1-tail p-value |
| (Intercept) | 0.685919050525686 | 0.112217 | 6.1124 | 0 | 0 |
| X | 0.845278920723775 | 0.124268 | 6.802 | 0 | 0 |
| `Y-1` | 0.788576291718117 | 0.162467 | 4.8538 | 2.1e-05 | 1e-05 |
| `Y-2` | -0.607030562122719 | 0.220893 | -2.7481 | 0.009119 | 0.004559 |
| `Y-3` | -0.244013538273027 | 0.232627 | -1.0489 | 0.300828 | 0.150414 |
| `Y-4` | 0.345411574379241 | 0.128304 | 2.6921 | 0.0105 | 0.00525 |
| M1 | 0.0826560113300043 | 0.066421 | 1.2444 | 0.220961 | 0.11048 |
| M2 | -0.0160550741627145 | 0.066433 | -0.2417 | 0.810334 | 0.405167 |
| M3 | 0.0737205235477154 | 0.065686 | 1.1223 | 0.268768 | 0.134384 |
| M4 | 0.0404901747252967 | 0.068564 | 0.5905 | 0.558319 | 0.27916 |
| M5 | 0.0548013033823734 | 0.070923 | 0.7727 | 0.444484 | 0.222242 |
| M6 | 0.0782958665809638 | 0.065971 | 1.1868 | 0.242665 | 0.121332 |
| M7 | -0.00171463003041461 | 0.067359 | -0.0255 | 0.979825 | 0.489913 |
| M8 | 0.0275101232145196 | 0.067721 | 0.4062 | 0.686855 | 0.343428 |
| M9 | 0.0666278757530691 | 0.071731 | 0.9289 | 0.358824 | 0.179412 |
| M10 | -0.0270275012858383 | 0.069232 | -0.3904 | 0.698429 | 0.349214 |
| M11 | 0.0108858432721366 | 0.069151 | 0.1574 | 0.875747 | 0.437874 |
| t | -0.0108698053993793 | 0.001735 | -6.2634 | 0 | 0 |
| Multiple Linear Regression - Regression Statistics | |
| Multiple R | 0.99746800308064 |
| R-squared | 0.99494241716968 |
| Adjusted R-squared | 0.992679814324536 |
| F-TEST (value) | 439.733565837805 |
| F-TEST (DF numerator) | 17 |
| F-TEST (DF denominator) | 38 |
| p-value | 0 |
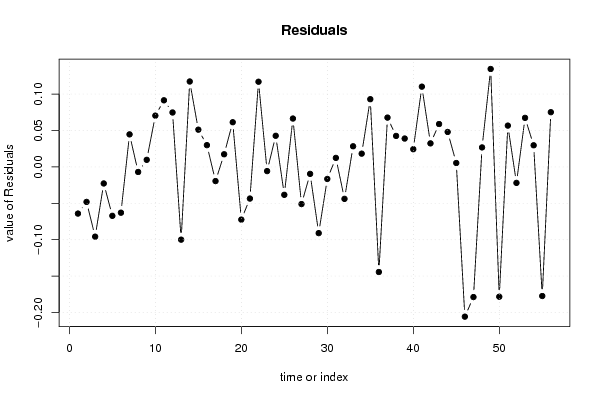
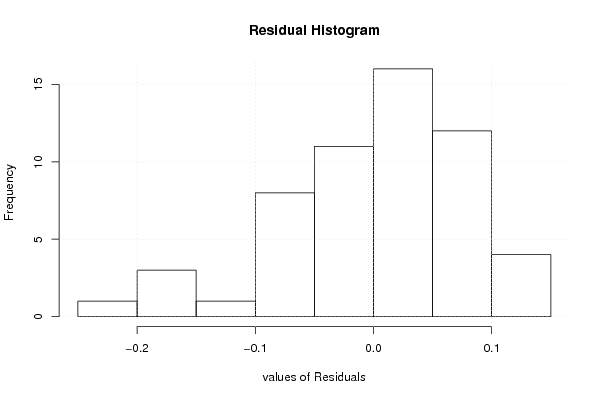
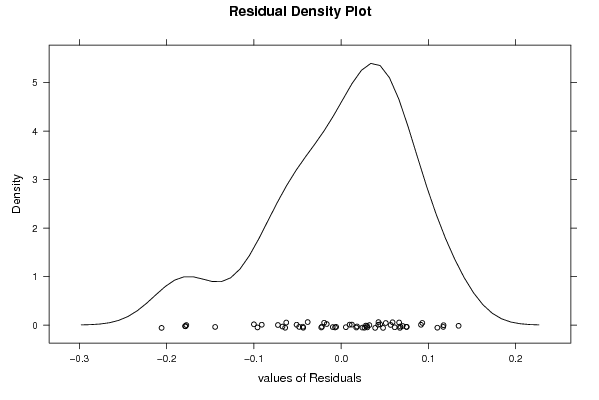
| Multiple Linear Regression - Residual Statistics | |
| Residual Standard Deviation | 0.095774680561324 |
| Sum Squared Residuals | 0.348565998591699 |
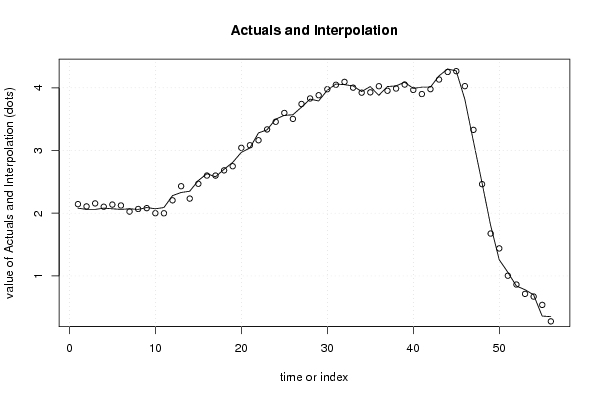
| Multiple Linear Regression - Actuals, Interpolation, and Residuals | |||
| Time or Index | Actuals | Interpolation Forecast | Residuals Prediction Error |
| 1 | 2.08 | 2.1440968620871 | -0.0640968620871015 |
| 2 | 2.06 | 2.10805944765967 | -0.0480594476596719 |
| 3 | 2.06 | 2.15583510731601 | -0.0958351073160126 |
| 4 | 2.08 | 2.10273869521331 | -0.0227386952133087 |
| 5 | 2.07 | 2.13719416230221 | -0.0671941623022063 |
| 6 | 2.06 | 2.12288431445420 | -0.0628843144541967 |
| 7 | 2.07 | 2.02530828438202 | 0.0446917156179751 |
| 8 | 2.06 | 2.06696766763630 | -0.00696766763630282 |
| 9 | 2.09 | 2.08024556587600 | 0.00975443412399725 |
| 10 | 2.07 | 1.99955372668396 | 0.070446273316036 |
| 11 | 2.09 | 1.99850907427104 | 0.0914909257289616 |
| 12 | 2.28 | 2.2052107709653 | 0.0747892290346999 |
| 13 | 2.33 | 2.42992847907675 | -0.0999284790767505 |
| 14 | 2.35 | 2.23265209371420 | 0.117347906285803 |
| 15 | 2.52 | 2.46884327315013 | 0.0511567268498732 |
| 16 | 2.63 | 2.60008799949636 | 0.0299120005036413 |
| 17 | 2.58 | 2.59946782723569 | -0.0194678272356881 |
| 18 | 2.7 | 2.68263606877761 | 0.0173639312223915 |
| 19 | 2.81 | 2.7486149283136 | 0.0613850716864012 |
| 20 | 2.97 | 3.04238528106973 | -0.0723852810697316 |
| 21 | 3.04 | 3.08347986973858 | -0.0434798697385766 |
| 22 | 3.28 | 3.16295776767734 | 0.117042232322657 |
| 23 | 3.33 | 3.33572058455773 | -0.00572058455772807 |
| 24 | 3.5 | 3.45721104996518 | 0.0427889500348235 |
| 25 | 3.56 | 3.59831925840277 | -0.0383192584027656 |
| 26 | 3.57 | 3.50355585039026 | 0.0664441496097411 |
| 27 | 3.69 | 3.74103357928462 | -0.0510335792846186 |
| 28 | 3.82 | 3.82957142979586 | -0.00957142979585707 |
| 29 | 3.79 | 3.88096856260221 | -0.0909685626022074 |
| 30 | 3.96 | 3.97651427990589 | -0.0165142799058946 |
| 31 | 4.06 | 4.04763049330091 | 0.0123695066990860 |
| 32 | 4.05 | 4.09387178557491 | -0.04387178557491 |
| 33 | 4.03 | 4.00168626484684 | 0.0283137351531647 |
| 34 | 3.94 | 3.92177847601258 | 0.0182215239874179 |
| 35 | 4.02 | 3.92697205297966 | 0.0930279470203444 |
| 36 | 3.88 | 4.0243614132583 | -0.144361413258301 |
| 37 | 4.02 | 3.95223748033556 | 0.0677625196644388 |
| 38 | 4.03 | 3.98743342422521 | 0.0425665757747948 |
| 39 | 4.09 | 4.05103552206482 | 0.0389644779351797 |
| 40 | 3.99 | 3.96566012395356 | 0.0243398760464363 |
| 41 | 4.01 | 3.89973946934245 | 0.110260530657550 |
| 42 | 4.01 | 3.97765211263571 | 0.0323478873642938 |
| 43 | 4.19 | 4.1310769778535 | 0.0589230221465051 |
| 44 | 4.3 | 4.25195423000493 | 0.0480457699950725 |
| 45 | 4.27 | 4.26458829953858 | 0.0054117004614147 |
| 46 | 3.82 | 4.02571002962611 | -0.205710029626111 |
| 47 | 3.15 | 3.32879828819158 | -0.178798288191578 |
| 48 | 2.49 | 2.46321676581122 | 0.026783234188778 |
| 49 | 1.81 | 1.67541792009782 | 0.134582079902179 |
| 50 | 1.26 | 1.43829918401067 | -0.178299184010667 |
| 51 | 1.06 | 1.00325251818442 | 0.0567474818155784 |
| 52 | 0.84 | 0.861941751540912 | -0.0219417515409118 |
| 53 | 0.78 | 0.712629978517448 | 0.067370021482552 |
| 54 | 0.7 | 0.670313224226594 | 0.0296867757734061 |
| 55 | 0.36 | 0.537369316149968 | -0.177369316149968 |
| 56 | 0.35 | 0.274821035714128 | 0.075178964285872 |
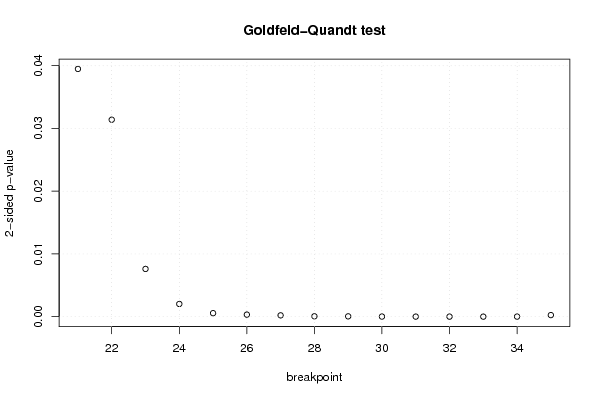
| Goldfeld-Quandt test for Heteroskedasticity | |||
| p-values | Alternative Hypothesis | ||
| breakpoint index | greater | 2-sided | less |
| 21 | 0.0197401558315580 | 0.0394803116631159 | 0.980259844168442 |
| 22 | 0.0156949090654281 | 0.0313898181308562 | 0.984305090934572 |
| 23 | 0.00380451728471922 | 0.00760903456943843 | 0.99619548271528 |
| 24 | 0.00101238722447987 | 0.00202477444895974 | 0.99898761277552 |
| 25 | 0.000280083704313999 | 0.000560167408627998 | 0.999719916295686 |
| 26 | 0.000162992130887081 | 0.000325984261774162 | 0.999837007869113 |
| 27 | 0.000104324205607190 | 0.000208648411214380 | 0.999895675794393 |
| 28 | 2.98189529391630e-05 | 5.96379058783261e-05 | 0.99997018104706 |
| 29 | 2.54620718564248e-05 | 5.09241437128496e-05 | 0.999974537928144 |
| 30 | 8.13562944900058e-06 | 1.62712588980012e-05 | 0.999991864370551 |
| 31 | 3.45168331209004e-06 | 6.90336662418008e-06 | 0.999996548316688 |
| 32 | 8.55482100914298e-07 | 1.71096420182860e-06 | 0.999999144517899 |
| 33 | 1.10014839048648e-06 | 2.20029678097297e-06 | 0.99999889985161 |
| 34 | 4.81055231117813e-06 | 9.62110462235626e-06 | 0.99999518944769 |
| 35 | 0.000124737582380854 | 0.000249475164761708 | 0.99987526241762 |
| Meta Analysis of Goldfeld-Quandt test for Heteroskedasticity | |||
| Description | # significant tests | % significant tests | OK/NOK |
| 1% type I error level | 13 | 0.866666666666667 | NOK |
| 5% type I error level | 15 | 1 | NOK |
| 10% type I error level | 15 | 1 | NOK |