Free Statistics

of Irreproducible Research!

Author's title

Author*The author of this computation has been verified*
R Software Modulerwasp_multipleregression.wasp
Title produced by softwareMultiple Regression
Date of computationFri, 20 Nov 2009 10:25:03 -0700
Cite this page as followsStatistical Computations at FreeStatistics.org, Office for Research Development and Education, URL https://freestatistics.org/blog/index.php?v=date/2009/Nov/20/t1258738068qdxb5im8ew4mysd.htm/, Retrieved Tue, 23 Apr 2024 15:46:11 +0000
Statistical Computations at FreeStatistics.org, Office for Research Development and Education, URL https://freestatistics.org/blog/index.php?pk=58354, Retrieved Tue, 23 Apr 2024 15:46:11 +0000
QR Codes:

Original text written by user:
IsPrivate?No (this computation is public)
User-defined keywords
Estimated Impact133
Family? (F = Feedback message, R = changed R code, M = changed R Module, P = changed Parameters, D = changed Data)
-     [Multiple Regression] [Q1 The Seatbeltlaw] [2007-11-14 19:27:43] [8cd6641b921d30ebe00b648d1481bba0]
- RMPD  [Multiple Regression] [Seatbelt] [2009-11-12 13:54:52] [b98453cac15ba1066b407e146608df68]
-   PD      [Multiple Regression] [link 3] [2009-11-20 17:25:03] [9a3898f49d4e2f0208d1968305d88f0a] [Current]
Feedback Forum

Post a new message
Dataseries X:
3956.2	3977.7
3142.7	3983.4
3884.3	4152.9
3892.2	4286.1
3613	4348.1
3730.5	3949.3
3481.3	4166.7
3649.5	4217.9
4215.2	4528.2
4066.6	4232.2
4196.8	4470.9
4536.6	5121.2
4441.6	4170.8
3548.3	4398.6
4735.9	4491.4
4130.6	4251.8
4356.2	4901.9
4159.6	4745.2
3988	4666.9
4167.8	4210.4
4902.2	5273.6
3909.4	4095.3
4697.6	4610.1
4308.9	4718.1
4420.4	4185.5
3544.2	4314.7
4433	4422.6
4479.7	5059.2
4533.2	5043.6
4237.5	4436.6
4207.4	4922.6
4394	4454.8
5148.4	5058.7
4202.2	4768.9
4682.5	5171.8
4884.3	4989.3
5288.9	5202.1
4505.2	4838.4
4611.5	4876.5
5104	5875.5
4586.6	5717.9
4529.3	4778.8
4504.1	6195.9
4604.9	4625.4
4795.4	5549.8
5391.1	6397.6
5213.9	5856.7
5415	6343.8
5990.3	6615.5
4241.8	5904.6
5677.6	6861
5164.2	6553.5
3962.3	5481
4011	5435.3
3310.3	5278
3837.3	4671.8
4145.3	4891.5
3796.7	4241.6
3849.6	4152.1
4285	4484.4
4189.6	4124.7


Summary of computational transaction
Raw Inputview raw input (R code)
Raw Outputview raw output of R engine
Computing time3 seconds
R Server'Gwilym Jenkins' @ 72.249.127.135

\begin{tabular}{lllllllll}
\hline
Summary of computational transaction \tabularnewline
Raw Input & view raw input (R code)  \tabularnewline
Raw Output & view raw output of R engine  \tabularnewline
Computing time & 3 seconds \tabularnewline
R Server & 'Gwilym Jenkins' @ 72.249.127.135 \tabularnewline
\hline
\end{tabular}
%Source: https://freestatistics.org/blog/index.php?pk=58354&T=0

[TABLE]
[ROW][C]Summary of computational transaction[/C][/ROW]
[ROW][C]Raw Input[/C][C]view raw input (R code) [/C][/ROW]
[ROW][C]Raw Output[/C][C]view raw output of R engine [/C][/ROW]
[ROW][C]Computing time[/C][C]3 seconds[/C][/ROW]
[ROW][C]R Server[/C][C]'Gwilym Jenkins' @ 72.249.127.135[/C][/ROW]
[/TABLE]
Source: https://freestatistics.org/blog/index.php?pk=58354&T=0

Globally Unique Identifier (entire table): ba.freestatistics.org/blog/index.php?pk=58354&T=0

As an alternative you can also use a QR Code:  

The GUIDs for individual cells are displayed in the table below:

Summary of computational transaction
Raw Inputview raw input (R code)
Raw Outputview raw output of R engine
Computing time3 seconds
R Server'Gwilym Jenkins' @ 72.249.127.135


Multiple Linear Regression - Estimated Regression Equation
Y[t] = + 1524.33606731476 + 0.642981455652727X[t] + 278.588595755845M1[t] -642.67177115473M2[t] + 57.6791311614409M3[t] -209.92069689072M4[t] -481.355455121435M5[t] -278.074378354788M6[t] -751.999266684727M7[t] -123.500037172763M8[t] -10.4870991147353M9[t] -173.353327124048M10[t] + 17.7112845633109M11[t] -3.82626082202624t + e[t]

\begin{tabular}{lllllllll}
\hline
Multiple Linear Regression - Estimated Regression Equation \tabularnewline
Y[t] =  +  1524.33606731476 +  0.642981455652727X[t] +  278.588595755845M1[t] -642.67177115473M2[t] +  57.6791311614409M3[t] -209.92069689072M4[t] -481.355455121435M5[t] -278.074378354788M6[t] -751.999266684727M7[t] -123.500037172763M8[t] -10.4870991147353M9[t] -173.353327124048M10[t] +  17.7112845633109M11[t] -3.82626082202624t  + e[t] \tabularnewline
\hline
\end{tabular}
%Source: https://freestatistics.org/blog/index.php?pk=58354&T=1

[TABLE]
[ROW][C]Multiple Linear Regression - Estimated Regression Equation[/C][/ROW]
[ROW][C]Y[t] =  +  1524.33606731476 +  0.642981455652727X[t] +  278.588595755845M1[t] -642.67177115473M2[t] +  57.6791311614409M3[t] -209.92069689072M4[t] -481.355455121435M5[t] -278.074378354788M6[t] -751.999266684727M7[t] -123.500037172763M8[t] -10.4870991147353M9[t] -173.353327124048M10[t] +  17.7112845633109M11[t] -3.82626082202624t  + e[t][/C][/ROW]
[/TABLE]
Source: https://freestatistics.org/blog/index.php?pk=58354&T=1

Globally Unique Identifier (entire table): ba.freestatistics.org/blog/index.php?pk=58354&T=1

As an alternative you can also use a QR Code:  

The GUIDs for individual cells are displayed in the table below:

Multiple Linear Regression - Estimated Regression Equation
Y[t] = + 1524.33606731476 + 0.642981455652727X[t] + 278.588595755845M1[t] -642.67177115473M2[t] + 57.6791311614409M3[t] -209.92069689072M4[t] -481.355455121435M5[t] -278.074378354788M6[t] -751.999266684727M7[t] -123.500037172763M8[t] -10.4870991147353M9[t] -173.353327124048M10[t] + 17.7112845633109M11[t] -3.82626082202624t + e[t]


Multiple Linear Regression - Ordinary Least Squares
VariableParameterS.D.T-STATH0: parameter = 02-tail p-value1-tail p-value
(Intercept)1524.33606731476324.7208024.69432.3e-051.2e-05
X0.6429814556527270.0670459.590300
M1278.588595755845178.5640721.56020.1254310.062715
M2-642.67177115473186.741669-3.44150.0012240.000612
M357.6791311614409186.0113450.31010.7578680.378934
M4-209.92069689072186.613208-1.12490.2663450.133172
M5-481.355455121435185.801943-2.59070.0127170.006359
M6-278.074378354788186.663784-1.48970.1429820.071491
M7-751.999266684727185.299926-4.05830.0001859.3e-05
M8-123.500037172763189.500814-0.65170.5177610.258881
M9-10.4870991147353185.085404-0.05670.9550560.477528
M10-173.353327124048186.395937-0.930.3571090.178555
M1117.7112845633109185.7752730.09530.9244520.462226
t-3.826260822026242.67948-1.4280.1599070.079954

\begin{tabular}{lllllllll}
\hline
Multiple Linear Regression - Ordinary Least Squares \tabularnewline
Variable & Parameter & S.D. & T-STATH0: parameter = 0 & 2-tail p-value & 1-tail p-value \tabularnewline
(Intercept) & 1524.33606731476 & 324.720802 & 4.6943 & 2.3e-05 & 1.2e-05 \tabularnewline
X & 0.642981455652727 & 0.067045 & 9.5903 & 0 & 0 \tabularnewline
M1 & 278.588595755845 & 178.564072 & 1.5602 & 0.125431 & 0.062715 \tabularnewline
M2 & -642.67177115473 & 186.741669 & -3.4415 & 0.001224 & 0.000612 \tabularnewline
M3 & 57.6791311614409 & 186.011345 & 0.3101 & 0.757868 & 0.378934 \tabularnewline
M4 & -209.92069689072 & 186.613208 & -1.1249 & 0.266345 & 0.133172 \tabularnewline
M5 & -481.355455121435 & 185.801943 & -2.5907 & 0.012717 & 0.006359 \tabularnewline
M6 & -278.074378354788 & 186.663784 & -1.4897 & 0.142982 & 0.071491 \tabularnewline
M7 & -751.999266684727 & 185.299926 & -4.0583 & 0.000185 & 9.3e-05 \tabularnewline
M8 & -123.500037172763 & 189.500814 & -0.6517 & 0.517761 & 0.258881 \tabularnewline
M9 & -10.4870991147353 & 185.085404 & -0.0567 & 0.955056 & 0.477528 \tabularnewline
M10 & -173.353327124048 & 186.395937 & -0.93 & 0.357109 & 0.178555 \tabularnewline
M11 & 17.7112845633109 & 185.775273 & 0.0953 & 0.924452 & 0.462226 \tabularnewline
t & -3.82626082202624 & 2.67948 & -1.428 & 0.159907 & 0.079954 \tabularnewline
\hline
\end{tabular}
%Source: https://freestatistics.org/blog/index.php?pk=58354&T=2

[TABLE]
[ROW][C]Multiple Linear Regression - Ordinary Least Squares[/C][/ROW]
[ROW][C]Variable[/C][C]Parameter[/C][C]S.D.[/C][C]T-STATH0: parameter = 0[/C][C]2-tail p-value[/C][C]1-tail p-value[/C][/ROW]
[ROW][C](Intercept)[/C][C]1524.33606731476[/C][C]324.720802[/C][C]4.6943[/C][C]2.3e-05[/C][C]1.2e-05[/C][/ROW]
[ROW][C]X[/C][C]0.642981455652727[/C][C]0.067045[/C][C]9.5903[/C][C]0[/C][C]0[/C][/ROW]
[ROW][C]M1[/C][C]278.588595755845[/C][C]178.564072[/C][C]1.5602[/C][C]0.125431[/C][C]0.062715[/C][/ROW]
[ROW][C]M2[/C][C]-642.67177115473[/C][C]186.741669[/C][C]-3.4415[/C][C]0.001224[/C][C]0.000612[/C][/ROW]
[ROW][C]M3[/C][C]57.6791311614409[/C][C]186.011345[/C][C]0.3101[/C][C]0.757868[/C][C]0.378934[/C][/ROW]
[ROW][C]M4[/C][C]-209.92069689072[/C][C]186.613208[/C][C]-1.1249[/C][C]0.266345[/C][C]0.133172[/C][/ROW]
[ROW][C]M5[/C][C]-481.355455121435[/C][C]185.801943[/C][C]-2.5907[/C][C]0.012717[/C][C]0.006359[/C][/ROW]
[ROW][C]M6[/C][C]-278.074378354788[/C][C]186.663784[/C][C]-1.4897[/C][C]0.142982[/C][C]0.071491[/C][/ROW]
[ROW][C]M7[/C][C]-751.999266684727[/C][C]185.299926[/C][C]-4.0583[/C][C]0.000185[/C][C]9.3e-05[/C][/ROW]
[ROW][C]M8[/C][C]-123.500037172763[/C][C]189.500814[/C][C]-0.6517[/C][C]0.517761[/C][C]0.258881[/C][/ROW]
[ROW][C]M9[/C][C]-10.4870991147353[/C][C]185.085404[/C][C]-0.0567[/C][C]0.955056[/C][C]0.477528[/C][/ROW]
[ROW][C]M10[/C][C]-173.353327124048[/C][C]186.395937[/C][C]-0.93[/C][C]0.357109[/C][C]0.178555[/C][/ROW]
[ROW][C]M11[/C][C]17.7112845633109[/C][C]185.775273[/C][C]0.0953[/C][C]0.924452[/C][C]0.462226[/C][/ROW]
[ROW][C]t[/C][C]-3.82626082202624[/C][C]2.67948[/C][C]-1.428[/C][C]0.159907[/C][C]0.079954[/C][/ROW]
[/TABLE]
Source: https://freestatistics.org/blog/index.php?pk=58354&T=2

Globally Unique Identifier (entire table): ba.freestatistics.org/blog/index.php?pk=58354&T=2

As an alternative you can also use a QR Code:  

The GUIDs for individual cells are displayed in the table below:

Multiple Linear Regression - Ordinary Least Squares
VariableParameterS.D.T-STATH0: parameter = 02-tail p-value1-tail p-value
(Intercept)1524.33606731476324.7208024.69432.3e-051.2e-05
X0.6429814556527270.0670459.590300
M1278.588595755845178.5640721.56020.1254310.062715
M2-642.67177115473186.741669-3.44150.0012240.000612
M357.6791311614409186.0113450.31010.7578680.378934
M4-209.92069689072186.613208-1.12490.2663450.133172
M5-481.355455121435185.801943-2.59070.0127170.006359
M6-278.074378354788186.663784-1.48970.1429820.071491
M7-751.999266684727185.299926-4.05830.0001859.3e-05
M8-123.500037172763189.500814-0.65170.5177610.258881
M9-10.4870991147353185.085404-0.05670.9550560.477528
M10-173.353327124048186.395937-0.930.3571090.178555
M1117.7112845633109185.7752730.09530.9244520.462226
t-3.826260822026242.67948-1.4280.1599070.079954


Multiple Linear Regression - Regression Statistics
Multiple R0.894325528268926
R-squared0.799818150513493
Adjusted R-squared0.744448702783183
F-TEST (value)14.4451169968173
F-TEST (DF numerator)13
F-TEST (DF denominator)47
p-value2.89546164822241e-12
Multiple Linear Regression - Residual Statistics
Residual Standard Deviation292.466566643235
Sum Squared Residuals4020224.55239184

\begin{tabular}{lllllllll}
\hline
Multiple Linear Regression - Regression Statistics \tabularnewline
Multiple R & 0.894325528268926 \tabularnewline
R-squared & 0.799818150513493 \tabularnewline
Adjusted R-squared & 0.744448702783183 \tabularnewline
F-TEST (value) & 14.4451169968173 \tabularnewline
F-TEST (DF numerator) & 13 \tabularnewline
F-TEST (DF denominator) & 47 \tabularnewline
p-value & 2.89546164822241e-12 \tabularnewline
Multiple Linear Regression - Residual Statistics \tabularnewline
Residual Standard Deviation & 292.466566643235 \tabularnewline
Sum Squared Residuals & 4020224.55239184 \tabularnewline
\hline
\end{tabular}
%Source: https://freestatistics.org/blog/index.php?pk=58354&T=3

[TABLE]
[ROW][C]Multiple Linear Regression - Regression Statistics[/C][/ROW]
[ROW][C]Multiple R[/C][C]0.894325528268926[/C][/ROW]
[ROW][C]R-squared[/C][C]0.799818150513493[/C][/ROW]
[ROW][C]Adjusted R-squared[/C][C]0.744448702783183[/C][/ROW]
[ROW][C]F-TEST (value)[/C][C]14.4451169968173[/C][/ROW]
[ROW][C]F-TEST (DF numerator)[/C][C]13[/C][/ROW]
[ROW][C]F-TEST (DF denominator)[/C][C]47[/C][/ROW]
[ROW][C]p-value[/C][C]2.89546164822241e-12[/C][/ROW]
[ROW][C]Multiple Linear Regression - Residual Statistics[/C][/ROW]
[ROW][C]Residual Standard Deviation[/C][C]292.466566643235[/C][/ROW]
[ROW][C]Sum Squared Residuals[/C][C]4020224.55239184[/C][/ROW]
[/TABLE]
Source: https://freestatistics.org/blog/index.php?pk=58354&T=3

Globally Unique Identifier (entire table): ba.freestatistics.org/blog/index.php?pk=58354&T=3

As an alternative you can also use a QR Code:  

The GUIDs for individual cells are displayed in the table below:

Multiple Linear Regression - Regression Statistics
Multiple R0.894325528268926
R-squared0.799818150513493
Adjusted R-squared0.744448702783183
F-TEST (value)14.4451169968173
F-TEST (DF numerator)13
F-TEST (DF denominator)47
p-value2.89546164822241e-12
Multiple Linear Regression - Residual Statistics
Residual Standard Deviation292.466566643235
Sum Squared Residuals4020224.55239184


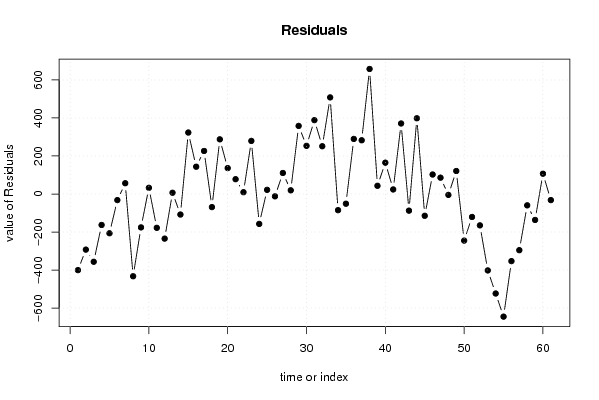
Multiple Linear Regression - Actuals, Interpolation, and Residuals
Time or IndexActualsInterpolationForecastResidualsPrediction Error
13956.24356.68573839844-400.485738398441
23142.73435.26410496306-292.564104963056
33884.34240.77410319034-356.474103190338
43892.24054.99314420909-162.793144209095
536133819.59697540682-206.596975406823
63730.53762.63078683714-32.1307868371358
73481.33424.6638061440756.636193855927
83649.54082.25742536343-432.75742536343
94215.24390.96124828847-175.761248288474
104066.64033.9462485839332.6537514160729
114196.84374.66427291357-177.864272913566
124536.64771.2575681392-234.657568139197
134441.64434.930327620666.66967237933591
143548.33656.31487548575-108.014875485755
154735.94412.50819606447323.391803935527
164130.63987.02375041589143.576249584109
174356.24129.76497568299226.435024317011
184159.64228.46459752683-68.864597526826
1939883700.36800039725287.631999602747
204167.84031.51993458172136.28006541828
214902.24824.324495467777.8755045322973
223909.43900.006957440759.3930425592461
234697.64418.25216167611279.347838323889
244308.94466.15661350127-157.256613501269
254420.44398.4670251544421.9329748455550
263544.23556.45360149218-12.2536014921762
2744334322.35594205125110.644057948750
284479.74460.2518478455919.4481521544112
294533.24174.96031808467358.239681915334
304237.53984.12539044808253.37460955192
314207.43818.86322874334388.536771256659
3243944142.74947247893251.250527521068
335148.44640.23265078362508.167349216384
344202.24287.20413610412-85.0041361041163
354682.54733.49971545193-50.9997154519336
364884.34594.61805440997289.681945590027
375288.95006.20684310669282.693156893307
384505.23847.26785995319657.932140046805
394611.54568.2900949077143.2099050922918
4051044939.2024802306164.797519769405
414586.64562.6075837669823.9924162330158
424529.34158.23851470813371.061485291871
434504.14591.65638636164-87.556386361643
444604.94206.52697894897398.373021051027
454795.44910.08571379036-114.685713790357
465391.15288.5129030614102.587096938601
475213.95127.9625845641785.9374154358281
4854155419.62130622728-4.62130622727842
495990.35869.08170266194121.218297338057
504241.84486.89955810582-245.099558105818
515677.65798.37166378623-120.771663786231
525164.25329.22877729883-165.028777298830
533962.34364.37014705854-402.070147058539
5440114534.44071047983-523.440710479829
553310.33955.54857835369-645.24857835369
563837.34190.44618862694-353.146188626944
574145.34440.89589166985-295.595891669850
583796.73856.32975480980-59.6297548098038
593849.63986.02126539422-136.421265394218
6042854178.14645772228106.853542277719
614189.64221.62836305781-32.0283630578138

\begin{tabular}{lllllllll}
\hline
Multiple Linear Regression - Actuals, Interpolation, and Residuals \tabularnewline
Time or Index & Actuals & InterpolationForecast & ResidualsPrediction Error \tabularnewline
1 & 3956.2 & 4356.68573839844 & -400.485738398441 \tabularnewline
2 & 3142.7 & 3435.26410496306 & -292.564104963056 \tabularnewline
3 & 3884.3 & 4240.77410319034 & -356.474103190338 \tabularnewline
4 & 3892.2 & 4054.99314420909 & -162.793144209095 \tabularnewline
5 & 3613 & 3819.59697540682 & -206.596975406823 \tabularnewline
6 & 3730.5 & 3762.63078683714 & -32.1307868371358 \tabularnewline
7 & 3481.3 & 3424.66380614407 & 56.636193855927 \tabularnewline
8 & 3649.5 & 4082.25742536343 & -432.75742536343 \tabularnewline
9 & 4215.2 & 4390.96124828847 & -175.761248288474 \tabularnewline
10 & 4066.6 & 4033.94624858393 & 32.6537514160729 \tabularnewline
11 & 4196.8 & 4374.66427291357 & -177.864272913566 \tabularnewline
12 & 4536.6 & 4771.2575681392 & -234.657568139197 \tabularnewline
13 & 4441.6 & 4434.93032762066 & 6.66967237933591 \tabularnewline
14 & 3548.3 & 3656.31487548575 & -108.014875485755 \tabularnewline
15 & 4735.9 & 4412.50819606447 & 323.391803935527 \tabularnewline
16 & 4130.6 & 3987.02375041589 & 143.576249584109 \tabularnewline
17 & 4356.2 & 4129.76497568299 & 226.435024317011 \tabularnewline
18 & 4159.6 & 4228.46459752683 & -68.864597526826 \tabularnewline
19 & 3988 & 3700.36800039725 & 287.631999602747 \tabularnewline
20 & 4167.8 & 4031.51993458172 & 136.28006541828 \tabularnewline
21 & 4902.2 & 4824.3244954677 & 77.8755045322973 \tabularnewline
22 & 3909.4 & 3900.00695744075 & 9.3930425592461 \tabularnewline
23 & 4697.6 & 4418.25216167611 & 279.347838323889 \tabularnewline
24 & 4308.9 & 4466.15661350127 & -157.256613501269 \tabularnewline
25 & 4420.4 & 4398.46702515444 & 21.9329748455550 \tabularnewline
26 & 3544.2 & 3556.45360149218 & -12.2536014921762 \tabularnewline
27 & 4433 & 4322.35594205125 & 110.644057948750 \tabularnewline
28 & 4479.7 & 4460.25184784559 & 19.4481521544112 \tabularnewline
29 & 4533.2 & 4174.96031808467 & 358.239681915334 \tabularnewline
30 & 4237.5 & 3984.12539044808 & 253.37460955192 \tabularnewline
31 & 4207.4 & 3818.86322874334 & 388.536771256659 \tabularnewline
32 & 4394 & 4142.74947247893 & 251.250527521068 \tabularnewline
33 & 5148.4 & 4640.23265078362 & 508.167349216384 \tabularnewline
34 & 4202.2 & 4287.20413610412 & -85.0041361041163 \tabularnewline
35 & 4682.5 & 4733.49971545193 & -50.9997154519336 \tabularnewline
36 & 4884.3 & 4594.61805440997 & 289.681945590027 \tabularnewline
37 & 5288.9 & 5006.20684310669 & 282.693156893307 \tabularnewline
38 & 4505.2 & 3847.26785995319 & 657.932140046805 \tabularnewline
39 & 4611.5 & 4568.29009490771 & 43.2099050922918 \tabularnewline
40 & 5104 & 4939.2024802306 & 164.797519769405 \tabularnewline
41 & 4586.6 & 4562.60758376698 & 23.9924162330158 \tabularnewline
42 & 4529.3 & 4158.23851470813 & 371.061485291871 \tabularnewline
43 & 4504.1 & 4591.65638636164 & -87.556386361643 \tabularnewline
44 & 4604.9 & 4206.52697894897 & 398.373021051027 \tabularnewline
45 & 4795.4 & 4910.08571379036 & -114.685713790357 \tabularnewline
46 & 5391.1 & 5288.5129030614 & 102.587096938601 \tabularnewline
47 & 5213.9 & 5127.96258456417 & 85.9374154358281 \tabularnewline
48 & 5415 & 5419.62130622728 & -4.62130622727842 \tabularnewline
49 & 5990.3 & 5869.08170266194 & 121.218297338057 \tabularnewline
50 & 4241.8 & 4486.89955810582 & -245.099558105818 \tabularnewline
51 & 5677.6 & 5798.37166378623 & -120.771663786231 \tabularnewline
52 & 5164.2 & 5329.22877729883 & -165.028777298830 \tabularnewline
53 & 3962.3 & 4364.37014705854 & -402.070147058539 \tabularnewline
54 & 4011 & 4534.44071047983 & -523.440710479829 \tabularnewline
55 & 3310.3 & 3955.54857835369 & -645.24857835369 \tabularnewline
56 & 3837.3 & 4190.44618862694 & -353.146188626944 \tabularnewline
57 & 4145.3 & 4440.89589166985 & -295.595891669850 \tabularnewline
58 & 3796.7 & 3856.32975480980 & -59.6297548098038 \tabularnewline
59 & 3849.6 & 3986.02126539422 & -136.421265394218 \tabularnewline
60 & 4285 & 4178.14645772228 & 106.853542277719 \tabularnewline
61 & 4189.6 & 4221.62836305781 & -32.0283630578138 \tabularnewline
\hline
\end{tabular}
%Source: https://freestatistics.org/blog/index.php?pk=58354&T=4

[TABLE]
[ROW][C]Multiple Linear Regression - Actuals, Interpolation, and Residuals[/C][/ROW]
[ROW][C]Time or Index[/C][C]Actuals[/C][C]InterpolationForecast[/C][C]ResidualsPrediction Error[/C][/ROW]
[ROW][C]1[/C][C]3956.2[/C][C]4356.68573839844[/C][C]-400.485738398441[/C][/ROW]
[ROW][C]2[/C][C]3142.7[/C][C]3435.26410496306[/C][C]-292.564104963056[/C][/ROW]
[ROW][C]3[/C][C]3884.3[/C][C]4240.77410319034[/C][C]-356.474103190338[/C][/ROW]
[ROW][C]4[/C][C]3892.2[/C][C]4054.99314420909[/C][C]-162.793144209095[/C][/ROW]
[ROW][C]5[/C][C]3613[/C][C]3819.59697540682[/C][C]-206.596975406823[/C][/ROW]
[ROW][C]6[/C][C]3730.5[/C][C]3762.63078683714[/C][C]-32.1307868371358[/C][/ROW]
[ROW][C]7[/C][C]3481.3[/C][C]3424.66380614407[/C][C]56.636193855927[/C][/ROW]
[ROW][C]8[/C][C]3649.5[/C][C]4082.25742536343[/C][C]-432.75742536343[/C][/ROW]
[ROW][C]9[/C][C]4215.2[/C][C]4390.96124828847[/C][C]-175.761248288474[/C][/ROW]
[ROW][C]10[/C][C]4066.6[/C][C]4033.94624858393[/C][C]32.6537514160729[/C][/ROW]
[ROW][C]11[/C][C]4196.8[/C][C]4374.66427291357[/C][C]-177.864272913566[/C][/ROW]
[ROW][C]12[/C][C]4536.6[/C][C]4771.2575681392[/C][C]-234.657568139197[/C][/ROW]
[ROW][C]13[/C][C]4441.6[/C][C]4434.93032762066[/C][C]6.66967237933591[/C][/ROW]
[ROW][C]14[/C][C]3548.3[/C][C]3656.31487548575[/C][C]-108.014875485755[/C][/ROW]
[ROW][C]15[/C][C]4735.9[/C][C]4412.50819606447[/C][C]323.391803935527[/C][/ROW]
[ROW][C]16[/C][C]4130.6[/C][C]3987.02375041589[/C][C]143.576249584109[/C][/ROW]
[ROW][C]17[/C][C]4356.2[/C][C]4129.76497568299[/C][C]226.435024317011[/C][/ROW]
[ROW][C]18[/C][C]4159.6[/C][C]4228.46459752683[/C][C]-68.864597526826[/C][/ROW]
[ROW][C]19[/C][C]3988[/C][C]3700.36800039725[/C][C]287.631999602747[/C][/ROW]
[ROW][C]20[/C][C]4167.8[/C][C]4031.51993458172[/C][C]136.28006541828[/C][/ROW]
[ROW][C]21[/C][C]4902.2[/C][C]4824.3244954677[/C][C]77.8755045322973[/C][/ROW]
[ROW][C]22[/C][C]3909.4[/C][C]3900.00695744075[/C][C]9.3930425592461[/C][/ROW]
[ROW][C]23[/C][C]4697.6[/C][C]4418.25216167611[/C][C]279.347838323889[/C][/ROW]
[ROW][C]24[/C][C]4308.9[/C][C]4466.15661350127[/C][C]-157.256613501269[/C][/ROW]
[ROW][C]25[/C][C]4420.4[/C][C]4398.46702515444[/C][C]21.9329748455550[/C][/ROW]
[ROW][C]26[/C][C]3544.2[/C][C]3556.45360149218[/C][C]-12.2536014921762[/C][/ROW]
[ROW][C]27[/C][C]4433[/C][C]4322.35594205125[/C][C]110.644057948750[/C][/ROW]
[ROW][C]28[/C][C]4479.7[/C][C]4460.25184784559[/C][C]19.4481521544112[/C][/ROW]
[ROW][C]29[/C][C]4533.2[/C][C]4174.96031808467[/C][C]358.239681915334[/C][/ROW]
[ROW][C]30[/C][C]4237.5[/C][C]3984.12539044808[/C][C]253.37460955192[/C][/ROW]
[ROW][C]31[/C][C]4207.4[/C][C]3818.86322874334[/C][C]388.536771256659[/C][/ROW]
[ROW][C]32[/C][C]4394[/C][C]4142.74947247893[/C][C]251.250527521068[/C][/ROW]
[ROW][C]33[/C][C]5148.4[/C][C]4640.23265078362[/C][C]508.167349216384[/C][/ROW]
[ROW][C]34[/C][C]4202.2[/C][C]4287.20413610412[/C][C]-85.0041361041163[/C][/ROW]
[ROW][C]35[/C][C]4682.5[/C][C]4733.49971545193[/C][C]-50.9997154519336[/C][/ROW]
[ROW][C]36[/C][C]4884.3[/C][C]4594.61805440997[/C][C]289.681945590027[/C][/ROW]
[ROW][C]37[/C][C]5288.9[/C][C]5006.20684310669[/C][C]282.693156893307[/C][/ROW]
[ROW][C]38[/C][C]4505.2[/C][C]3847.26785995319[/C][C]657.932140046805[/C][/ROW]
[ROW][C]39[/C][C]4611.5[/C][C]4568.29009490771[/C][C]43.2099050922918[/C][/ROW]
[ROW][C]40[/C][C]5104[/C][C]4939.2024802306[/C][C]164.797519769405[/C][/ROW]
[ROW][C]41[/C][C]4586.6[/C][C]4562.60758376698[/C][C]23.9924162330158[/C][/ROW]
[ROW][C]42[/C][C]4529.3[/C][C]4158.23851470813[/C][C]371.061485291871[/C][/ROW]
[ROW][C]43[/C][C]4504.1[/C][C]4591.65638636164[/C][C]-87.556386361643[/C][/ROW]
[ROW][C]44[/C][C]4604.9[/C][C]4206.52697894897[/C][C]398.373021051027[/C][/ROW]
[ROW][C]45[/C][C]4795.4[/C][C]4910.08571379036[/C][C]-114.685713790357[/C][/ROW]
[ROW][C]46[/C][C]5391.1[/C][C]5288.5129030614[/C][C]102.587096938601[/C][/ROW]
[ROW][C]47[/C][C]5213.9[/C][C]5127.96258456417[/C][C]85.9374154358281[/C][/ROW]
[ROW][C]48[/C][C]5415[/C][C]5419.62130622728[/C][C]-4.62130622727842[/C][/ROW]
[ROW][C]49[/C][C]5990.3[/C][C]5869.08170266194[/C][C]121.218297338057[/C][/ROW]
[ROW][C]50[/C][C]4241.8[/C][C]4486.89955810582[/C][C]-245.099558105818[/C][/ROW]
[ROW][C]51[/C][C]5677.6[/C][C]5798.37166378623[/C][C]-120.771663786231[/C][/ROW]
[ROW][C]52[/C][C]5164.2[/C][C]5329.22877729883[/C][C]-165.028777298830[/C][/ROW]
[ROW][C]53[/C][C]3962.3[/C][C]4364.37014705854[/C][C]-402.070147058539[/C][/ROW]
[ROW][C]54[/C][C]4011[/C][C]4534.44071047983[/C][C]-523.440710479829[/C][/ROW]
[ROW][C]55[/C][C]3310.3[/C][C]3955.54857835369[/C][C]-645.24857835369[/C][/ROW]
[ROW][C]56[/C][C]3837.3[/C][C]4190.44618862694[/C][C]-353.146188626944[/C][/ROW]
[ROW][C]57[/C][C]4145.3[/C][C]4440.89589166985[/C][C]-295.595891669850[/C][/ROW]
[ROW][C]58[/C][C]3796.7[/C][C]3856.32975480980[/C][C]-59.6297548098038[/C][/ROW]
[ROW][C]59[/C][C]3849.6[/C][C]3986.02126539422[/C][C]-136.421265394218[/C][/ROW]
[ROW][C]60[/C][C]4285[/C][C]4178.14645772228[/C][C]106.853542277719[/C][/ROW]
[ROW][C]61[/C][C]4189.6[/C][C]4221.62836305781[/C][C]-32.0283630578138[/C][/ROW]
[/TABLE]
Source: https://freestatistics.org/blog/index.php?pk=58354&T=4

Globally Unique Identifier (entire table): ba.freestatistics.org/blog/index.php?pk=58354&T=4

As an alternative you can also use a QR Code:  

The GUIDs for individual cells are displayed in the table below:

Multiple Linear Regression - Actuals, Interpolation, and Residuals
Time or IndexActualsInterpolationForecastResidualsPrediction Error
13956.24356.68573839844-400.485738398441
23142.73435.26410496306-292.564104963056
33884.34240.77410319034-356.474103190338
43892.24054.99314420909-162.793144209095
536133819.59697540682-206.596975406823
63730.53762.63078683714-32.1307868371358
73481.33424.6638061440756.636193855927
83649.54082.25742536343-432.75742536343
94215.24390.96124828847-175.761248288474
104066.64033.9462485839332.6537514160729
114196.84374.66427291357-177.864272913566
124536.64771.2575681392-234.657568139197
134441.64434.930327620666.66967237933591
143548.33656.31487548575-108.014875485755
154735.94412.50819606447323.391803935527
164130.63987.02375041589143.576249584109
174356.24129.76497568299226.435024317011
184159.64228.46459752683-68.864597526826
1939883700.36800039725287.631999602747
204167.84031.51993458172136.28006541828
214902.24824.324495467777.8755045322973
223909.43900.006957440759.3930425592461
234697.64418.25216167611279.347838323889
244308.94466.15661350127-157.256613501269
254420.44398.4670251544421.9329748455550
263544.23556.45360149218-12.2536014921762
2744334322.35594205125110.644057948750
284479.74460.2518478455919.4481521544112
294533.24174.96031808467358.239681915334
304237.53984.12539044808253.37460955192
314207.43818.86322874334388.536771256659
3243944142.74947247893251.250527521068
335148.44640.23265078362508.167349216384
344202.24287.20413610412-85.0041361041163
354682.54733.49971545193-50.9997154519336
364884.34594.61805440997289.681945590027
375288.95006.20684310669282.693156893307
384505.23847.26785995319657.932140046805
394611.54568.2900949077143.2099050922918
4051044939.2024802306164.797519769405
414586.64562.6075837669823.9924162330158
424529.34158.23851470813371.061485291871
434504.14591.65638636164-87.556386361643
444604.94206.52697894897398.373021051027
454795.44910.08571379036-114.685713790357
465391.15288.5129030614102.587096938601
475213.95127.9625845641785.9374154358281
4854155419.62130622728-4.62130622727842
495990.35869.08170266194121.218297338057
504241.84486.89955810582-245.099558105818
515677.65798.37166378623-120.771663786231
525164.25329.22877729883-165.028777298830
533962.34364.37014705854-402.070147058539
5440114534.44071047983-523.440710479829
553310.33955.54857835369-645.24857835369
563837.34190.44618862694-353.146188626944
574145.34440.89589166985-295.595891669850
583796.73856.32975480980-59.6297548098038
593849.63986.02126539422-136.421265394218
6042854178.14645772228106.853542277719
614189.64221.62836305781-32.0283630578138


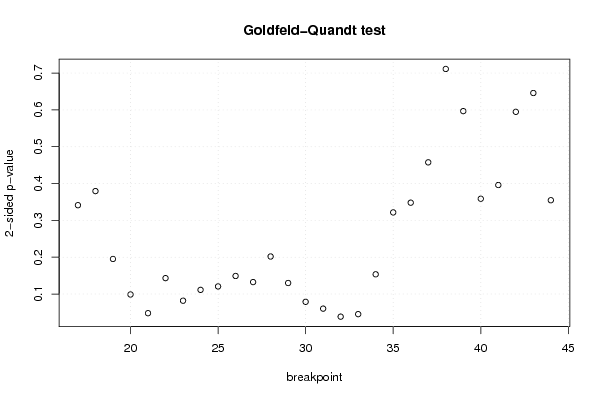
Goldfeld-Quandt test for Heteroskedasticity
p-valuesAlternative Hypothesis
breakpoint indexgreater2-sidedless
170.1706179360350250.341235872070050.829382063964975
180.1897650420614700.3795300841229390.81023495793853
190.09760452521448020.1952090504289600.90239547478552
200.04937550112080020.09875100224160030.9506244988792
210.02399285136866370.04798570273732730.976007148631336
220.07157266360360190.1431453272072040.928427336396398
230.04092636932418360.08185273864836720.959073630675816
240.05564334605737240.1112866921147450.944356653942628
250.06030062682322770.1206012536464550.939699373176772
260.07451422370217680.1490284474043540.925485776297823
270.06622818819009970.1324563763801990.9337718118099
280.1009503816881430.2019007633762860.899049618311857
290.06496324654605110.1299264930921020.935036753453949
300.03940297067947450.0788059413589490.960597029320525
310.03016864300298390.06033728600596780.969831356997016
320.01926941285622130.03853882571244260.980730587143779
330.02266235568536060.04532471137072110.97733764431464
340.07678343465461820.1535668693092360.923216565345382
350.1608197170298690.3216394340597370.839180282970131
360.1740127458805940.3480254917611880.825987254119406
370.2287998858016400.4575997716032810.77120011419836
380.3556164102730660.7112328205461330.644383589726934
390.7016426556979840.5967146886040320.298357344302016
400.8206248737623230.3587502524753530.179375126237677
410.8020254479516480.3959491040967040.197974552048352
420.7026111678776440.5947776642447130.297388832122356
430.6770613309843550.645877338031290.322938669015645
440.8226352155611820.3547295688776370.177364784438818

\begin{tabular}{lllllllll}
\hline
Goldfeld-Quandt test for Heteroskedasticity \tabularnewline
p-values & Alternative Hypothesis \tabularnewline
breakpoint index & greater & 2-sided & less \tabularnewline
17 & 0.170617936035025 & 0.34123587207005 & 0.829382063964975 \tabularnewline
18 & 0.189765042061470 & 0.379530084122939 & 0.81023495793853 \tabularnewline
19 & 0.0976045252144802 & 0.195209050428960 & 0.90239547478552 \tabularnewline
20 & 0.0493755011208002 & 0.0987510022416003 & 0.9506244988792 \tabularnewline
21 & 0.0239928513686637 & 0.0479857027373273 & 0.976007148631336 \tabularnewline
22 & 0.0715726636036019 & 0.143145327207204 & 0.928427336396398 \tabularnewline
23 & 0.0409263693241836 & 0.0818527386483672 & 0.959073630675816 \tabularnewline
24 & 0.0556433460573724 & 0.111286692114745 & 0.944356653942628 \tabularnewline
25 & 0.0603006268232277 & 0.120601253646455 & 0.939699373176772 \tabularnewline
26 & 0.0745142237021768 & 0.149028447404354 & 0.925485776297823 \tabularnewline
27 & 0.0662281881900997 & 0.132456376380199 & 0.9337718118099 \tabularnewline
28 & 0.100950381688143 & 0.201900763376286 & 0.899049618311857 \tabularnewline
29 & 0.0649632465460511 & 0.129926493092102 & 0.935036753453949 \tabularnewline
30 & 0.0394029706794745 & 0.078805941358949 & 0.960597029320525 \tabularnewline
31 & 0.0301686430029839 & 0.0603372860059678 & 0.969831356997016 \tabularnewline
32 & 0.0192694128562213 & 0.0385388257124426 & 0.980730587143779 \tabularnewline
33 & 0.0226623556853606 & 0.0453247113707211 & 0.97733764431464 \tabularnewline
34 & 0.0767834346546182 & 0.153566869309236 & 0.923216565345382 \tabularnewline
35 & 0.160819717029869 & 0.321639434059737 & 0.839180282970131 \tabularnewline
36 & 0.174012745880594 & 0.348025491761188 & 0.825987254119406 \tabularnewline
37 & 0.228799885801640 & 0.457599771603281 & 0.77120011419836 \tabularnewline
38 & 0.355616410273066 & 0.711232820546133 & 0.644383589726934 \tabularnewline
39 & 0.701642655697984 & 0.596714688604032 & 0.298357344302016 \tabularnewline
40 & 0.820624873762323 & 0.358750252475353 & 0.179375126237677 \tabularnewline
41 & 0.802025447951648 & 0.395949104096704 & 0.197974552048352 \tabularnewline
42 & 0.702611167877644 & 0.594777664244713 & 0.297388832122356 \tabularnewline
43 & 0.677061330984355 & 0.64587733803129 & 0.322938669015645 \tabularnewline
44 & 0.822635215561182 & 0.354729568877637 & 0.177364784438818 \tabularnewline
\hline
\end{tabular}
%Source: https://freestatistics.org/blog/index.php?pk=58354&T=5

[TABLE]
[ROW][C]Goldfeld-Quandt test for Heteroskedasticity[/C][/ROW]
[ROW][C]p-values[/C][C]Alternative Hypothesis[/C][/ROW]
[ROW][C]breakpoint index[/C][C]greater[/C][C]2-sided[/C][C]less[/C][/ROW]
[ROW][C]17[/C][C]0.170617936035025[/C][C]0.34123587207005[/C][C]0.829382063964975[/C][/ROW]
[ROW][C]18[/C][C]0.189765042061470[/C][C]0.379530084122939[/C][C]0.81023495793853[/C][/ROW]
[ROW][C]19[/C][C]0.0976045252144802[/C][C]0.195209050428960[/C][C]0.90239547478552[/C][/ROW]
[ROW][C]20[/C][C]0.0493755011208002[/C][C]0.0987510022416003[/C][C]0.9506244988792[/C][/ROW]
[ROW][C]21[/C][C]0.0239928513686637[/C][C]0.0479857027373273[/C][C]0.976007148631336[/C][/ROW]
[ROW][C]22[/C][C]0.0715726636036019[/C][C]0.143145327207204[/C][C]0.928427336396398[/C][/ROW]
[ROW][C]23[/C][C]0.0409263693241836[/C][C]0.0818527386483672[/C][C]0.959073630675816[/C][/ROW]
[ROW][C]24[/C][C]0.0556433460573724[/C][C]0.111286692114745[/C][C]0.944356653942628[/C][/ROW]
[ROW][C]25[/C][C]0.0603006268232277[/C][C]0.120601253646455[/C][C]0.939699373176772[/C][/ROW]
[ROW][C]26[/C][C]0.0745142237021768[/C][C]0.149028447404354[/C][C]0.925485776297823[/C][/ROW]
[ROW][C]27[/C][C]0.0662281881900997[/C][C]0.132456376380199[/C][C]0.9337718118099[/C][/ROW]
[ROW][C]28[/C][C]0.100950381688143[/C][C]0.201900763376286[/C][C]0.899049618311857[/C][/ROW]
[ROW][C]29[/C][C]0.0649632465460511[/C][C]0.129926493092102[/C][C]0.935036753453949[/C][/ROW]
[ROW][C]30[/C][C]0.0394029706794745[/C][C]0.078805941358949[/C][C]0.960597029320525[/C][/ROW]
[ROW][C]31[/C][C]0.0301686430029839[/C][C]0.0603372860059678[/C][C]0.969831356997016[/C][/ROW]
[ROW][C]32[/C][C]0.0192694128562213[/C][C]0.0385388257124426[/C][C]0.980730587143779[/C][/ROW]
[ROW][C]33[/C][C]0.0226623556853606[/C][C]0.0453247113707211[/C][C]0.97733764431464[/C][/ROW]
[ROW][C]34[/C][C]0.0767834346546182[/C][C]0.153566869309236[/C][C]0.923216565345382[/C][/ROW]
[ROW][C]35[/C][C]0.160819717029869[/C][C]0.321639434059737[/C][C]0.839180282970131[/C][/ROW]
[ROW][C]36[/C][C]0.174012745880594[/C][C]0.348025491761188[/C][C]0.825987254119406[/C][/ROW]
[ROW][C]37[/C][C]0.228799885801640[/C][C]0.457599771603281[/C][C]0.77120011419836[/C][/ROW]
[ROW][C]38[/C][C]0.355616410273066[/C][C]0.711232820546133[/C][C]0.644383589726934[/C][/ROW]
[ROW][C]39[/C][C]0.701642655697984[/C][C]0.596714688604032[/C][C]0.298357344302016[/C][/ROW]
[ROW][C]40[/C][C]0.820624873762323[/C][C]0.358750252475353[/C][C]0.179375126237677[/C][/ROW]
[ROW][C]41[/C][C]0.802025447951648[/C][C]0.395949104096704[/C][C]0.197974552048352[/C][/ROW]
[ROW][C]42[/C][C]0.702611167877644[/C][C]0.594777664244713[/C][C]0.297388832122356[/C][/ROW]
[ROW][C]43[/C][C]0.677061330984355[/C][C]0.64587733803129[/C][C]0.322938669015645[/C][/ROW]
[ROW][C]44[/C][C]0.822635215561182[/C][C]0.354729568877637[/C][C]0.177364784438818[/C][/ROW]
[/TABLE]
Source: https://freestatistics.org/blog/index.php?pk=58354&T=5

Globally Unique Identifier (entire table): ba.freestatistics.org/blog/index.php?pk=58354&T=5

As an alternative you can also use a QR Code:  

The GUIDs for individual cells are displayed in the table below:

Goldfeld-Quandt test for Heteroskedasticity
p-valuesAlternative Hypothesis
breakpoint indexgreater2-sidedless
170.1706179360350250.341235872070050.829382063964975
180.1897650420614700.3795300841229390.81023495793853
190.09760452521448020.1952090504289600.90239547478552
200.04937550112080020.09875100224160030.9506244988792
210.02399285136866370.04798570273732730.976007148631336
220.07157266360360190.1431453272072040.928427336396398
230.04092636932418360.08185273864836720.959073630675816
240.05564334605737240.1112866921147450.944356653942628
250.06030062682322770.1206012536464550.939699373176772
260.07451422370217680.1490284474043540.925485776297823
270.06622818819009970.1324563763801990.9337718118099
280.1009503816881430.2019007633762860.899049618311857
290.06496324654605110.1299264930921020.935036753453949
300.03940297067947450.0788059413589490.960597029320525
310.03016864300298390.06033728600596780.969831356997016
320.01926941285622130.03853882571244260.980730587143779
330.02266235568536060.04532471137072110.97733764431464
340.07678343465461820.1535668693092360.923216565345382
350.1608197170298690.3216394340597370.839180282970131
360.1740127458805940.3480254917611880.825987254119406
370.2287998858016400.4575997716032810.77120011419836
380.3556164102730660.7112328205461330.644383589726934
390.7016426556979840.5967146886040320.298357344302016
400.8206248737623230.3587502524753530.179375126237677
410.8020254479516480.3959491040967040.197974552048352
420.7026111678776440.5947776642447130.297388832122356
430.6770613309843550.645877338031290.322938669015645
440.8226352155611820.3547295688776370.177364784438818


Meta Analysis of Goldfeld-Quandt test for Heteroskedasticity
Description# significant tests% significant testsOK/NOK
1% type I error level00OK
5% type I error level30.107142857142857NOK
10% type I error level70.25NOK

\begin{tabular}{lllllllll}
\hline
Meta Analysis of Goldfeld-Quandt test for Heteroskedasticity \tabularnewline
Description & # significant tests & % significant tests & OK/NOK \tabularnewline
1% type I error level & 0 & 0 & OK \tabularnewline
5% type I error level & 3 & 0.107142857142857 & NOK \tabularnewline
10% type I error level & 7 & 0.25 & NOK \tabularnewline
\hline
\end{tabular}
%Source: https://freestatistics.org/blog/index.php?pk=58354&T=6

[TABLE]
[ROW][C]Meta Analysis of Goldfeld-Quandt test for Heteroskedasticity[/C][/ROW]
[ROW][C]Description[/C][C]# significant tests[/C][C]% significant tests[/C][C]OK/NOK[/C][/ROW]
[ROW][C]1% type I error level[/C][C]0[/C][C]0[/C][C]OK[/C][/ROW]
[ROW][C]5% type I error level[/C][C]3[/C][C]0.107142857142857[/C][C]NOK[/C][/ROW]
[ROW][C]10% type I error level[/C][C]7[/C][C]0.25[/C][C]NOK[/C][/ROW]
[/TABLE]
Source: https://freestatistics.org/blog/index.php?pk=58354&T=6

Globally Unique Identifier (entire table): ba.freestatistics.org/blog/index.php?pk=58354&T=6

As an alternative you can also use a QR Code:  

The GUIDs for individual cells are displayed in the table below:

Meta Analysis of Goldfeld-Quandt test for Heteroskedasticity
Description# significant tests% significant testsOK/NOK
1% type I error level00OK
5% type I error level30.107142857142857NOK
10% type I error level70.25NOK


Parameters (Session):
par1 = 1 ; par2 = Include Monthly Dummies ; par3 = Linear Trend ;
Parameters (R input):
par1 = 1 ; par2 = Include Monthly Dummies ; par3 = Linear Trend ;
R code (references can be found in the software module):
library(lattice)
library(lmtest)
n25 <- 25 #minimum number of obs. for Goldfeld-Quandt test
par1 <- as.numeric(par1)
x <- t(y)
k <- length(x[1,])
n <- length(x[,1])
x1 <- cbind(x[,par1], x[,1:k!=par1])
mycolnames <- c(colnames(x)[par1], colnames(x)[1:k!=par1])
colnames(x1) <- mycolnames #colnames(x)[par1]
x <- x1
if (par3 == 'First Differences'){
x2 <- array(0, dim=c(n-1,k), dimnames=list(1:(n-1), paste('(1-B)',colnames(x),sep='')))
for (i in 1:n-1) {
for (j in 1:k) {
x2[i,j] <- x[i+1,j] - x[i,j]
}
}
x <- x2
}
if (par2 == 'Include Monthly Dummies'){
x2 <- array(0, dim=c(n,11), dimnames=list(1:n, paste('M', seq(1:11), sep ='')))
for (i in 1:11){
x2[seq(i,n,12),i] <- 1
}
x <- cbind(x, x2)
}
if (par2 == 'Include Quarterly Dummies'){
x2 <- array(0, dim=c(n,3), dimnames=list(1:n, paste('Q', seq(1:3), sep ='')))
for (i in 1:3){
x2[seq(i,n,4),i] <- 1
}
x <- cbind(x, x2)
}
k <- length(x[1,])
if (par3 == 'Linear Trend'){
x <- cbind(x, c(1:n))
colnames(x)[k+1] <- 't'
}
x
k <- length(x[1,])
df <- as.data.frame(x)
(mylm <- lm(df))
(mysum <- summary(mylm))
if (n > n25) {
kp3 <- k + 3
nmkm3 <- n - k - 3
gqarr <- array(NA, dim=c(nmkm3-kp3+1,3))
numgqtests <- 0
numsignificant1 <- 0
numsignificant5 <- 0
numsignificant10 <- 0
for (mypoint in kp3:nmkm3) {
j <- 0
numgqtests <- numgqtests + 1
for (myalt in c('greater', 'two.sided', 'less')) {
j <- j + 1
gqarr[mypoint-kp3+1,j] <- gqtest(mylm, point=mypoint, alternative=myalt)$p.value
}
if (gqarr[mypoint-kp3+1,2] < 0.01) numsignificant1 <- numsignificant1 + 1
if (gqarr[mypoint-kp3+1,2] < 0.05) numsignificant5 <- numsignificant5 + 1
if (gqarr[mypoint-kp3+1,2] < 0.10) numsignificant10 <- numsignificant10 + 1
}
gqarr
}
bitmap(file='test0.png')
plot(x[,1], type='l', main='Actuals and Interpolation', ylab='value of Actuals and Interpolation (dots)', xlab='time or index')
points(x[,1]-mysum$resid)
grid()
dev.off()
bitmap(file='test1.png')
plot(mysum$resid, type='b', pch=19, main='Residuals', ylab='value of Residuals', xlab='time or index')
grid()
dev.off()
bitmap(file='test2.png')
hist(mysum$resid, main='Residual Histogram', xlab='values of Residuals')
grid()
dev.off()
bitmap(file='test3.png')
densityplot(~mysum$resid,col='black',main='Residual Density Plot', xlab='values of Residuals')
dev.off()
bitmap(file='test4.png')
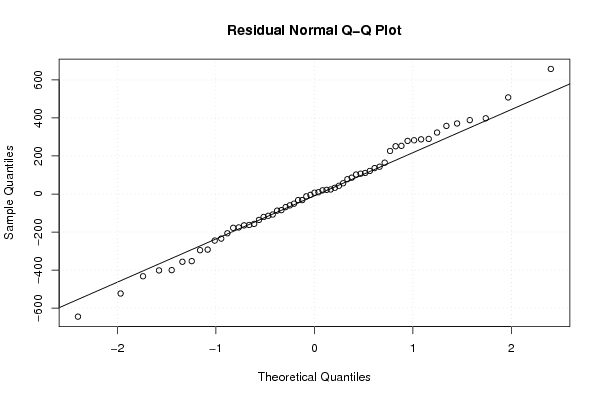
qqnorm(mysum$resid, main='Residual Normal Q-Q Plot')
qqline(mysum$resid)
grid()
dev.off()
(myerror <- as.ts(mysum$resid))
bitmap(file='test5.png')
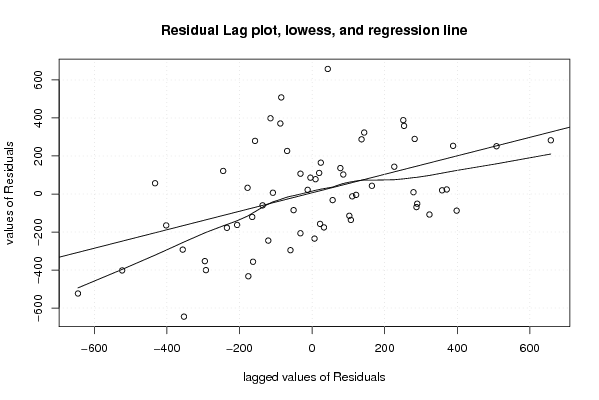
dum <- cbind(lag(myerror,k=1),myerror)
dum
dum1 <- dum[2:length(myerror),]
dum1
z <- as.data.frame(dum1)
z
plot(z,main=paste('Residual Lag plot, lowess, and regression line'), ylab='values of Residuals', xlab='lagged values of Residuals')
lines(lowess(z))
abline(lm(z))
grid()
dev.off()
bitmap(file='test6.png')
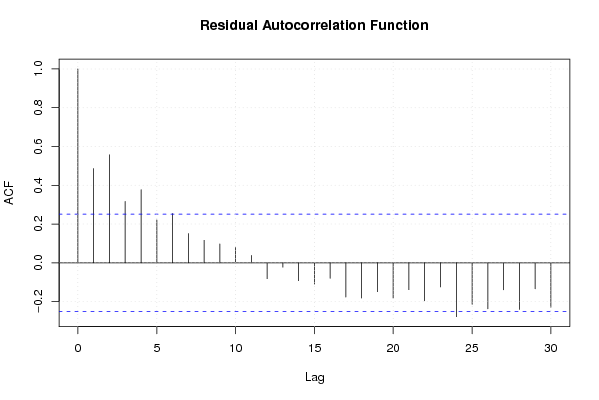
acf(mysum$resid, lag.max=length(mysum$resid)/2, main='Residual Autocorrelation Function')
grid()
dev.off()
bitmap(file='test7.png')
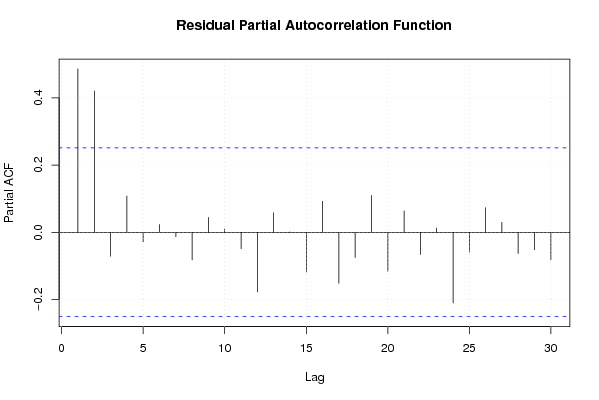
pacf(mysum$resid, lag.max=length(mysum$resid)/2, main='Residual Partial Autocorrelation Function')
grid()
dev.off()
bitmap(file='test8.png')
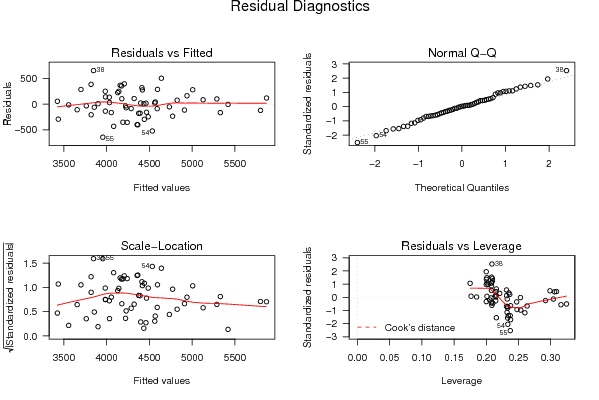
opar <- par(mfrow = c(2,2), oma = c(0, 0, 1.1, 0))
plot(mylm, las = 1, sub='Residual Diagnostics')
par(opar)
dev.off()
if (n > n25) {
bitmap(file='test9.png')
plot(kp3:nmkm3,gqarr[,2], main='Goldfeld-Quandt test',ylab='2-sided p-value',xlab='breakpoint')
grid()
dev.off()
}
load(file='createtable')
a<-table.start()
a<-table.row.start(a)
a<-table.element(a, 'Multiple Linear Regression - Estimated Regression Equation', 1, TRUE)
a<-table.row.end(a)
myeq <- colnames(x)[1]
myeq <- paste(myeq, '[t] = ', sep='')
for (i in 1:k){
if (mysum$coefficients[i,1] > 0) myeq <- paste(myeq, '+', '')
myeq <- paste(myeq, mysum$coefficients[i,1], sep=' ')
if (rownames(mysum$coefficients)[i] != '(Intercept)') {
myeq <- paste(myeq, rownames(mysum$coefficients)[i], sep='')
if (rownames(mysum$coefficients)[i] != 't') myeq <- paste(myeq, '[t]', sep='')
}
}
myeq <- paste(myeq, ' + e[t]')
a<-table.row.start(a)
a<-table.element(a, myeq)
a<-table.row.end(a)
a<-table.end(a)
table.save(a,file='mytable1.tab')
a<-table.start()
a<-table.row.start(a)
a<-table.element(a,hyperlink('ols1.htm','Multiple Linear Regression - Ordinary Least Squares',''), 6, TRUE)
a<-table.row.end(a)
a<-table.row.start(a)
a<-table.element(a,'Variable',header=TRUE)
a<-table.element(a,'Parameter',header=TRUE)
a<-table.element(a,'S.D.',header=TRUE)
a<-table.element(a,'T-STAT
H0: parameter = 0',header=TRUE)
a<-table.element(a,'2-tail p-value',header=TRUE)
a<-table.element(a,'1-tail p-value',header=TRUE)
a<-table.row.end(a)
for (i in 1:k){
a<-table.row.start(a)
a<-table.element(a,rownames(mysum$coefficients)[i],header=TRUE)
a<-table.element(a,mysum$coefficients[i,1])
a<-table.element(a, round(mysum$coefficients[i,2],6))
a<-table.element(a, round(mysum$coefficients[i,3],4))
a<-table.element(a, round(mysum$coefficients[i,4],6))
a<-table.element(a, round(mysum$coefficients[i,4]/2,6))
a<-table.row.end(a)
}
a<-table.end(a)
table.save(a,file='mytable2.tab')
a<-table.start()
a<-table.row.start(a)
a<-table.element(a, 'Multiple Linear Regression - Regression Statistics', 2, TRUE)
a<-table.row.end(a)
a<-table.row.start(a)
a<-table.element(a, 'Multiple R',1,TRUE)
a<-table.element(a, sqrt(mysum$r.squared))
a<-table.row.end(a)
a<-table.row.start(a)
a<-table.element(a, 'R-squared',1,TRUE)
a<-table.element(a, mysum$r.squared)
a<-table.row.end(a)
a<-table.row.start(a)
a<-table.element(a, 'Adjusted R-squared',1,TRUE)
a<-table.element(a, mysum$adj.r.squared)
a<-table.row.end(a)
a<-table.row.start(a)
a<-table.element(a, 'F-TEST (value)',1,TRUE)
a<-table.element(a, mysum$fstatistic[1])
a<-table.row.end(a)
a<-table.row.start(a)
a<-table.element(a, 'F-TEST (DF numerator)',1,TRUE)
a<-table.element(a, mysum$fstatistic[2])
a<-table.row.end(a)
a<-table.row.start(a)
a<-table.element(a, 'F-TEST (DF denominator)',1,TRUE)
a<-table.element(a, mysum$fstatistic[3])
a<-table.row.end(a)
a<-table.row.start(a)
a<-table.element(a, 'p-value',1,TRUE)
a<-table.element(a, 1-pf(mysum$fstatistic[1],mysum$fstatistic[2],mysum$fstatistic[3]))
a<-table.row.end(a)
a<-table.row.start(a)
a<-table.element(a, 'Multiple Linear Regression - Residual Statistics', 2, TRUE)
a<-table.row.end(a)
a<-table.row.start(a)
a<-table.element(a, 'Residual Standard Deviation',1,TRUE)
a<-table.element(a, mysum$sigma)
a<-table.row.end(a)
a<-table.row.start(a)
a<-table.element(a, 'Sum Squared Residuals',1,TRUE)
a<-table.element(a, sum(myerror*myerror))
a<-table.row.end(a)
a<-table.end(a)
table.save(a,file='mytable3.tab')
a<-table.start()
a<-table.row.start(a)
a<-table.element(a, 'Multiple Linear Regression - Actuals, Interpolation, and Residuals', 4, TRUE)
a<-table.row.end(a)
a<-table.row.start(a)
a<-table.element(a, 'Time or Index', 1, TRUE)
a<-table.element(a, 'Actuals', 1, TRUE)
a<-table.element(a, 'Interpolation
Forecast', 1, TRUE)
a<-table.element(a, 'Residuals
Prediction Error', 1, TRUE)
a<-table.row.end(a)
for (i in 1:n) {
a<-table.row.start(a)
a<-table.element(a,i, 1, TRUE)
a<-table.element(a,x[i])
a<-table.element(a,x[i]-mysum$resid[i])
a<-table.element(a,mysum$resid[i])
a<-table.row.end(a)
}
a<-table.end(a)
table.save(a,file='mytable4.tab')
if (n > n25) {
a<-table.start()
a<-table.row.start(a)
a<-table.element(a,'Goldfeld-Quandt test for Heteroskedasticity',4,TRUE)
a<-table.row.end(a)
a<-table.row.start(a)
a<-table.element(a,'p-values',header=TRUE)
a<-table.element(a,'Alternative Hypothesis',3,header=TRUE)
a<-table.row.end(a)
a<-table.row.start(a)
a<-table.element(a,'breakpoint index',header=TRUE)
a<-table.element(a,'greater',header=TRUE)
a<-table.element(a,'2-sided',header=TRUE)
a<-table.element(a,'less',header=TRUE)
a<-table.row.end(a)
for (mypoint in kp3:nmkm3) {
a<-table.row.start(a)
a<-table.element(a,mypoint,header=TRUE)
a<-table.element(a,gqarr[mypoint-kp3+1,1])
a<-table.element(a,gqarr[mypoint-kp3+1,2])
a<-table.element(a,gqarr[mypoint-kp3+1,3])
a<-table.row.end(a)
}
a<-table.end(a)
table.save(a,file='mytable5.tab')
a<-table.start()
a<-table.row.start(a)
a<-table.element(a,'Meta Analysis of Goldfeld-Quandt test for Heteroskedasticity',4,TRUE)
a<-table.row.end(a)
a<-table.row.start(a)
a<-table.element(a,'Description',header=TRUE)
a<-table.element(a,'# significant tests',header=TRUE)
a<-table.element(a,'% significant tests',header=TRUE)
a<-table.element(a,'OK/NOK',header=TRUE)
a<-table.row.end(a)
a<-table.row.start(a)
a<-table.element(a,'1% type I error level',header=TRUE)
a<-table.element(a,numsignificant1)
a<-table.element(a,numsignificant1/numgqtests)
if (numsignificant1/numgqtests < 0.01) dum <- 'OK' else dum <- 'NOK'
a<-table.element(a,dum)
a<-table.row.end(a)
a<-table.row.start(a)
a<-table.element(a,'5% type I error level',header=TRUE)
a<-table.element(a,numsignificant5)
a<-table.element(a,numsignificant5/numgqtests)
if (numsignificant5/numgqtests < 0.05) dum <- 'OK' else dum <- 'NOK'
a<-table.element(a,dum)
a<-table.row.end(a)
a<-table.row.start(a)
a<-table.element(a,'10% type I error level',header=TRUE)
a<-table.element(a,numsignificant10)
a<-table.element(a,numsignificant10/numgqtests)
if (numsignificant10/numgqtests < 0.1) dum <- 'OK' else dum <- 'NOK'
a<-table.element(a,dum)
a<-table.row.end(a)
a<-table.end(a)
table.save(a,file='mytable6.tab')
}