| Multiple Linear Regression - Estimated Regression Equation |
| Y[t] = + 1524.33606731476 + 0.642981455652727X[t] + 278.588595755845M1[t] -642.67177115473M2[t] + 57.6791311614409M3[t] -209.92069689072M4[t] -481.355455121435M5[t] -278.074378354788M6[t] -751.999266684727M7[t] -123.500037172763M8[t] -10.4870991147353M9[t] -173.353327124048M10[t] + 17.7112845633109M11[t] -3.82626082202624t + e[t] |
| Multiple Linear Regression - Ordinary Least Squares | |||||
| Variable | Parameter | S.D. | T-STAT H0: parameter = 0 | 2-tail p-value | 1-tail p-value |
| (Intercept) | 1524.33606731476 | 324.720802 | 4.6943 | 2.3e-05 | 1.2e-05 |
| X | 0.642981455652727 | 0.067045 | 9.5903 | 0 | 0 |
| M1 | 278.588595755845 | 178.564072 | 1.5602 | 0.125431 | 0.062715 |
| M2 | -642.67177115473 | 186.741669 | -3.4415 | 0.001224 | 0.000612 |
| M3 | 57.6791311614409 | 186.011345 | 0.3101 | 0.757868 | 0.378934 |
| M4 | -209.92069689072 | 186.613208 | -1.1249 | 0.266345 | 0.133172 |
| M5 | -481.355455121435 | 185.801943 | -2.5907 | 0.012717 | 0.006359 |
| M6 | -278.074378354788 | 186.663784 | -1.4897 | 0.142982 | 0.071491 |
| M7 | -751.999266684727 | 185.299926 | -4.0583 | 0.000185 | 9.3e-05 |
| M8 | -123.500037172763 | 189.500814 | -0.6517 | 0.517761 | 0.258881 |
| M9 | -10.4870991147353 | 185.085404 | -0.0567 | 0.955056 | 0.477528 |
| M10 | -173.353327124048 | 186.395937 | -0.93 | 0.357109 | 0.178555 |
| M11 | 17.7112845633109 | 185.775273 | 0.0953 | 0.924452 | 0.462226 |
| t | -3.82626082202624 | 2.67948 | -1.428 | 0.159907 | 0.079954 |
| Multiple Linear Regression - Regression Statistics | |
| Multiple R | 0.894325528268926 |
| R-squared | 0.799818150513493 |
| Adjusted R-squared | 0.744448702783183 |
| F-TEST (value) | 14.4451169968173 |
| F-TEST (DF numerator) | 13 |
| F-TEST (DF denominator) | 47 |
| p-value | 2.89546164822241e-12 |
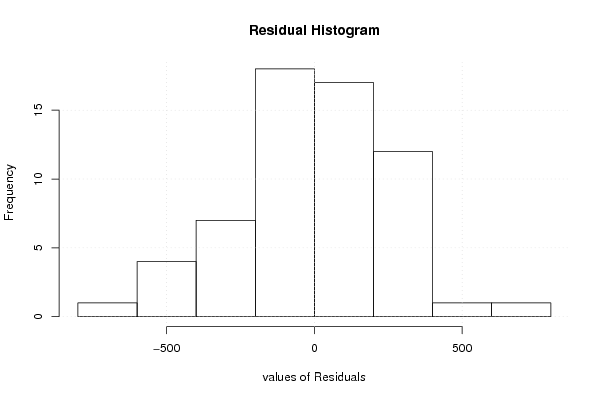
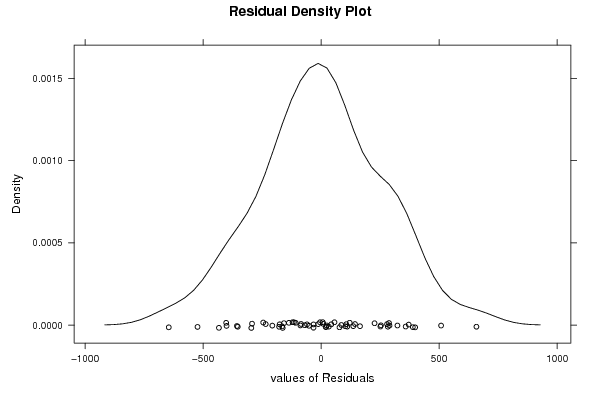
| Multiple Linear Regression - Residual Statistics | |
| Residual Standard Deviation | 292.466566643235 |
| Sum Squared Residuals | 4020224.55239184 |
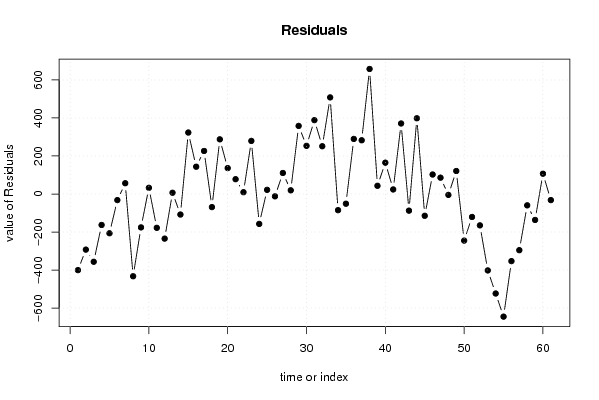
| Multiple Linear Regression - Actuals, Interpolation, and Residuals | |||
| Time or Index | Actuals | Interpolation Forecast | Residuals Prediction Error |
| 1 | 3956.2 | 4356.68573839844 | -400.485738398441 |
| 2 | 3142.7 | 3435.26410496306 | -292.564104963056 |
| 3 | 3884.3 | 4240.77410319034 | -356.474103190338 |
| 4 | 3892.2 | 4054.99314420909 | -162.793144209095 |
| 5 | 3613 | 3819.59697540682 | -206.596975406823 |
| 6 | 3730.5 | 3762.63078683714 | -32.1307868371358 |
| 7 | 3481.3 | 3424.66380614407 | 56.636193855927 |
| 8 | 3649.5 | 4082.25742536343 | -432.75742536343 |
| 9 | 4215.2 | 4390.96124828847 | -175.761248288474 |
| 10 | 4066.6 | 4033.94624858393 | 32.6537514160729 |
| 11 | 4196.8 | 4374.66427291357 | -177.864272913566 |
| 12 | 4536.6 | 4771.2575681392 | -234.657568139197 |
| 13 | 4441.6 | 4434.93032762066 | 6.66967237933591 |
| 14 | 3548.3 | 3656.31487548575 | -108.014875485755 |
| 15 | 4735.9 | 4412.50819606447 | 323.391803935527 |
| 16 | 4130.6 | 3987.02375041589 | 143.576249584109 |
| 17 | 4356.2 | 4129.76497568299 | 226.435024317011 |
| 18 | 4159.6 | 4228.46459752683 | -68.864597526826 |
| 19 | 3988 | 3700.36800039725 | 287.631999602747 |
| 20 | 4167.8 | 4031.51993458172 | 136.28006541828 |
| 21 | 4902.2 | 4824.3244954677 | 77.8755045322973 |
| 22 | 3909.4 | 3900.00695744075 | 9.3930425592461 |
| 23 | 4697.6 | 4418.25216167611 | 279.347838323889 |
| 24 | 4308.9 | 4466.15661350127 | -157.256613501269 |
| 25 | 4420.4 | 4398.46702515444 | 21.9329748455550 |
| 26 | 3544.2 | 3556.45360149218 | -12.2536014921762 |
| 27 | 4433 | 4322.35594205125 | 110.644057948750 |
| 28 | 4479.7 | 4460.25184784559 | 19.4481521544112 |
| 29 | 4533.2 | 4174.96031808467 | 358.239681915334 |
| 30 | 4237.5 | 3984.12539044808 | 253.37460955192 |
| 31 | 4207.4 | 3818.86322874334 | 388.536771256659 |
| 32 | 4394 | 4142.74947247893 | 251.250527521068 |
| 33 | 5148.4 | 4640.23265078362 | 508.167349216384 |
| 34 | 4202.2 | 4287.20413610412 | -85.0041361041163 |
| 35 | 4682.5 | 4733.49971545193 | -50.9997154519336 |
| 36 | 4884.3 | 4594.61805440997 | 289.681945590027 |
| 37 | 5288.9 | 5006.20684310669 | 282.693156893307 |
| 38 | 4505.2 | 3847.26785995319 | 657.932140046805 |
| 39 | 4611.5 | 4568.29009490771 | 43.2099050922918 |
| 40 | 5104 | 4939.2024802306 | 164.797519769405 |
| 41 | 4586.6 | 4562.60758376698 | 23.9924162330158 |
| 42 | 4529.3 | 4158.23851470813 | 371.061485291871 |
| 43 | 4504.1 | 4591.65638636164 | -87.556386361643 |
| 44 | 4604.9 | 4206.52697894897 | 398.373021051027 |
| 45 | 4795.4 | 4910.08571379036 | -114.685713790357 |
| 46 | 5391.1 | 5288.5129030614 | 102.587096938601 |
| 47 | 5213.9 | 5127.96258456417 | 85.9374154358281 |
| 48 | 5415 | 5419.62130622728 | -4.62130622727842 |
| 49 | 5990.3 | 5869.08170266194 | 121.218297338057 |
| 50 | 4241.8 | 4486.89955810582 | -245.099558105818 |
| 51 | 5677.6 | 5798.37166378623 | -120.771663786231 |
| 52 | 5164.2 | 5329.22877729883 | -165.028777298830 |
| 53 | 3962.3 | 4364.37014705854 | -402.070147058539 |
| 54 | 4011 | 4534.44071047983 | -523.440710479829 |
| 55 | 3310.3 | 3955.54857835369 | -645.24857835369 |
| 56 | 3837.3 | 4190.44618862694 | -353.146188626944 |
| 57 | 4145.3 | 4440.89589166985 | -295.595891669850 |
| 58 | 3796.7 | 3856.32975480980 | -59.6297548098038 |
| 59 | 3849.6 | 3986.02126539422 | -136.421265394218 |
| 60 | 4285 | 4178.14645772228 | 106.853542277719 |
| 61 | 4189.6 | 4221.62836305781 | -32.0283630578138 |
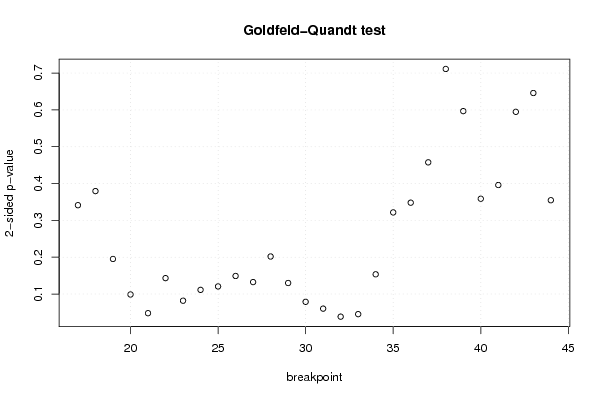
| Goldfeld-Quandt test for Heteroskedasticity | |||
| p-values | Alternative Hypothesis | ||
| breakpoint index | greater | 2-sided | less |
| 17 | 0.170617936035025 | 0.34123587207005 | 0.829382063964975 |
| 18 | 0.189765042061470 | 0.379530084122939 | 0.81023495793853 |
| 19 | 0.0976045252144802 | 0.195209050428960 | 0.90239547478552 |
| 20 | 0.0493755011208002 | 0.0987510022416003 | 0.9506244988792 |
| 21 | 0.0239928513686637 | 0.0479857027373273 | 0.976007148631336 |
| 22 | 0.0715726636036019 | 0.143145327207204 | 0.928427336396398 |
| 23 | 0.0409263693241836 | 0.0818527386483672 | 0.959073630675816 |
| 24 | 0.0556433460573724 | 0.111286692114745 | 0.944356653942628 |
| 25 | 0.0603006268232277 | 0.120601253646455 | 0.939699373176772 |
| 26 | 0.0745142237021768 | 0.149028447404354 | 0.925485776297823 |
| 27 | 0.0662281881900997 | 0.132456376380199 | 0.9337718118099 |
| 28 | 0.100950381688143 | 0.201900763376286 | 0.899049618311857 |
| 29 | 0.0649632465460511 | 0.129926493092102 | 0.935036753453949 |
| 30 | 0.0394029706794745 | 0.078805941358949 | 0.960597029320525 |
| 31 | 0.0301686430029839 | 0.0603372860059678 | 0.969831356997016 |
| 32 | 0.0192694128562213 | 0.0385388257124426 | 0.980730587143779 |
| 33 | 0.0226623556853606 | 0.0453247113707211 | 0.97733764431464 |
| 34 | 0.0767834346546182 | 0.153566869309236 | 0.923216565345382 |
| 35 | 0.160819717029869 | 0.321639434059737 | 0.839180282970131 |
| 36 | 0.174012745880594 | 0.348025491761188 | 0.825987254119406 |
| 37 | 0.228799885801640 | 0.457599771603281 | 0.77120011419836 |
| 38 | 0.355616410273066 | 0.711232820546133 | 0.644383589726934 |
| 39 | 0.701642655697984 | 0.596714688604032 | 0.298357344302016 |
| 40 | 0.820624873762323 | 0.358750252475353 | 0.179375126237677 |
| 41 | 0.802025447951648 | 0.395949104096704 | 0.197974552048352 |
| 42 | 0.702611167877644 | 0.594777664244713 | 0.297388832122356 |
| 43 | 0.677061330984355 | 0.64587733803129 | 0.322938669015645 |
| 44 | 0.822635215561182 | 0.354729568877637 | 0.177364784438818 |
| Meta Analysis of Goldfeld-Quandt test for Heteroskedasticity | |||
| Description | # significant tests | % significant tests | OK/NOK |
| 1% type I error level | 0 | 0 | OK |
| 5% type I error level | 3 | 0.107142857142857 | NOK |
| 10% type I error level | 7 | 0.25 | NOK |