| Multiple Linear Regression - Estimated Regression Equation |
| Broodprijzen[t] = + 1.48357142857143 + 0.144206349206349X[t] + e[t] |
| Multiple Linear Regression - Ordinary Least Squares | |||||
| Variable | Parameter | S.D. | T-STAT H0: parameter = 0 | 2-tail p-value | 1-tail p-value |
| (Intercept) | 1.48357142857143 | 0.005394 | 275.0422 | 0 | 0 |
| X | 0.144206349206349 | 0.009848 | 14.6432 | 0 | 0 |
| Multiple Linear Regression - Regression Statistics | |
| Multiple R | 0.887184293010393 |
| R-squared | 0.78709596976435 |
| Adjusted R-squared | 0.783425210622356 |
| F-TEST (value) | 214.423213105940 |
| F-TEST (DF numerator) | 1 |
| F-TEST (DF denominator) | 58 |
| p-value | 0 |
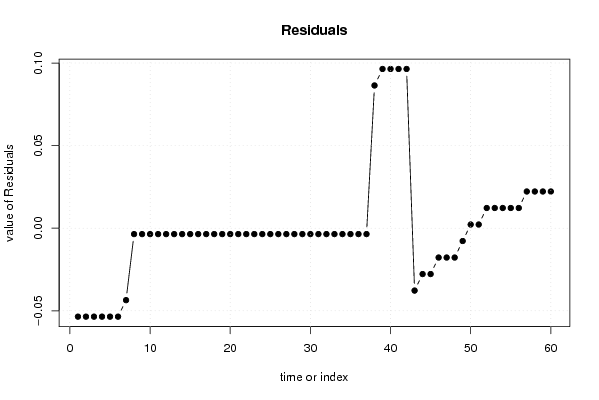
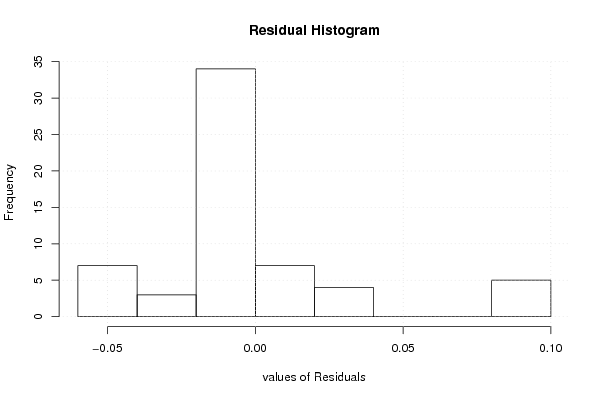
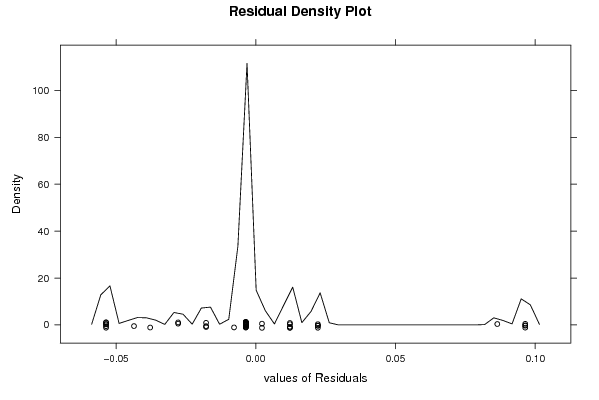
| Multiple Linear Regression - Residual Statistics | |
| Residual Standard Deviation | 0.0349569678381563 |
| Sum Squared Residuals | 0.0708753968253977 |
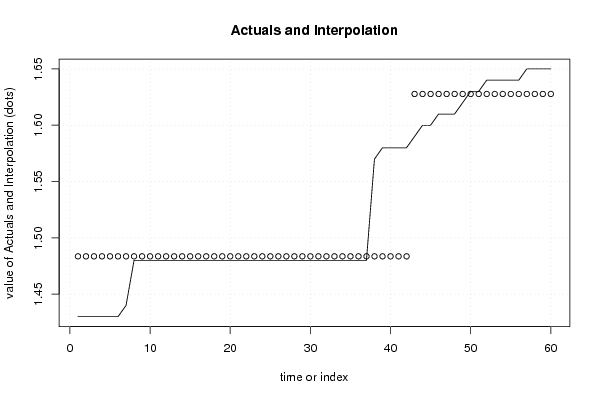
| Multiple Linear Regression - Actuals, Interpolation, and Residuals | |||
| Time or Index | Actuals | Interpolation Forecast | Residuals Prediction Error |
| 1 | 1.43 | 1.48357142857144 | -0.0535714285714358 |
| 2 | 1.43 | 1.48357142857143 | -0.0535714285714285 |
| 3 | 1.43 | 1.48357142857143 | -0.0535714285714284 |
| 4 | 1.43 | 1.48357142857143 | -0.0535714285714284 |
| 5 | 1.43 | 1.48357142857143 | -0.0535714285714284 |
| 6 | 1.43 | 1.48357142857143 | -0.0535714285714284 |
| 7 | 1.44 | 1.48357142857143 | -0.0435714285714284 |
| 8 | 1.48 | 1.48357142857143 | -0.00357142857142839 |
| 9 | 1.48 | 1.48357142857143 | -0.00357142857142839 |
| 10 | 1.48 | 1.48357142857143 | -0.00357142857142839 |
| 11 | 1.48 | 1.48357142857143 | -0.00357142857142839 |
| 12 | 1.48 | 1.48357142857143 | -0.00357142857142839 |
| 13 | 1.48 | 1.48357142857143 | -0.00357142857142839 |
| 14 | 1.48 | 1.48357142857143 | -0.00357142857142839 |
| 15 | 1.48 | 1.48357142857143 | -0.00357142857142839 |
| 16 | 1.48 | 1.48357142857143 | -0.00357142857142839 |
| 17 | 1.48 | 1.48357142857143 | -0.00357142857142839 |
| 18 | 1.48 | 1.48357142857143 | -0.00357142857142839 |
| 19 | 1.48 | 1.48357142857143 | -0.00357142857142839 |
| 20 | 1.48 | 1.48357142857143 | -0.00357142857142839 |
| 21 | 1.48 | 1.48357142857143 | -0.00357142857142839 |
| 22 | 1.48 | 1.48357142857143 | -0.00357142857142839 |
| 23 | 1.48 | 1.48357142857143 | -0.00357142857142839 |
| 24 | 1.48 | 1.48357142857143 | -0.00357142857142839 |
| 25 | 1.48 | 1.48357142857143 | -0.00357142857142839 |
| 26 | 1.48 | 1.48357142857143 | -0.00357142857142839 |
| 27 | 1.48 | 1.48357142857143 | -0.00357142857142839 |
| 28 | 1.48 | 1.48357142857143 | -0.00357142857142839 |
| 29 | 1.48 | 1.48357142857143 | -0.00357142857142839 |
| 30 | 1.48 | 1.48357142857143 | -0.00357142857142839 |
| 31 | 1.48 | 1.48357142857143 | -0.00357142857142839 |
| 32 | 1.48 | 1.48357142857143 | -0.00357142857142839 |
| 33 | 1.48 | 1.48357142857143 | -0.00357142857142839 |
| 34 | 1.48 | 1.48357142857143 | -0.00357142857142839 |
| 35 | 1.48 | 1.48357142857143 | -0.00357142857142839 |
| 36 | 1.48 | 1.48357142857143 | -0.00357142857142839 |
| 37 | 1.48 | 1.48357142857143 | -0.00357142857142839 |
| 38 | 1.57 | 1.48357142857143 | 0.0864285714285717 |
| 39 | 1.58 | 1.48357142857143 | 0.0964285714285717 |
| 40 | 1.58 | 1.48357142857143 | 0.0964285714285717 |
| 41 | 1.58 | 1.48357142857143 | 0.0964285714285717 |
| 42 | 1.58 | 1.48357142857143 | 0.0964285714285717 |
| 43 | 1.59 | 1.62777777777778 | -0.0377777777777777 |
| 44 | 1.6 | 1.62777777777778 | -0.0277777777777777 |
| 45 | 1.6 | 1.62777777777778 | -0.0277777777777777 |
| 46 | 1.61 | 1.62777777777778 | -0.0177777777777777 |
| 47 | 1.61 | 1.62777777777778 | -0.0177777777777777 |
| 48 | 1.61 | 1.62777777777778 | -0.0177777777777777 |
| 49 | 1.62 | 1.62777777777778 | -0.00777777777777766 |
| 50 | 1.63 | 1.62777777777778 | 0.00222222222222213 |
| 51 | 1.63 | 1.62777777777778 | 0.00222222222222213 |
| 52 | 1.64 | 1.62777777777778 | 0.0122222222222221 |
| 53 | 1.64 | 1.62777777777778 | 0.0122222222222221 |
| 54 | 1.64 | 1.62777777777778 | 0.0122222222222221 |
| 55 | 1.64 | 1.62777777777778 | 0.0122222222222221 |
| 56 | 1.64 | 1.62777777777778 | 0.0122222222222221 |
| 57 | 1.65 | 1.62777777777778 | 0.0222222222222221 |
| 58 | 1.65 | 1.62777777777778 | 0.0222222222222221 |
| 59 | 1.65 | 1.62777777777778 | 0.0222222222222221 |
| 60 | 1.65 | 1.62777777777778 | 0.0222222222222221 |
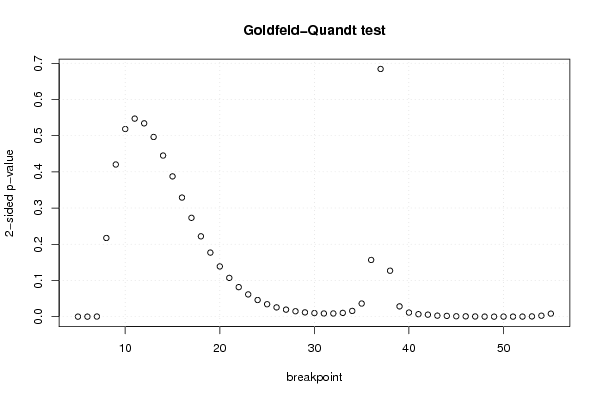
| Goldfeld-Quandt test for Heteroskedasticity | |||
| p-values | Alternative Hypothesis | ||
| breakpoint index | greater | 2-sided | less |
| 5 | 7.14630308801285e-43 | 1.42926061760257e-42 | 1 |
| 6 | 8.27023994676323e-57 | 1.65404798935265e-56 | 1 |
| 7 | 0.000138371836115829 | 0.000276743672231658 | 0.999861628163884 |
| 8 | 0.108680452970389 | 0.217360905940778 | 0.891319547029611 |
| 9 | 0.210152825582720 | 0.420305651165441 | 0.78984717441728 |
| 10 | 0.259157386504413 | 0.518314773008826 | 0.740842613495587 |
| 11 | 0.273529285793125 | 0.547058571586251 | 0.726470714206875 |
| 12 | 0.267016408752022 | 0.534032817504043 | 0.732983591247978 |
| 13 | 0.248175846465299 | 0.496351692930598 | 0.751824153534701 |
| 14 | 0.222512063649534 | 0.445024127299067 | 0.777487936350466 |
| 15 | 0.193753486975310 | 0.387506973950621 | 0.80624651302469 |
| 16 | 0.164492383318729 | 0.328984766637458 | 0.83550761668127 |
| 17 | 0.136508919669979 | 0.273017839339959 | 0.86349108033002 |
| 18 | 0.110955043076622 | 0.221910086153245 | 0.889044956923378 |
| 19 | 0.0884822584137946 | 0.176964516827589 | 0.911517741586205 |
| 20 | 0.0693493983377766 | 0.138698796675553 | 0.930650601662223 |
| 21 | 0.0535222611131611 | 0.107044522226322 | 0.94647773888684 |
| 22 | 0.0407656867445339 | 0.0815313734890678 | 0.959234313255466 |
| 23 | 0.0307245901612458 | 0.0614491803224916 | 0.969275409838754 |
| 24 | 0.0229903738534968 | 0.0459807477069935 | 0.977009626146503 |
| 25 | 0.0171508712479357 | 0.0343017424958713 | 0.982849128752064 |
| 26 | 0.0128241476327695 | 0.0256482952655389 | 0.98717585236723 |
| 27 | 0.0096783268133805 | 0.019356653626761 | 0.99032167318662 |
| 28 | 0.00744083928889499 | 0.0148816785777900 | 0.992559160711105 |
| 29 | 0.00590125851283211 | 0.0118025170256642 | 0.994098741487168 |
| 30 | 0.00491289423840015 | 0.0098257884768003 | 0.9950871057616 |
| 31 | 0.00440153200775632 | 0.00880306401551264 | 0.995598467992244 |
| 32 | 0.00440220136182641 | 0.00880440272365281 | 0.995597798638174 |
| 33 | 0.00519885995647063 | 0.0103977199129413 | 0.99480114004353 |
| 34 | 0.00792863763299 | 0.01585727526598 | 0.99207136236701 |
| 35 | 0.0181055435275036 | 0.0362110870550072 | 0.981894456472496 |
| 36 | 0.0782963631373643 | 0.156592726274729 | 0.921703636862636 |
| 37 | 0.65787132400277 | 0.684257351994461 | 0.342128675997231 |
| 38 | 0.93654406632843 | 0.126911867343139 | 0.0634559336715694 |
| 39 | 0.98577139593951 | 0.0284572081209819 | 0.0142286040604909 |
| 40 | 0.994347269993482 | 0.0113054600130361 | 0.00565273000651803 |
| 41 | 0.996600471885729 | 0.00679905622854223 | 0.00339952811427112 |
| 42 | 0.997247186285895 | 0.00550562742821065 | 0.00275281371410532 |
| 43 | 0.99860448375039 | 0.0027910324992196 | 0.0013955162496098 |
| 44 | 0.998965150267602 | 0.00206969946479526 | 0.00103484973239763 |
| 45 | 0.999480188305885 | 0.00103962338823054 | 0.000519811694115269 |
| 46 | 0.999552704487728 | 0.000894591024544798 | 0.000447295512272399 |
| 47 | 0.999743986939277 | 0.000512026121446937 | 0.000256013060723469 |
| 48 | 0.999949411824568 | 0.000101176350863831 | 5.05881754319154e-05 |
| 49 | 0.999982931680362 | 3.41366392754347e-05 | 1.70683196377174e-05 |
| 50 | 0.999976217574927 | 4.75648501460316e-05 | 2.37824250730158e-05 |
| 51 | 0.999984424078114 | 3.1151843771419e-05 | 1.55759218857095e-05 |
| 52 | 0.999924967424218 | 0.000150065151563575 | 7.50325757817875e-05 |
| 53 | 0.99966621027988 | 0.000667579440240536 | 0.000333789720120268 |
| 54 | 0.998681071054985 | 0.00263785789003034 | 0.00131892894501517 |
| 55 | 0.995879523201662 | 0.00824095359667678 | 0.00412047679833839 |
| Meta Analysis of Goldfeld-Quandt test for Heteroskedasticity | |||
| Description | # significant tests | % significant tests | OK/NOK |
| 1% type I error level | 21 | 0.411764705882353 | NOK |
| 5% type I error level | 32 | 0.627450980392157 | NOK |
| 10% type I error level | 34 | 0.666666666666667 | NOK |