Free Statistics

of Irreproducible Research!

Author's title

Author*The author of this computation has been verified*
R Software Modulerwasp_multipleregression.wasp
Title produced by softwareMultiple Regression
Date of computationFri, 20 Nov 2009 10:39:33 -0700
Cite this page as followsStatistical Computations at FreeStatistics.org, Office for Research Development and Education, URL https://freestatistics.org/blog/index.php?v=date/2009/Nov/20/t1258738920yqif8uavwem0eor.htm/, Retrieved Fri, 19 Apr 2024 08:18:02 +0000
Statistical Computations at FreeStatistics.org, Office for Research Development and Education, URL https://freestatistics.org/blog/index.php?pk=58364, Retrieved Fri, 19 Apr 2024 08:18:02 +0000
QR Codes:

Original text written by user:
IsPrivate?No (this computation is public)
User-defined keywords
Estimated Impact125
Family? (F = Feedback message, R = changed R code, M = changed R Module, P = changed Parameters, D = changed Data)
-     [Multiple Regression] [Q1 The Seatbeltlaw] [2007-11-14 19:27:43] [8cd6641b921d30ebe00b648d1481bba0]
- RMPD  [Multiple Regression] [Seatbelt] [2009-11-12 13:54:52] [b98453cac15ba1066b407e146608df68]
-   PD      [Multiple Regression] [blog 4] [2009-11-20 17:39:33] [9a3898f49d4e2f0208d1968305d88f0a] [Current]
Feedback Forum

Post a new message
Dataseries X:
3613	12266.7	4286.1	3884.3	3142.7	3956.2
3730.5	12919.9	4348.1	3892.2	3884.3	3142.7
3481.3	11497.3	3949.3	3613	3892.2	3884.3
3649.5	12142	4166.7	3730.5	3613	3892.2
4215.2	13919.4	4217.9	3481.3	3730.5	3613
4066.6	12656.8	4528.2	3649.5	3481.3	3730.5
4196.8	12034.1	4232.2	4215.2	3649.5	3481.3
4536.6	13199.7	4470.9	4066.6	4215.2	3649.5
4441.6	10881.3	5121.2	4196.8	4066.6	4215.2
3548.3	11301.2	4170.8	4536.6	4196.8	4066.6
4735.9	13643.9	4398.6	4441.6	4536.6	4196.8
4130.6	12517	4491.4	3548.3	4441.6	4536.6
4356.2	13981.1	4251.8	4735.9	3548.3	4441.6
4159.6	14275.7	4901.9	4130.6	4735.9	3548.3
3988	13435	4745.2	4356.2	4130.6	4735.9
4167.8	13565.7	4666.9	4159.6	4356.2	4130.6
4902.2	16216.3	4210.4	3988	4159.6	4356.2
3909.4	12970	5273.6	4167.8	3988	4159.6
4697.6	14079.9	4095.3	4902.2	4167.8	3988
4308.9	14235	4610.1	3909.4	4902.2	4167.8
4420.4	12213.4	4718.1	4697.6	3909.4	4902.2
3544.2	12581	4185.5	4308.9	4697.6	3909.4
4433	14130.4	4314.7	4420.4	4308.9	4697.6
4479.7	14210.8	4422.6	3544.2	4420.4	4308.9
4533.2	14378.5	5059.2	4433	3544.2	4420.4
4237.5	13142.8	5043.6	4479.7	4433	3544.2
4207.4	13714.7	4436.6	4533.2	4479.7	4433
4394	13621.9	4922.6	4237.5	4533.2	4479.7
5148.4	15379.8	4454.8	4207.4	4237.5	4533.2
4202.2	13306.3	5058.7	4394	4207.4	4237.5
4682.5	14391.2	4768.9	5148.4	4394	4207.4
4884.3	14909.9	5171.8	4202.2	5148.4	4394
5288.9	14025.4	4989.3	4682.5	4202.2	5148.4
4505.2	12951.2	5202.1	4884.3	4682.5	4202.2
4611.5	14344.3	4838.4	5288.9	4884.3	4682.5
5104	16093.4	4876.5	4505.2	5288.9	4884.3
4586.6	15413.6	5875.5	4611.5	4505.2	5288.9
4529.3	14705.7	5717.9	5104	4611.5	4505.2
4504.1	15972.8	4778.8	4586.6	5104	4611.5
4604.9	16241.4	6195.9	4529.3	4586.6	5104
4795.4	16626.4	4625.4	4504.1	4529.3	4586.6
5391.1	17136.2	5549.8	4604.9	4504.1	4529.3
5213.9	15622.9	6397.6	4795.4	4604.9	4504.1
5415	18003.9	5856.7	5391.1	4795.4	4604.9
5990.3	16136.1	6343.8	5213.9	5391.1	4795.4
4241.8	14423.7	6615.5	5415	5213.9	5391.1
5677.6	16789.4	5904.6	5990.3	5415	5213.9
5164.2	16782.2	6861	4241.8	5990.3	5415
3962.3	14133.8	6553.5	5677.6	4241.8	5990.3
4011	12607	5481	5164.2	5677.6	4241.8
3310.3	12004.5	5435.3	3962.3	5164.2	5677.6
3837.3	12175.4	5278	4011	3962.3	5164.2
4145.3	13268	4671.8	3310.3	4011	3962.3
3796.7	12299.3	4891.5	3837.3	3310.3	4011
3849.6	11800.6	4241.6	4145.3	3837.3	3310.3
4285	13873.3	4152.1	3796.7	4145.3	3837.3
4189.6	12269.6	4484.4	3849.6	3796.7	4145.3


Summary of computational transaction
Raw Inputview raw input (R code)
Raw Outputview raw output of R engine
Computing time3 seconds
R Server'Gwilym Jenkins' @ 72.249.127.135
R Framework error message
The field 'Names of X columns' contains a hard return which cannot be interpreted.
Please, resubmit your request without hard returns in the 'Names of X columns'.

\begin{tabular}{lllllllll}
\hline
Summary of computational transaction \tabularnewline
Raw Input & view raw input (R code)  \tabularnewline
Raw Output & view raw output of R engine  \tabularnewline
Computing time & 3 seconds \tabularnewline
R Server & 'Gwilym Jenkins' @ 72.249.127.135 \tabularnewline
R Framework error message & 
The field 'Names of X columns' contains a hard return which cannot be interpreted.
Please, resubmit your request without hard returns in the 'Names of X columns'.
\tabularnewline \hline \end{tabular} %Source: https://freestatistics.org/blog/index.php?pk=58364&T=0

[TABLE]
[ROW][C]Summary of computational transaction[/C][/ROW]
[ROW][C]Raw Input[/C][C]view raw input (R code) [/C][/ROW]
[ROW][C]Raw Output[/C][C]view raw output of R engine [/C][/ROW]
[ROW][C]Computing time[/C][C]3 seconds[/C][/ROW]
[ROW][C]R Server[/C][C]'Gwilym Jenkins' @ 72.249.127.135[/C][/ROW]
[ROW][C]R Framework error message[/C][C]
The field 'Names of X columns' contains a hard return which cannot be interpreted.
Please, resubmit your request without hard returns in the 'Names of X columns'.
[/C][/ROW] [/TABLE] Source: https://freestatistics.org/blog/index.php?pk=58364&T=0

Globally Unique Identifier (entire table): ba.freestatistics.org/blog/index.php?pk=58364&T=0

As an alternative you can also use a QR Code:  

The GUIDs for individual cells are displayed in the table below:

Summary of computational transaction
Raw Inputview raw input (R code)
Raw Outputview raw output of R engine
Computing time3 seconds
R Server'Gwilym Jenkins' @ 72.249.127.135
R Framework error message
The field 'Names of X columns' contains a hard return which cannot be interpreted.
Please, resubmit your request without hard returns in the 'Names of X columns'.


Multiple Linear Regression - Estimated Regression Equation
Y[t] = + 527.153964987183 + 0.240954871069374X[t] + 0.0818613967871051`Yt-1`[t] + 0.219375924876468`Yt-2`[t] + 0.0732409941807161`Yt-3`[t] -0.203227371439877`Yt-4 `[t] -376.320123526623M1[t] -566.548733539981M2[t] -453.392933547681M3[t] -284.226352917444M4[t] -102.796221338208M5[t] -229.174297826116M6[t] -101.477955789942M7[t] -162.031792665541M8[t] + 492.054561282492M9[t] -489.494924058148M10[t] -27.2853312979341M11[t] -2.8468762610436t + e[t]

\begin{tabular}{lllllllll}
\hline
Multiple Linear Regression - Estimated Regression Equation \tabularnewline
Y[t] =  +  527.153964987183 +  0.240954871069374X[t] +  0.0818613967871051`Yt-1`[t] +  0.219375924876468`Yt-2`[t] +  0.0732409941807161`Yt-3`[t] -0.203227371439877`Yt-4
`[t] -376.320123526623M1[t] -566.548733539981M2[t] -453.392933547681M3[t] -284.226352917444M4[t] -102.796221338208M5[t] -229.174297826116M6[t] -101.477955789942M7[t] -162.031792665541M8[t] +  492.054561282492M9[t] -489.494924058148M10[t] -27.2853312979341M11[t] -2.8468762610436t  + e[t] \tabularnewline
\hline
\end{tabular}
%Source: https://freestatistics.org/blog/index.php?pk=58364&T=1

[TABLE]
[ROW][C]Multiple Linear Regression - Estimated Regression Equation[/C][/ROW]
[ROW][C]Y[t] =  +  527.153964987183 +  0.240954871069374X[t] +  0.0818613967871051`Yt-1`[t] +  0.219375924876468`Yt-2`[t] +  0.0732409941807161`Yt-3`[t] -0.203227371439877`Yt-4
`[t] -376.320123526623M1[t] -566.548733539981M2[t] -453.392933547681M3[t] -284.226352917444M4[t] -102.796221338208M5[t] -229.174297826116M6[t] -101.477955789942M7[t] -162.031792665541M8[t] +  492.054561282492M9[t] -489.494924058148M10[t] -27.2853312979341M11[t] -2.8468762610436t  + e[t][/C][/ROW]
[/TABLE]
Source: https://freestatistics.org/blog/index.php?pk=58364&T=1

Globally Unique Identifier (entire table): ba.freestatistics.org/blog/index.php?pk=58364&T=1

As an alternative you can also use a QR Code:  

The GUIDs for individual cells are displayed in the table below:

Multiple Linear Regression - Estimated Regression Equation
Y[t] = + 527.153964987183 + 0.240954871069374X[t] + 0.0818613967871051`Yt-1`[t] + 0.219375924876468`Yt-2`[t] + 0.0732409941807161`Yt-3`[t] -0.203227371439877`Yt-4 `[t] -376.320123526623M1[t] -566.548733539981M2[t] -453.392933547681M3[t] -284.226352917444M4[t] -102.796221338208M5[t] -229.174297826116M6[t] -101.477955789942M7[t] -162.031792665541M8[t] + 492.054561282492M9[t] -489.494924058148M10[t] -27.2853312979341M11[t] -2.8468762610436t + e[t]


Multiple Linear Regression - Ordinary Least Squares
VariableParameterS.D.T-STATH0: parameter = 02-tail p-value1-tail p-value
(Intercept)527.153964987183428.0010271.23170.2254490.112725
X0.2409548710693740.0320747.512500
`Yt-1`0.08186139678710510.0844150.96970.3381480.169074
`Yt-2`0.2193759248764680.1126891.94670.0587940.029397
`Yt-3`0.07324099418071610.1092140.67060.5064140.253207
`Yt-4 `-0.2032273714398770.121176-1.67710.1015160.050758
M1-376.320123526623223.342297-1.68490.0999860.049993
M2-566.548733539981229.555998-2.4680.0180780.009039
M3-453.392933547681163.563729-2.7720.0084970.004249
M4-284.226352917444175.825767-1.61650.1140430.057021
M5-102.796221338208172.235645-0.59680.5540670.277033
M6-229.174297826116207.469621-1.10460.2760950.138047
M7-101.477955789942234.645415-0.43250.6677790.33389
M8-162.031792665541175.801986-0.92170.3623660.181183
M9492.054561282492198.9377442.47340.0178440.008922
M10-489.494924058148222.378604-2.20120.0337090.016854
M11-27.2853312979341202.411735-0.13480.8934620.446731
t-2.84687626104362.323603-1.22520.2278480.113924

\begin{tabular}{lllllllll}
\hline
Multiple Linear Regression - Ordinary Least Squares \tabularnewline
Variable & Parameter & S.D. & T-STATH0: parameter = 0 & 2-tail p-value & 1-tail p-value \tabularnewline
(Intercept) & 527.153964987183 & 428.001027 & 1.2317 & 0.225449 & 0.112725 \tabularnewline
X & 0.240954871069374 & 0.032074 & 7.5125 & 0 & 0 \tabularnewline
`Yt-1` & 0.0818613967871051 & 0.084415 & 0.9697 & 0.338148 & 0.169074 \tabularnewline
`Yt-2` & 0.219375924876468 & 0.112689 & 1.9467 & 0.058794 & 0.029397 \tabularnewline
`Yt-3` & 0.0732409941807161 & 0.109214 & 0.6706 & 0.506414 & 0.253207 \tabularnewline
`Yt-4
` & -0.203227371439877 & 0.121176 & -1.6771 & 0.101516 & 0.050758 \tabularnewline
M1 & -376.320123526623 & 223.342297 & -1.6849 & 0.099986 & 0.049993 \tabularnewline
M2 & -566.548733539981 & 229.555998 & -2.468 & 0.018078 & 0.009039 \tabularnewline
M3 & -453.392933547681 & 163.563729 & -2.772 & 0.008497 & 0.004249 \tabularnewline
M4 & -284.226352917444 & 175.825767 & -1.6165 & 0.114043 & 0.057021 \tabularnewline
M5 & -102.796221338208 & 172.235645 & -0.5968 & 0.554067 & 0.277033 \tabularnewline
M6 & -229.174297826116 & 207.469621 & -1.1046 & 0.276095 & 0.138047 \tabularnewline
M7 & -101.477955789942 & 234.645415 & -0.4325 & 0.667779 & 0.33389 \tabularnewline
M8 & -162.031792665541 & 175.801986 & -0.9217 & 0.362366 & 0.181183 \tabularnewline
M9 & 492.054561282492 & 198.937744 & 2.4734 & 0.017844 & 0.008922 \tabularnewline
M10 & -489.494924058148 & 222.378604 & -2.2012 & 0.033709 & 0.016854 \tabularnewline
M11 & -27.2853312979341 & 202.411735 & -0.1348 & 0.893462 & 0.446731 \tabularnewline
t & -2.8468762610436 & 2.323603 & -1.2252 & 0.227848 & 0.113924 \tabularnewline
\hline
\end{tabular}
%Source: https://freestatistics.org/blog/index.php?pk=58364&T=2

[TABLE]
[ROW][C]Multiple Linear Regression - Ordinary Least Squares[/C][/ROW]
[ROW][C]Variable[/C][C]Parameter[/C][C]S.D.[/C][C]T-STATH0: parameter = 0[/C][C]2-tail p-value[/C][C]1-tail p-value[/C][/ROW]
[ROW][C](Intercept)[/C][C]527.153964987183[/C][C]428.001027[/C][C]1.2317[/C][C]0.225449[/C][C]0.112725[/C][/ROW]
[ROW][C]X[/C][C]0.240954871069374[/C][C]0.032074[/C][C]7.5125[/C][C]0[/C][C]0[/C][/ROW]
[ROW][C]`Yt-1`[/C][C]0.0818613967871051[/C][C]0.084415[/C][C]0.9697[/C][C]0.338148[/C][C]0.169074[/C][/ROW]
[ROW][C]`Yt-2`[/C][C]0.219375924876468[/C][C]0.112689[/C][C]1.9467[/C][C]0.058794[/C][C]0.029397[/C][/ROW]
[ROW][C]`Yt-3`[/C][C]0.0732409941807161[/C][C]0.109214[/C][C]0.6706[/C][C]0.506414[/C][C]0.253207[/C][/ROW]
[ROW][C]`Yt-4
`[/C][C]-0.203227371439877[/C][C]0.121176[/C][C]-1.6771[/C][C]0.101516[/C][C]0.050758[/C][/ROW]
[ROW][C]M1[/C][C]-376.320123526623[/C][C]223.342297[/C][C]-1.6849[/C][C]0.099986[/C][C]0.049993[/C][/ROW]
[ROW][C]M2[/C][C]-566.548733539981[/C][C]229.555998[/C][C]-2.468[/C][C]0.018078[/C][C]0.009039[/C][/ROW]
[ROW][C]M3[/C][C]-453.392933547681[/C][C]163.563729[/C][C]-2.772[/C][C]0.008497[/C][C]0.004249[/C][/ROW]
[ROW][C]M4[/C][C]-284.226352917444[/C][C]175.825767[/C][C]-1.6165[/C][C]0.114043[/C][C]0.057021[/C][/ROW]
[ROW][C]M5[/C][C]-102.796221338208[/C][C]172.235645[/C][C]-0.5968[/C][C]0.554067[/C][C]0.277033[/C][/ROW]
[ROW][C]M6[/C][C]-229.174297826116[/C][C]207.469621[/C][C]-1.1046[/C][C]0.276095[/C][C]0.138047[/C][/ROW]
[ROW][C]M7[/C][C]-101.477955789942[/C][C]234.645415[/C][C]-0.4325[/C][C]0.667779[/C][C]0.33389[/C][/ROW]
[ROW][C]M8[/C][C]-162.031792665541[/C][C]175.801986[/C][C]-0.9217[/C][C]0.362366[/C][C]0.181183[/C][/ROW]
[ROW][C]M9[/C][C]492.054561282492[/C][C]198.937744[/C][C]2.4734[/C][C]0.017844[/C][C]0.008922[/C][/ROW]
[ROW][C]M10[/C][C]-489.494924058148[/C][C]222.378604[/C][C]-2.2012[/C][C]0.033709[/C][C]0.016854[/C][/ROW]
[ROW][C]M11[/C][C]-27.2853312979341[/C][C]202.411735[/C][C]-0.1348[/C][C]0.893462[/C][C]0.446731[/C][/ROW]
[ROW][C]t[/C][C]-2.8468762610436[/C][C]2.323603[/C][C]-1.2252[/C][C]0.227848[/C][C]0.113924[/C][/ROW]
[/TABLE]
Source: https://freestatistics.org/blog/index.php?pk=58364&T=2

Globally Unique Identifier (entire table): ba.freestatistics.org/blog/index.php?pk=58364&T=2

As an alternative you can also use a QR Code:  

The GUIDs for individual cells are displayed in the table below:

Multiple Linear Regression - Ordinary Least Squares
VariableParameterS.D.T-STATH0: parameter = 02-tail p-value1-tail p-value
(Intercept)527.153964987183428.0010271.23170.2254490.112725
X0.2409548710693740.0320747.512500
`Yt-1`0.08186139678710510.0844150.96970.3381480.169074
`Yt-2`0.2193759248764680.1126891.94670.0587940.029397
`Yt-3`0.07324099418071610.1092140.67060.5064140.253207
`Yt-4 `-0.2032273714398770.121176-1.67710.1015160.050758
M1-376.320123526623223.342297-1.68490.0999860.049993
M2-566.548733539981229.555998-2.4680.0180780.009039
M3-453.392933547681163.563729-2.7720.0084970.004249
M4-284.226352917444175.825767-1.61650.1140430.057021
M5-102.796221338208172.235645-0.59680.5540670.277033
M6-229.174297826116207.469621-1.10460.2760950.138047
M7-101.477955789942234.645415-0.43250.6677790.33389
M8-162.031792665541175.801986-0.92170.3623660.181183
M9492.054561282492198.9377442.47340.0178440.008922
M10-489.494924058148222.378604-2.20120.0337090.016854
M11-27.2853312979341202.411735-0.13480.8934620.446731
t-2.84687626104362.323603-1.22520.2278480.113924


Multiple Linear Regression - Regression Statistics
Multiple R0.947855213102673
R-squared0.898429505005913
Adjusted R-squared0.854155186675157
F-TEST (value)20.2923396424559
F-TEST (DF numerator)17
F-TEST (DF denominator)39
p-value2.86437540353290e-14
Multiple Linear Regression - Residual Statistics
Residual Standard Deviation215.815377171798
Sum Squared Residuals1816474.80392841

\begin{tabular}{lllllllll}
\hline
Multiple Linear Regression - Regression Statistics \tabularnewline
Multiple R & 0.947855213102673 \tabularnewline
R-squared & 0.898429505005913 \tabularnewline
Adjusted R-squared & 0.854155186675157 \tabularnewline
F-TEST (value) & 20.2923396424559 \tabularnewline
F-TEST (DF numerator) & 17 \tabularnewline
F-TEST (DF denominator) & 39 \tabularnewline
p-value & 2.86437540353290e-14 \tabularnewline
Multiple Linear Regression - Residual Statistics \tabularnewline
Residual Standard Deviation & 215.815377171798 \tabularnewline
Sum Squared Residuals & 1816474.80392841 \tabularnewline
\hline
\end{tabular}
%Source: https://freestatistics.org/blog/index.php?pk=58364&T=3

[TABLE]
[ROW][C]Multiple Linear Regression - Regression Statistics[/C][/ROW]
[ROW][C]Multiple R[/C][C]0.947855213102673[/C][/ROW]
[ROW][C]R-squared[/C][C]0.898429505005913[/C][/ROW]
[ROW][C]Adjusted R-squared[/C][C]0.854155186675157[/C][/ROW]
[ROW][C]F-TEST (value)[/C][C]20.2923396424559[/C][/ROW]
[ROW][C]F-TEST (DF numerator)[/C][C]17[/C][/ROW]
[ROW][C]F-TEST (DF denominator)[/C][C]39[/C][/ROW]
[ROW][C]p-value[/C][C]2.86437540353290e-14[/C][/ROW]
[ROW][C]Multiple Linear Regression - Residual Statistics[/C][/ROW]
[ROW][C]Residual Standard Deviation[/C][C]215.815377171798[/C][/ROW]
[ROW][C]Sum Squared Residuals[/C][C]1816474.80392841[/C][/ROW]
[/TABLE]
Source: https://freestatistics.org/blog/index.php?pk=58364&T=3

Globally Unique Identifier (entire table): ba.freestatistics.org/blog/index.php?pk=58364&T=3

As an alternative you can also use a QR Code:  

The GUIDs for individual cells are displayed in the table below:

Multiple Linear Regression - Regression Statistics
Multiple R0.947855213102673
R-squared0.898429505005913
Adjusted R-squared0.854155186675157
F-TEST (value)20.2923396424559
F-TEST (DF numerator)17
F-TEST (DF denominator)39
p-value2.86437540353290e-14
Multiple Linear Regression - Residual Statistics
Residual Standard Deviation215.815377171798
Sum Squared Residuals1816474.80392841


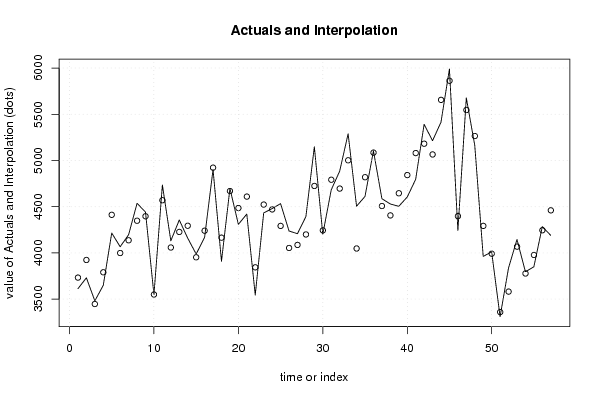
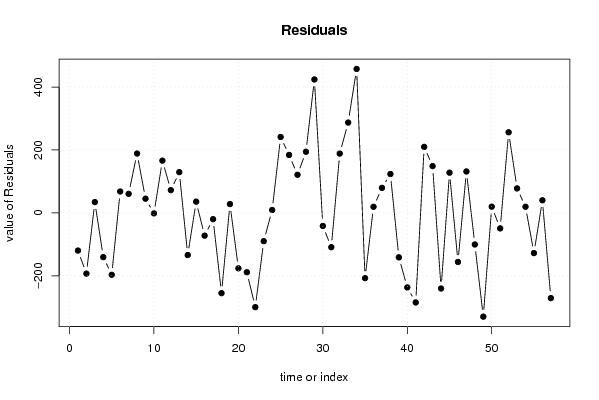
Multiple Linear Regression - Actuals, Interpolation, and Residuals
Time or IndexActualsInterpolationForecastResidualsPrediction Error
136133732.86246543437-119.862465434367
23730.53923.62816530057-193.128165300567
33481.33447.1237913785434.1762086214585
43649.53790.30605815103-140.806058151032
54215.24412.03222326646-196.832223266460
64066.63998.7474003985667.8525996014425
74196.84136.3876513964460.4123486035631
84536.64348.03457548654188.565424513461
94441.64396.5921560770745.0078439229288
103548.33549.85117744227-1.55117744227235
114735.94569.93326978164165.966730218363
124130.64058.4533492777172.1466507222936
134356.24226.86565412097129.334345879032
144159.64293.72933518343-134.129335183434
1539883952.4454264826835.5545735173243
164167.84240.25557452122-72.4555745212196
174902.24922.25190030101-20.0519003010127
183909.44164.68032458006-255.280324580062
194697.64669.6605448429027.9394551571036
204308.94485.22566579919-176.325665799188
214420.44609.14007036491-188.740070364910
223544.23843.94060341878-299.740603418783
2344334523.02311663451-90.0231166345052
244479.74470.610852771779.08914722822901
254533.24292.11266107063241.087338929375
264237.54053.42147700109184.078522998910
274207.44086.37110232052121.028897679482
2843944199.67304744946194.326952550539
295148.44724.40286751344423.997132486556
304202.24243.81941451376-41.6194145137602
314682.54791.63849824442-109.138498244420
324884.34695.96031187812188.339688121877
335288.95001.88640020074287.013599799263
344505.24047.81787133411457.382128665892
354611.54819.01125403667-207.511254036666
3651045084.7199036418519.28009635815
374586.64507.2262170819179.3737829180911
384529.34405.77487312435123.525126875648
394504.14645.4846927837-141.384692783701
404604.94841.97604959047-237.076049590472
414795.45080.18846632577-284.788466325774
425391.15181.38733059569209.712669404312
435213.95065.29701784031148.602982159690
4454155655.4803519969-240.480351996901
455990.35862.58043996156127.719560038441
464241.84397.89034780484-156.090347804836
475677.65546.03235954719131.567640452809
485164.25264.71589430867-100.515894308673
493962.34292.23300229213-329.933002292131
5040113991.3461493905619.653850609443
513310.33359.67498703456-49.3749870345644
523837.33581.28927028782256.010729712184
534145.34067.6245425933177.6754574066904
543796.73777.3655299119319.3344700880675
553849.63977.41628767594-127.816287675937
5642854245.0990948392539.9009051607516
574189.64460.60093339572-271.000933395723

\begin{tabular}{lllllllll}
\hline
Multiple Linear Regression - Actuals, Interpolation, and Residuals \tabularnewline
Time or Index & Actuals & InterpolationForecast & ResidualsPrediction Error \tabularnewline
1 & 3613 & 3732.86246543437 & -119.862465434367 \tabularnewline
2 & 3730.5 & 3923.62816530057 & -193.128165300567 \tabularnewline
3 & 3481.3 & 3447.12379137854 & 34.1762086214585 \tabularnewline
4 & 3649.5 & 3790.30605815103 & -140.806058151032 \tabularnewline
5 & 4215.2 & 4412.03222326646 & -196.832223266460 \tabularnewline
6 & 4066.6 & 3998.74740039856 & 67.8525996014425 \tabularnewline
7 & 4196.8 & 4136.38765139644 & 60.4123486035631 \tabularnewline
8 & 4536.6 & 4348.03457548654 & 188.565424513461 \tabularnewline
9 & 4441.6 & 4396.59215607707 & 45.0078439229288 \tabularnewline
10 & 3548.3 & 3549.85117744227 & -1.55117744227235 \tabularnewline
11 & 4735.9 & 4569.93326978164 & 165.966730218363 \tabularnewline
12 & 4130.6 & 4058.45334927771 & 72.1466507222936 \tabularnewline
13 & 4356.2 & 4226.86565412097 & 129.334345879032 \tabularnewline
14 & 4159.6 & 4293.72933518343 & -134.129335183434 \tabularnewline
15 & 3988 & 3952.44542648268 & 35.5545735173243 \tabularnewline
16 & 4167.8 & 4240.25557452122 & -72.4555745212196 \tabularnewline
17 & 4902.2 & 4922.25190030101 & -20.0519003010127 \tabularnewline
18 & 3909.4 & 4164.68032458006 & -255.280324580062 \tabularnewline
19 & 4697.6 & 4669.66054484290 & 27.9394551571036 \tabularnewline
20 & 4308.9 & 4485.22566579919 & -176.325665799188 \tabularnewline
21 & 4420.4 & 4609.14007036491 & -188.740070364910 \tabularnewline
22 & 3544.2 & 3843.94060341878 & -299.740603418783 \tabularnewline
23 & 4433 & 4523.02311663451 & -90.0231166345052 \tabularnewline
24 & 4479.7 & 4470.61085277177 & 9.08914722822901 \tabularnewline
25 & 4533.2 & 4292.11266107063 & 241.087338929375 \tabularnewline
26 & 4237.5 & 4053.42147700109 & 184.078522998910 \tabularnewline
27 & 4207.4 & 4086.37110232052 & 121.028897679482 \tabularnewline
28 & 4394 & 4199.67304744946 & 194.326952550539 \tabularnewline
29 & 5148.4 & 4724.40286751344 & 423.997132486556 \tabularnewline
30 & 4202.2 & 4243.81941451376 & -41.6194145137602 \tabularnewline
31 & 4682.5 & 4791.63849824442 & -109.138498244420 \tabularnewline
32 & 4884.3 & 4695.96031187812 & 188.339688121877 \tabularnewline
33 & 5288.9 & 5001.88640020074 & 287.013599799263 \tabularnewline
34 & 4505.2 & 4047.81787133411 & 457.382128665892 \tabularnewline
35 & 4611.5 & 4819.01125403667 & -207.511254036666 \tabularnewline
36 & 5104 & 5084.71990364185 & 19.28009635815 \tabularnewline
37 & 4586.6 & 4507.22621708191 & 79.3737829180911 \tabularnewline
38 & 4529.3 & 4405.77487312435 & 123.525126875648 \tabularnewline
39 & 4504.1 & 4645.4846927837 & -141.384692783701 \tabularnewline
40 & 4604.9 & 4841.97604959047 & -237.076049590472 \tabularnewline
41 & 4795.4 & 5080.18846632577 & -284.788466325774 \tabularnewline
42 & 5391.1 & 5181.38733059569 & 209.712669404312 \tabularnewline
43 & 5213.9 & 5065.29701784031 & 148.602982159690 \tabularnewline
44 & 5415 & 5655.4803519969 & -240.480351996901 \tabularnewline
45 & 5990.3 & 5862.58043996156 & 127.719560038441 \tabularnewline
46 & 4241.8 & 4397.89034780484 & -156.090347804836 \tabularnewline
47 & 5677.6 & 5546.03235954719 & 131.567640452809 \tabularnewline
48 & 5164.2 & 5264.71589430867 & -100.515894308673 \tabularnewline
49 & 3962.3 & 4292.23300229213 & -329.933002292131 \tabularnewline
50 & 4011 & 3991.34614939056 & 19.653850609443 \tabularnewline
51 & 3310.3 & 3359.67498703456 & -49.3749870345644 \tabularnewline
52 & 3837.3 & 3581.28927028782 & 256.010729712184 \tabularnewline
53 & 4145.3 & 4067.62454259331 & 77.6754574066904 \tabularnewline
54 & 3796.7 & 3777.36552991193 & 19.3344700880675 \tabularnewline
55 & 3849.6 & 3977.41628767594 & -127.816287675937 \tabularnewline
56 & 4285 & 4245.09909483925 & 39.9009051607516 \tabularnewline
57 & 4189.6 & 4460.60093339572 & -271.000933395723 \tabularnewline
\hline
\end{tabular}
%Source: https://freestatistics.org/blog/index.php?pk=58364&T=4

[TABLE]
[ROW][C]Multiple Linear Regression - Actuals, Interpolation, and Residuals[/C][/ROW]
[ROW][C]Time or Index[/C][C]Actuals[/C][C]InterpolationForecast[/C][C]ResidualsPrediction Error[/C][/ROW]
[ROW][C]1[/C][C]3613[/C][C]3732.86246543437[/C][C]-119.862465434367[/C][/ROW]
[ROW][C]2[/C][C]3730.5[/C][C]3923.62816530057[/C][C]-193.128165300567[/C][/ROW]
[ROW][C]3[/C][C]3481.3[/C][C]3447.12379137854[/C][C]34.1762086214585[/C][/ROW]
[ROW][C]4[/C][C]3649.5[/C][C]3790.30605815103[/C][C]-140.806058151032[/C][/ROW]
[ROW][C]5[/C][C]4215.2[/C][C]4412.03222326646[/C][C]-196.832223266460[/C][/ROW]
[ROW][C]6[/C][C]4066.6[/C][C]3998.74740039856[/C][C]67.8525996014425[/C][/ROW]
[ROW][C]7[/C][C]4196.8[/C][C]4136.38765139644[/C][C]60.4123486035631[/C][/ROW]
[ROW][C]8[/C][C]4536.6[/C][C]4348.03457548654[/C][C]188.565424513461[/C][/ROW]
[ROW][C]9[/C][C]4441.6[/C][C]4396.59215607707[/C][C]45.0078439229288[/C][/ROW]
[ROW][C]10[/C][C]3548.3[/C][C]3549.85117744227[/C][C]-1.55117744227235[/C][/ROW]
[ROW][C]11[/C][C]4735.9[/C][C]4569.93326978164[/C][C]165.966730218363[/C][/ROW]
[ROW][C]12[/C][C]4130.6[/C][C]4058.45334927771[/C][C]72.1466507222936[/C][/ROW]
[ROW][C]13[/C][C]4356.2[/C][C]4226.86565412097[/C][C]129.334345879032[/C][/ROW]
[ROW][C]14[/C][C]4159.6[/C][C]4293.72933518343[/C][C]-134.129335183434[/C][/ROW]
[ROW][C]15[/C][C]3988[/C][C]3952.44542648268[/C][C]35.5545735173243[/C][/ROW]
[ROW][C]16[/C][C]4167.8[/C][C]4240.25557452122[/C][C]-72.4555745212196[/C][/ROW]
[ROW][C]17[/C][C]4902.2[/C][C]4922.25190030101[/C][C]-20.0519003010127[/C][/ROW]
[ROW][C]18[/C][C]3909.4[/C][C]4164.68032458006[/C][C]-255.280324580062[/C][/ROW]
[ROW][C]19[/C][C]4697.6[/C][C]4669.66054484290[/C][C]27.9394551571036[/C][/ROW]
[ROW][C]20[/C][C]4308.9[/C][C]4485.22566579919[/C][C]-176.325665799188[/C][/ROW]
[ROW][C]21[/C][C]4420.4[/C][C]4609.14007036491[/C][C]-188.740070364910[/C][/ROW]
[ROW][C]22[/C][C]3544.2[/C][C]3843.94060341878[/C][C]-299.740603418783[/C][/ROW]
[ROW][C]23[/C][C]4433[/C][C]4523.02311663451[/C][C]-90.0231166345052[/C][/ROW]
[ROW][C]24[/C][C]4479.7[/C][C]4470.61085277177[/C][C]9.08914722822901[/C][/ROW]
[ROW][C]25[/C][C]4533.2[/C][C]4292.11266107063[/C][C]241.087338929375[/C][/ROW]
[ROW][C]26[/C][C]4237.5[/C][C]4053.42147700109[/C][C]184.078522998910[/C][/ROW]
[ROW][C]27[/C][C]4207.4[/C][C]4086.37110232052[/C][C]121.028897679482[/C][/ROW]
[ROW][C]28[/C][C]4394[/C][C]4199.67304744946[/C][C]194.326952550539[/C][/ROW]
[ROW][C]29[/C][C]5148.4[/C][C]4724.40286751344[/C][C]423.997132486556[/C][/ROW]
[ROW][C]30[/C][C]4202.2[/C][C]4243.81941451376[/C][C]-41.6194145137602[/C][/ROW]
[ROW][C]31[/C][C]4682.5[/C][C]4791.63849824442[/C][C]-109.138498244420[/C][/ROW]
[ROW][C]32[/C][C]4884.3[/C][C]4695.96031187812[/C][C]188.339688121877[/C][/ROW]
[ROW][C]33[/C][C]5288.9[/C][C]5001.88640020074[/C][C]287.013599799263[/C][/ROW]
[ROW][C]34[/C][C]4505.2[/C][C]4047.81787133411[/C][C]457.382128665892[/C][/ROW]
[ROW][C]35[/C][C]4611.5[/C][C]4819.01125403667[/C][C]-207.511254036666[/C][/ROW]
[ROW][C]36[/C][C]5104[/C][C]5084.71990364185[/C][C]19.28009635815[/C][/ROW]
[ROW][C]37[/C][C]4586.6[/C][C]4507.22621708191[/C][C]79.3737829180911[/C][/ROW]
[ROW][C]38[/C][C]4529.3[/C][C]4405.77487312435[/C][C]123.525126875648[/C][/ROW]
[ROW][C]39[/C][C]4504.1[/C][C]4645.4846927837[/C][C]-141.384692783701[/C][/ROW]
[ROW][C]40[/C][C]4604.9[/C][C]4841.97604959047[/C][C]-237.076049590472[/C][/ROW]
[ROW][C]41[/C][C]4795.4[/C][C]5080.18846632577[/C][C]-284.788466325774[/C][/ROW]
[ROW][C]42[/C][C]5391.1[/C][C]5181.38733059569[/C][C]209.712669404312[/C][/ROW]
[ROW][C]43[/C][C]5213.9[/C][C]5065.29701784031[/C][C]148.602982159690[/C][/ROW]
[ROW][C]44[/C][C]5415[/C][C]5655.4803519969[/C][C]-240.480351996901[/C][/ROW]
[ROW][C]45[/C][C]5990.3[/C][C]5862.58043996156[/C][C]127.719560038441[/C][/ROW]
[ROW][C]46[/C][C]4241.8[/C][C]4397.89034780484[/C][C]-156.090347804836[/C][/ROW]
[ROW][C]47[/C][C]5677.6[/C][C]5546.03235954719[/C][C]131.567640452809[/C][/ROW]
[ROW][C]48[/C][C]5164.2[/C][C]5264.71589430867[/C][C]-100.515894308673[/C][/ROW]
[ROW][C]49[/C][C]3962.3[/C][C]4292.23300229213[/C][C]-329.933002292131[/C][/ROW]
[ROW][C]50[/C][C]4011[/C][C]3991.34614939056[/C][C]19.653850609443[/C][/ROW]
[ROW][C]51[/C][C]3310.3[/C][C]3359.67498703456[/C][C]-49.3749870345644[/C][/ROW]
[ROW][C]52[/C][C]3837.3[/C][C]3581.28927028782[/C][C]256.010729712184[/C][/ROW]
[ROW][C]53[/C][C]4145.3[/C][C]4067.62454259331[/C][C]77.6754574066904[/C][/ROW]
[ROW][C]54[/C][C]3796.7[/C][C]3777.36552991193[/C][C]19.3344700880675[/C][/ROW]
[ROW][C]55[/C][C]3849.6[/C][C]3977.41628767594[/C][C]-127.816287675937[/C][/ROW]
[ROW][C]56[/C][C]4285[/C][C]4245.09909483925[/C][C]39.9009051607516[/C][/ROW]
[ROW][C]57[/C][C]4189.6[/C][C]4460.60093339572[/C][C]-271.000933395723[/C][/ROW]
[/TABLE]
Source: https://freestatistics.org/blog/index.php?pk=58364&T=4

Globally Unique Identifier (entire table): ba.freestatistics.org/blog/index.php?pk=58364&T=4

As an alternative you can also use a QR Code:  

The GUIDs for individual cells are displayed in the table below:

Multiple Linear Regression - Actuals, Interpolation, and Residuals
Time or IndexActualsInterpolationForecastResidualsPrediction Error
136133732.86246543437-119.862465434367
23730.53923.62816530057-193.128165300567
33481.33447.1237913785434.1762086214585
43649.53790.30605815103-140.806058151032
54215.24412.03222326646-196.832223266460
64066.63998.7474003985667.8525996014425
74196.84136.3876513964460.4123486035631
84536.64348.03457548654188.565424513461
94441.64396.5921560770745.0078439229288
103548.33549.85117744227-1.55117744227235
114735.94569.93326978164165.966730218363
124130.64058.4533492777172.1466507222936
134356.24226.86565412097129.334345879032
144159.64293.72933518343-134.129335183434
1539883952.4454264826835.5545735173243
164167.84240.25557452122-72.4555745212196
174902.24922.25190030101-20.0519003010127
183909.44164.68032458006-255.280324580062
194697.64669.6605448429027.9394551571036
204308.94485.22566579919-176.325665799188
214420.44609.14007036491-188.740070364910
223544.23843.94060341878-299.740603418783
2344334523.02311663451-90.0231166345052
244479.74470.610852771779.08914722822901
254533.24292.11266107063241.087338929375
264237.54053.42147700109184.078522998910
274207.44086.37110232052121.028897679482
2843944199.67304744946194.326952550539
295148.44724.40286751344423.997132486556
304202.24243.81941451376-41.6194145137602
314682.54791.63849824442-109.138498244420
324884.34695.96031187812188.339688121877
335288.95001.88640020074287.013599799263
344505.24047.81787133411457.382128665892
354611.54819.01125403667-207.511254036666
3651045084.7199036418519.28009635815
374586.64507.2262170819179.3737829180911
384529.34405.77487312435123.525126875648
394504.14645.4846927837-141.384692783701
404604.94841.97604959047-237.076049590472
414795.45080.18846632577-284.788466325774
425391.15181.38733059569209.712669404312
435213.95065.29701784031148.602982159690
4454155655.4803519969-240.480351996901
455990.35862.58043996156127.719560038441
464241.84397.89034780484-156.090347804836
475677.65546.03235954719131.567640452809
485164.25264.71589430867-100.515894308673
493962.34292.23300229213-329.933002292131
5040113991.3461493905619.653850609443
513310.33359.67498703456-49.3749870345644
523837.33581.28927028782256.010729712184
534145.34067.6245425933177.6754574066904
543796.73777.3655299119319.3344700880675
553849.63977.41628767594-127.816287675937
5642854245.0990948392539.9009051607516
574189.64460.60093339572-271.000933395723


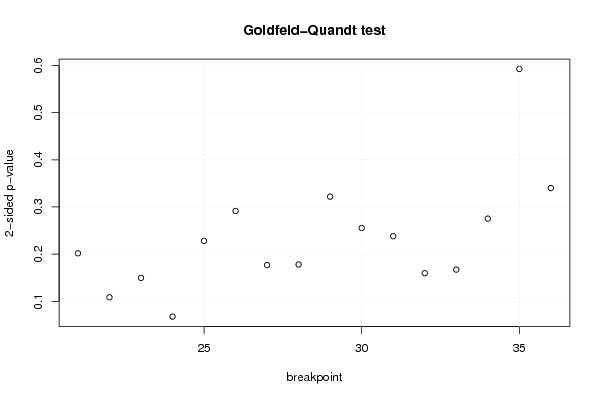
Goldfeld-Quandt test for Heteroskedasticity
p-valuesAlternative Hypothesis
breakpoint indexgreater2-sidedless
210.1009157252451310.2018314504902610.89908427475487
220.05431068229165860.1086213645833170.945689317708341
230.0748278359221450.149655671844290.925172164077855
240.03379219116589020.06758438233178030.96620780883411
250.114068062674760.228136125349520.88593193732524
260.1457694008691190.2915388017382370.854230599130881
270.08843856423298830.1768771284659770.911561435767012
280.08905313138102260.1781062627620450.910946868618977
290.160909551068920.321819102137840.83909044893108
300.1277172305722200.2554344611444410.87228276942778
310.1189983084901310.2379966169802620.881001691509869
320.0797888301473940.1595776602947880.920211169852606
330.08362730781495830.1672546156299170.916372692185042
340.1376513718889140.2753027437778280.862348628111086
350.2962048404678940.5924096809357890.703795159532106
360.1699515340027770.3399030680055540.830048465997223

\begin{tabular}{lllllllll}
\hline
Goldfeld-Quandt test for Heteroskedasticity \tabularnewline
p-values & Alternative Hypothesis \tabularnewline
breakpoint index & greater & 2-sided & less \tabularnewline
21 & 0.100915725245131 & 0.201831450490261 & 0.89908427475487 \tabularnewline
22 & 0.0543106822916586 & 0.108621364583317 & 0.945689317708341 \tabularnewline
23 & 0.074827835922145 & 0.14965567184429 & 0.925172164077855 \tabularnewline
24 & 0.0337921911658902 & 0.0675843823317803 & 0.96620780883411 \tabularnewline
25 & 0.11406806267476 & 0.22813612534952 & 0.88593193732524 \tabularnewline
26 & 0.145769400869119 & 0.291538801738237 & 0.854230599130881 \tabularnewline
27 & 0.0884385642329883 & 0.176877128465977 & 0.911561435767012 \tabularnewline
28 & 0.0890531313810226 & 0.178106262762045 & 0.910946868618977 \tabularnewline
29 & 0.16090955106892 & 0.32181910213784 & 0.83909044893108 \tabularnewline
30 & 0.127717230572220 & 0.255434461144441 & 0.87228276942778 \tabularnewline
31 & 0.118998308490131 & 0.237996616980262 & 0.881001691509869 \tabularnewline
32 & 0.079788830147394 & 0.159577660294788 & 0.920211169852606 \tabularnewline
33 & 0.0836273078149583 & 0.167254615629917 & 0.916372692185042 \tabularnewline
34 & 0.137651371888914 & 0.275302743777828 & 0.862348628111086 \tabularnewline
35 & 0.296204840467894 & 0.592409680935789 & 0.703795159532106 \tabularnewline
36 & 0.169951534002777 & 0.339903068005554 & 0.830048465997223 \tabularnewline
\hline
\end{tabular}
%Source: https://freestatistics.org/blog/index.php?pk=58364&T=5

[TABLE]
[ROW][C]Goldfeld-Quandt test for Heteroskedasticity[/C][/ROW]
[ROW][C]p-values[/C][C]Alternative Hypothesis[/C][/ROW]
[ROW][C]breakpoint index[/C][C]greater[/C][C]2-sided[/C][C]less[/C][/ROW]
[ROW][C]21[/C][C]0.100915725245131[/C][C]0.201831450490261[/C][C]0.89908427475487[/C][/ROW]
[ROW][C]22[/C][C]0.0543106822916586[/C][C]0.108621364583317[/C][C]0.945689317708341[/C][/ROW]
[ROW][C]23[/C][C]0.074827835922145[/C][C]0.14965567184429[/C][C]0.925172164077855[/C][/ROW]
[ROW][C]24[/C][C]0.0337921911658902[/C][C]0.0675843823317803[/C][C]0.96620780883411[/C][/ROW]
[ROW][C]25[/C][C]0.11406806267476[/C][C]0.22813612534952[/C][C]0.88593193732524[/C][/ROW]
[ROW][C]26[/C][C]0.145769400869119[/C][C]0.291538801738237[/C][C]0.854230599130881[/C][/ROW]
[ROW][C]27[/C][C]0.0884385642329883[/C][C]0.176877128465977[/C][C]0.911561435767012[/C][/ROW]
[ROW][C]28[/C][C]0.0890531313810226[/C][C]0.178106262762045[/C][C]0.910946868618977[/C][/ROW]
[ROW][C]29[/C][C]0.16090955106892[/C][C]0.32181910213784[/C][C]0.83909044893108[/C][/ROW]
[ROW][C]30[/C][C]0.127717230572220[/C][C]0.255434461144441[/C][C]0.87228276942778[/C][/ROW]
[ROW][C]31[/C][C]0.118998308490131[/C][C]0.237996616980262[/C][C]0.881001691509869[/C][/ROW]
[ROW][C]32[/C][C]0.079788830147394[/C][C]0.159577660294788[/C][C]0.920211169852606[/C][/ROW]
[ROW][C]33[/C][C]0.0836273078149583[/C][C]0.167254615629917[/C][C]0.916372692185042[/C][/ROW]
[ROW][C]34[/C][C]0.137651371888914[/C][C]0.275302743777828[/C][C]0.862348628111086[/C][/ROW]
[ROW][C]35[/C][C]0.296204840467894[/C][C]0.592409680935789[/C][C]0.703795159532106[/C][/ROW]
[ROW][C]36[/C][C]0.169951534002777[/C][C]0.339903068005554[/C][C]0.830048465997223[/C][/ROW]
[/TABLE]
Source: https://freestatistics.org/blog/index.php?pk=58364&T=5

Globally Unique Identifier (entire table): ba.freestatistics.org/blog/index.php?pk=58364&T=5

As an alternative you can also use a QR Code:  

The GUIDs for individual cells are displayed in the table below:

Goldfeld-Quandt test for Heteroskedasticity
p-valuesAlternative Hypothesis
breakpoint indexgreater2-sidedless
210.1009157252451310.2018314504902610.89908427475487
220.05431068229165860.1086213645833170.945689317708341
230.0748278359221450.149655671844290.925172164077855
240.03379219116589020.06758438233178030.96620780883411
250.114068062674760.228136125349520.88593193732524
260.1457694008691190.2915388017382370.854230599130881
270.08843856423298830.1768771284659770.911561435767012
280.08905313138102260.1781062627620450.910946868618977
290.160909551068920.321819102137840.83909044893108
300.1277172305722200.2554344611444410.87228276942778
310.1189983084901310.2379966169802620.881001691509869
320.0797888301473940.1595776602947880.920211169852606
330.08362730781495830.1672546156299170.916372692185042
340.1376513718889140.2753027437778280.862348628111086
350.2962048404678940.5924096809357890.703795159532106
360.1699515340027770.3399030680055540.830048465997223


Meta Analysis of Goldfeld-Quandt test for Heteroskedasticity
Description# significant tests% significant testsOK/NOK
1% type I error level00OK
5% type I error level00OK
10% type I error level10.0625OK

\begin{tabular}{lllllllll}
\hline
Meta Analysis of Goldfeld-Quandt test for Heteroskedasticity \tabularnewline
Description & # significant tests & % significant tests & OK/NOK \tabularnewline
1% type I error level & 0 & 0 & OK \tabularnewline
5% type I error level & 0 & 0 & OK \tabularnewline
10% type I error level & 1 & 0.0625 & OK \tabularnewline
\hline
\end{tabular}
%Source: https://freestatistics.org/blog/index.php?pk=58364&T=6

[TABLE]
[ROW][C]Meta Analysis of Goldfeld-Quandt test for Heteroskedasticity[/C][/ROW]
[ROW][C]Description[/C][C]# significant tests[/C][C]% significant tests[/C][C]OK/NOK[/C][/ROW]
[ROW][C]1% type I error level[/C][C]0[/C][C]0[/C][C]OK[/C][/ROW]
[ROW][C]5% type I error level[/C][C]0[/C][C]0[/C][C]OK[/C][/ROW]
[ROW][C]10% type I error level[/C][C]1[/C][C]0.0625[/C][C]OK[/C][/ROW]
[/TABLE]
Source: https://freestatistics.org/blog/index.php?pk=58364&T=6

Globally Unique Identifier (entire table): ba.freestatistics.org/blog/index.php?pk=58364&T=6

As an alternative you can also use a QR Code:  

The GUIDs for individual cells are displayed in the table below:

Meta Analysis of Goldfeld-Quandt test for Heteroskedasticity
Description# significant tests% significant testsOK/NOK
1% type I error level00OK
5% type I error level00OK
10% type I error level10.0625OK


Parameters (Session):
par1 = 1 ; par2 = Include Monthly Dummies ; par3 = Linear Trend ;
Parameters (R input):
par1 = 1 ; par2 = Include Monthly Dummies ; par3 = Linear Trend ;
R code (references can be found in the software module):
library(lattice)
library(lmtest)
n25 <- 25 #minimum number of obs. for Goldfeld-Quandt test
par1 <- as.numeric(par1)
x <- t(y)
k <- length(x[1,])
n <- length(x[,1])
x1 <- cbind(x[,par1], x[,1:k!=par1])
mycolnames <- c(colnames(x)[par1], colnames(x)[1:k!=par1])
colnames(x1) <- mycolnames #colnames(x)[par1]
x <- x1
if (par3 == 'First Differences'){
x2 <- array(0, dim=c(n-1,k), dimnames=list(1:(n-1), paste('(1-B)',colnames(x),sep='')))
for (i in 1:n-1) {
for (j in 1:k) {
x2[i,j] <- x[i+1,j] - x[i,j]
}
}
x <- x2
}
if (par2 == 'Include Monthly Dummies'){
x2 <- array(0, dim=c(n,11), dimnames=list(1:n, paste('M', seq(1:11), sep ='')))
for (i in 1:11){
x2[seq(i,n,12),i] <- 1
}
x <- cbind(x, x2)
}
if (par2 == 'Include Quarterly Dummies'){
x2 <- array(0, dim=c(n,3), dimnames=list(1:n, paste('Q', seq(1:3), sep ='')))
for (i in 1:3){
x2[seq(i,n,4),i] <- 1
}
x <- cbind(x, x2)
}
k <- length(x[1,])
if (par3 == 'Linear Trend'){
x <- cbind(x, c(1:n))
colnames(x)[k+1] <- 't'
}
x
k <- length(x[1,])
df <- as.data.frame(x)
(mylm <- lm(df))
(mysum <- summary(mylm))
if (n > n25) {
kp3 <- k + 3
nmkm3 <- n - k - 3
gqarr <- array(NA, dim=c(nmkm3-kp3+1,3))
numgqtests <- 0
numsignificant1 <- 0
numsignificant5 <- 0
numsignificant10 <- 0
for (mypoint in kp3:nmkm3) {
j <- 0
numgqtests <- numgqtests + 1
for (myalt in c('greater', 'two.sided', 'less')) {
j <- j + 1
gqarr[mypoint-kp3+1,j] <- gqtest(mylm, point=mypoint, alternative=myalt)$p.value
}
if (gqarr[mypoint-kp3+1,2] < 0.01) numsignificant1 <- numsignificant1 + 1
if (gqarr[mypoint-kp3+1,2] < 0.05) numsignificant5 <- numsignificant5 + 1
if (gqarr[mypoint-kp3+1,2] < 0.10) numsignificant10 <- numsignificant10 + 1
}
gqarr
}
bitmap(file='test0.png')
plot(x[,1], type='l', main='Actuals and Interpolation', ylab='value of Actuals and Interpolation (dots)', xlab='time or index')
points(x[,1]-mysum$resid)
grid()
dev.off()
bitmap(file='test1.png')
plot(mysum$resid, type='b', pch=19, main='Residuals', ylab='value of Residuals', xlab='time or index')
grid()
dev.off()
bitmap(file='test2.png')
hist(mysum$resid, main='Residual Histogram', xlab='values of Residuals')
grid()
dev.off()
bitmap(file='test3.png')
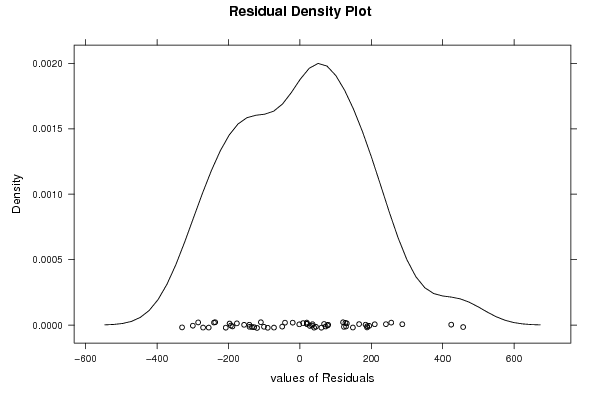
densityplot(~mysum$resid,col='black',main='Residual Density Plot', xlab='values of Residuals')
dev.off()
bitmap(file='test4.png')
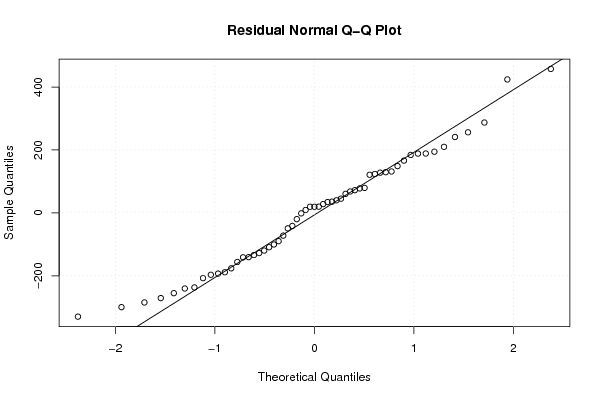
qqnorm(mysum$resid, main='Residual Normal Q-Q Plot')
qqline(mysum$resid)
grid()
dev.off()
(myerror <- as.ts(mysum$resid))
bitmap(file='test5.png')
dum <- cbind(lag(myerror,k=1),myerror)
dum
dum1 <- dum[2:length(myerror),]
dum1
z <- as.data.frame(dum1)
z
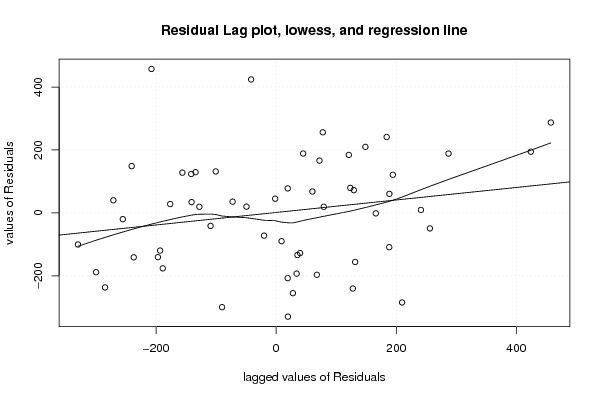
plot(z,main=paste('Residual Lag plot, lowess, and regression line'), ylab='values of Residuals', xlab='lagged values of Residuals')
lines(lowess(z))
abline(lm(z))
grid()
dev.off()
bitmap(file='test6.png')
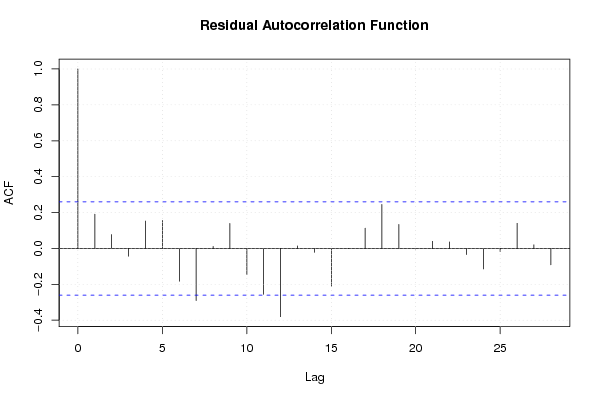
acf(mysum$resid, lag.max=length(mysum$resid)/2, main='Residual Autocorrelation Function')
grid()
dev.off()
bitmap(file='test7.png')
pacf(mysum$resid, lag.max=length(mysum$resid)/2, main='Residual Partial Autocorrelation Function')
grid()
dev.off()
bitmap(file='test8.png')
opar <- par(mfrow = c(2,2), oma = c(0, 0, 1.1, 0))
plot(mylm, las = 1, sub='Residual Diagnostics')
par(opar)
dev.off()
if (n > n25) {
bitmap(file='test9.png')
plot(kp3:nmkm3,gqarr[,2], main='Goldfeld-Quandt test',ylab='2-sided p-value',xlab='breakpoint')
grid()
dev.off()
}
load(file='createtable')
a<-table.start()
a<-table.row.start(a)
a<-table.element(a, 'Multiple Linear Regression - Estimated Regression Equation', 1, TRUE)
a<-table.row.end(a)
myeq <- colnames(x)[1]
myeq <- paste(myeq, '[t] = ', sep='')
for (i in 1:k){
if (mysum$coefficients[i,1] > 0) myeq <- paste(myeq, '+', '')
myeq <- paste(myeq, mysum$coefficients[i,1], sep=' ')
if (rownames(mysum$coefficients)[i] != '(Intercept)') {
myeq <- paste(myeq, rownames(mysum$coefficients)[i], sep='')
if (rownames(mysum$coefficients)[i] != 't') myeq <- paste(myeq, '[t]', sep='')
}
}
myeq <- paste(myeq, ' + e[t]')
a<-table.row.start(a)
a<-table.element(a, myeq)
a<-table.row.end(a)
a<-table.end(a)
table.save(a,file='mytable1.tab')
a<-table.start()
a<-table.row.start(a)
a<-table.element(a,hyperlink('ols1.htm','Multiple Linear Regression - Ordinary Least Squares',''), 6, TRUE)
a<-table.row.end(a)
a<-table.row.start(a)
a<-table.element(a,'Variable',header=TRUE)
a<-table.element(a,'Parameter',header=TRUE)
a<-table.element(a,'S.D.',header=TRUE)
a<-table.element(a,'T-STAT
H0: parameter = 0',header=TRUE)
a<-table.element(a,'2-tail p-value',header=TRUE)
a<-table.element(a,'1-tail p-value',header=TRUE)
a<-table.row.end(a)
for (i in 1:k){
a<-table.row.start(a)
a<-table.element(a,rownames(mysum$coefficients)[i],header=TRUE)
a<-table.element(a,mysum$coefficients[i,1])
a<-table.element(a, round(mysum$coefficients[i,2],6))
a<-table.element(a, round(mysum$coefficients[i,3],4))
a<-table.element(a, round(mysum$coefficients[i,4],6))
a<-table.element(a, round(mysum$coefficients[i,4]/2,6))
a<-table.row.end(a)
}
a<-table.end(a)
table.save(a,file='mytable2.tab')
a<-table.start()
a<-table.row.start(a)
a<-table.element(a, 'Multiple Linear Regression - Regression Statistics', 2, TRUE)
a<-table.row.end(a)
a<-table.row.start(a)
a<-table.element(a, 'Multiple R',1,TRUE)
a<-table.element(a, sqrt(mysum$r.squared))
a<-table.row.end(a)
a<-table.row.start(a)
a<-table.element(a, 'R-squared',1,TRUE)
a<-table.element(a, mysum$r.squared)
a<-table.row.end(a)
a<-table.row.start(a)
a<-table.element(a, 'Adjusted R-squared',1,TRUE)
a<-table.element(a, mysum$adj.r.squared)
a<-table.row.end(a)
a<-table.row.start(a)
a<-table.element(a, 'F-TEST (value)',1,TRUE)
a<-table.element(a, mysum$fstatistic[1])
a<-table.row.end(a)
a<-table.row.start(a)
a<-table.element(a, 'F-TEST (DF numerator)',1,TRUE)
a<-table.element(a, mysum$fstatistic[2])
a<-table.row.end(a)
a<-table.row.start(a)
a<-table.element(a, 'F-TEST (DF denominator)',1,TRUE)
a<-table.element(a, mysum$fstatistic[3])
a<-table.row.end(a)
a<-table.row.start(a)
a<-table.element(a, 'p-value',1,TRUE)
a<-table.element(a, 1-pf(mysum$fstatistic[1],mysum$fstatistic[2],mysum$fstatistic[3]))
a<-table.row.end(a)
a<-table.row.start(a)
a<-table.element(a, 'Multiple Linear Regression - Residual Statistics', 2, TRUE)
a<-table.row.end(a)
a<-table.row.start(a)
a<-table.element(a, 'Residual Standard Deviation',1,TRUE)
a<-table.element(a, mysum$sigma)
a<-table.row.end(a)
a<-table.row.start(a)
a<-table.element(a, 'Sum Squared Residuals',1,TRUE)
a<-table.element(a, sum(myerror*myerror))
a<-table.row.end(a)
a<-table.end(a)
table.save(a,file='mytable3.tab')
a<-table.start()
a<-table.row.start(a)
a<-table.element(a, 'Multiple Linear Regression - Actuals, Interpolation, and Residuals', 4, TRUE)
a<-table.row.end(a)
a<-table.row.start(a)
a<-table.element(a, 'Time or Index', 1, TRUE)
a<-table.element(a, 'Actuals', 1, TRUE)
a<-table.element(a, 'Interpolation
Forecast', 1, TRUE)
a<-table.element(a, 'Residuals
Prediction Error', 1, TRUE)
a<-table.row.end(a)
for (i in 1:n) {
a<-table.row.start(a)
a<-table.element(a,i, 1, TRUE)
a<-table.element(a,x[i])
a<-table.element(a,x[i]-mysum$resid[i])
a<-table.element(a,mysum$resid[i])
a<-table.row.end(a)
}
a<-table.end(a)
table.save(a,file='mytable4.tab')
if (n > n25) {
a<-table.start()
a<-table.row.start(a)
a<-table.element(a,'Goldfeld-Quandt test for Heteroskedasticity',4,TRUE)
a<-table.row.end(a)
a<-table.row.start(a)
a<-table.element(a,'p-values',header=TRUE)
a<-table.element(a,'Alternative Hypothesis',3,header=TRUE)
a<-table.row.end(a)
a<-table.row.start(a)
a<-table.element(a,'breakpoint index',header=TRUE)
a<-table.element(a,'greater',header=TRUE)
a<-table.element(a,'2-sided',header=TRUE)
a<-table.element(a,'less',header=TRUE)
a<-table.row.end(a)
for (mypoint in kp3:nmkm3) {
a<-table.row.start(a)
a<-table.element(a,mypoint,header=TRUE)
a<-table.element(a,gqarr[mypoint-kp3+1,1])
a<-table.element(a,gqarr[mypoint-kp3+1,2])
a<-table.element(a,gqarr[mypoint-kp3+1,3])
a<-table.row.end(a)
}
a<-table.end(a)
table.save(a,file='mytable5.tab')
a<-table.start()
a<-table.row.start(a)
a<-table.element(a,'Meta Analysis of Goldfeld-Quandt test for Heteroskedasticity',4,TRUE)
a<-table.row.end(a)
a<-table.row.start(a)
a<-table.element(a,'Description',header=TRUE)
a<-table.element(a,'# significant tests',header=TRUE)
a<-table.element(a,'% significant tests',header=TRUE)
a<-table.element(a,'OK/NOK',header=TRUE)
a<-table.row.end(a)
a<-table.row.start(a)
a<-table.element(a,'1% type I error level',header=TRUE)
a<-table.element(a,numsignificant1)
a<-table.element(a,numsignificant1/numgqtests)
if (numsignificant1/numgqtests < 0.01) dum <- 'OK' else dum <- 'NOK'
a<-table.element(a,dum)
a<-table.row.end(a)
a<-table.row.start(a)
a<-table.element(a,'5% type I error level',header=TRUE)
a<-table.element(a,numsignificant5)
a<-table.element(a,numsignificant5/numgqtests)
if (numsignificant5/numgqtests < 0.05) dum <- 'OK' else dum <- 'NOK'
a<-table.element(a,dum)
a<-table.row.end(a)
a<-table.row.start(a)
a<-table.element(a,'10% type I error level',header=TRUE)
a<-table.element(a,numsignificant10)
a<-table.element(a,numsignificant10/numgqtests)
if (numsignificant10/numgqtests < 0.1) dum <- 'OK' else dum <- 'NOK'
a<-table.element(a,dum)
a<-table.row.end(a)
a<-table.end(a)
table.save(a,file='mytable6.tab')
}