| Multiple Linear Regression - Estimated Regression Equation |
| Yt[t] = + 569.68085106383 -52.1808510638297X[t] + e[t] |
| Multiple Linear Regression - Ordinary Least Squares | |||||
| Variable | Parameter | S.D. | T-STAT H0: parameter = 0 | 2-tail p-value | 1-tail p-value |
| (Intercept) | 569.68085106383 | 5.308843 | 107.3079 | 0 | 0 |
| X | -52.1808510638297 | 11.081557 | -4.7088 | 1.6e-05 | 8e-06 |
| Multiple Linear Regression - Regression Statistics | |
| Multiple R | 0.522642943159927 |
| R-squared | 0.273155646034871 |
| Adjusted R-squared | 0.260836250204954 |
| F-TEST (value) | 22.1728118656207 |
| F-TEST (DF numerator) | 1 |
| F-TEST (DF denominator) | 59 |
| p-value | 1.55495900285851e-05 |
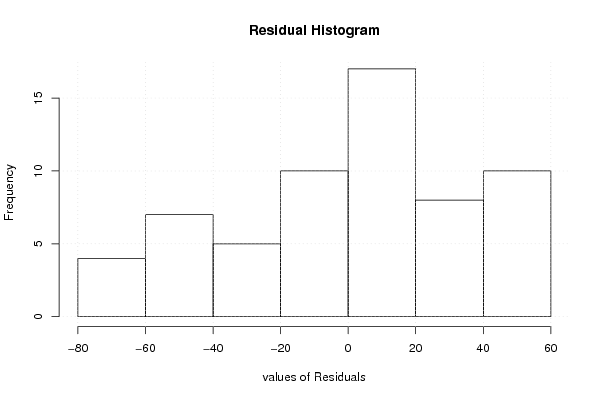
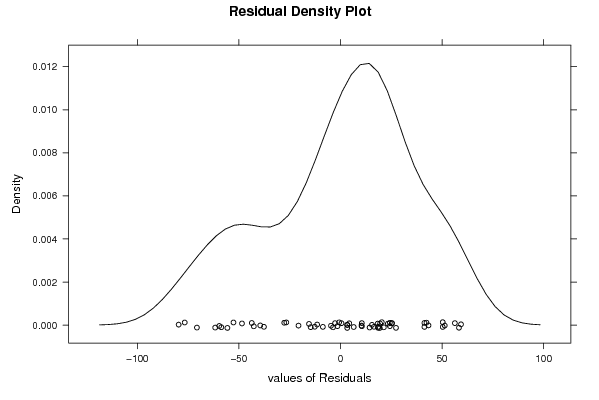
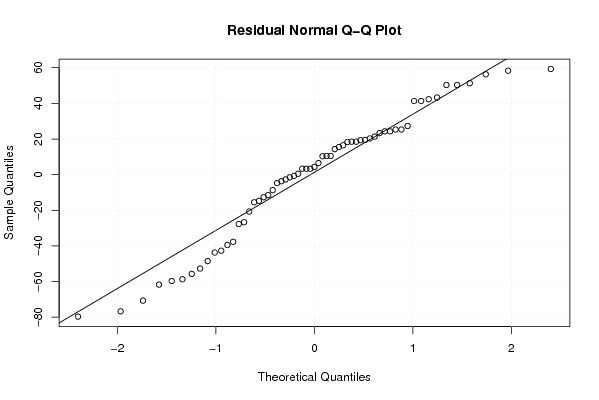
| Multiple Linear Regression - Residual Statistics | |
| Residual Standard Deviation | 36.3955931319028 |
| Sum Squared Residuals | 78153.7127659575 |
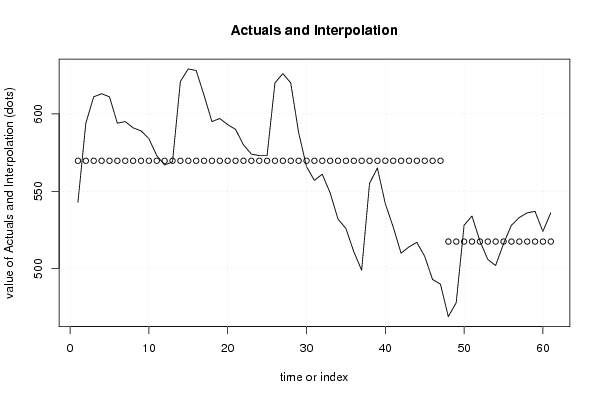
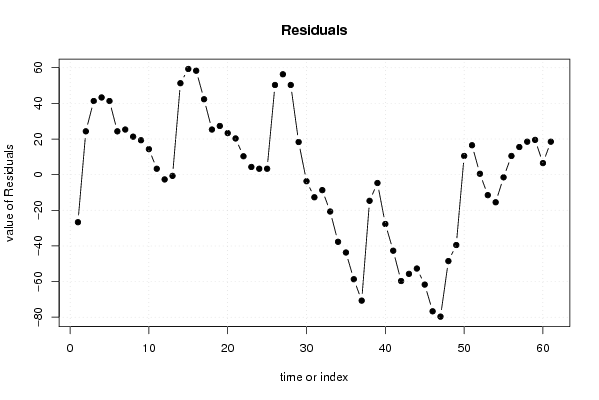
| Multiple Linear Regression - Actuals, Interpolation, and Residuals | |||
| Time or Index | Actuals | Interpolation Forecast | Residuals Prediction Error |
| 1 | 543 | 569.680851063832 | -26.6808510638318 |
| 2 | 594 | 569.68085106383 | 24.3191489361702 |
| 3 | 611 | 569.68085106383 | 41.3191489361703 |
| 4 | 613 | 569.68085106383 | 43.3191489361703 |
| 5 | 611 | 569.68085106383 | 41.3191489361703 |
| 6 | 594 | 569.68085106383 | 24.3191489361703 |
| 7 | 595 | 569.68085106383 | 25.3191489361703 |
| 8 | 591 | 569.68085106383 | 21.3191489361703 |
| 9 | 589 | 569.68085106383 | 19.3191489361703 |
| 10 | 584 | 569.68085106383 | 14.3191489361703 |
| 11 | 573 | 569.68085106383 | 3.31914893617026 |
| 12 | 567 | 569.68085106383 | -2.68085106382974 |
| 13 | 569 | 569.68085106383 | -0.680851063829743 |
| 14 | 621 | 569.68085106383 | 51.3191489361703 |
| 15 | 629 | 569.68085106383 | 59.3191489361703 |
| 16 | 628 | 569.68085106383 | 58.3191489361703 |
| 17 | 612 | 569.68085106383 | 42.3191489361703 |
| 18 | 595 | 569.68085106383 | 25.3191489361703 |
| 19 | 597 | 569.68085106383 | 27.3191489361703 |
| 20 | 593 | 569.68085106383 | 23.3191489361703 |
| 21 | 590 | 569.68085106383 | 20.3191489361703 |
| 22 | 580 | 569.68085106383 | 10.3191489361703 |
| 23 | 574 | 569.68085106383 | 4.31914893617026 |
| 24 | 573 | 569.68085106383 | 3.31914893617026 |
| 25 | 573 | 569.68085106383 | 3.31914893617026 |
| 26 | 620 | 569.68085106383 | 50.3191489361703 |
| 27 | 626 | 569.68085106383 | 56.3191489361703 |
| 28 | 620 | 569.68085106383 | 50.3191489361703 |
| 29 | 588 | 569.68085106383 | 18.3191489361703 |
| 30 | 566 | 569.68085106383 | -3.68085106382974 |
| 31 | 557 | 569.68085106383 | -12.6808510638297 |
| 32 | 561 | 569.68085106383 | -8.68085106382974 |
| 33 | 549 | 569.68085106383 | -20.6808510638297 |
| 34 | 532 | 569.68085106383 | -37.6808510638297 |
| 35 | 526 | 569.68085106383 | -43.6808510638297 |
| 36 | 511 | 569.68085106383 | -58.6808510638297 |
| 37 | 499 | 569.68085106383 | -70.6808510638297 |
| 38 | 555 | 569.68085106383 | -14.6808510638297 |
| 39 | 565 | 569.68085106383 | -4.68085106382974 |
| 40 | 542 | 569.68085106383 | -27.6808510638297 |
| 41 | 527 | 569.68085106383 | -42.6808510638297 |
| 42 | 510 | 569.68085106383 | -59.6808510638297 |
| 43 | 514 | 569.68085106383 | -55.6808510638297 |
| 44 | 517 | 569.68085106383 | -52.6808510638297 |
| 45 | 508 | 569.68085106383 | -61.6808510638297 |
| 46 | 493 | 569.68085106383 | -76.6808510638297 |
| 47 | 490 | 569.68085106383 | -79.6808510638297 |
| 48 | 469 | 517.5 | -48.5 |
| 49 | 478 | 517.5 | -39.5 |
| 50 | 528 | 517.5 | 10.5 |
| 51 | 534 | 517.5 | 16.5 |
| 52 | 518 | 517.5 | 0.500000000000005 |
| 53 | 506 | 517.5 | -11.5 |
| 54 | 502 | 517.5 | -15.5 |
| 55 | 516 | 517.5 | -1.49999999999999 |
| 56 | 528 | 517.5 | 10.5 |
| 57 | 533 | 517.5 | 15.5 |
| 58 | 536 | 517.5 | 18.5 |
| 59 | 537 | 517.5 | 19.5 |
| 60 | 524 | 517.5 | 6.5 |
| 61 | 536 | 517.5 | 18.5 |
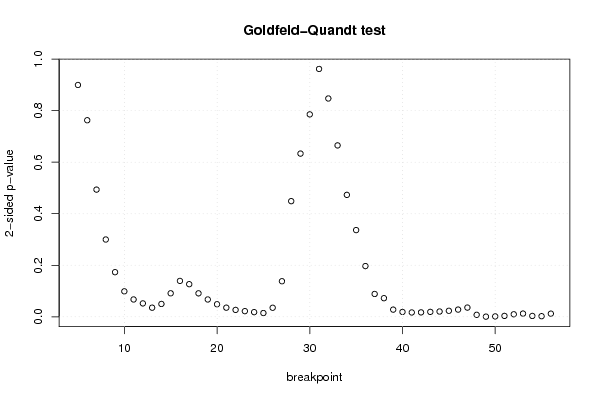
| Goldfeld-Quandt test for Heteroskedasticity | |||
| p-values | Alternative Hypothesis | ||
| breakpoint index | greater | 2-sided | less |
| 5 | 0.550132965500736 | 0.899734068998529 | 0.449867034499264 |
| 6 | 0.381458253837893 | 0.762916507675786 | 0.618541746162107 |
| 7 | 0.246813233244325 | 0.49362646648865 | 0.753186766755675 |
| 8 | 0.149967196209082 | 0.299934392418165 | 0.850032803790918 |
| 9 | 0.0865867027370563 | 0.173173405474113 | 0.913413297262944 |
| 10 | 0.0494182516752721 | 0.0988365033505441 | 0.950581748324728 |
| 11 | 0.0336218657637210 | 0.0672437315274419 | 0.96637813423628 |
| 12 | 0.026009855272522 | 0.052019710545044 | 0.973990144727478 |
| 13 | 0.0176698752155813 | 0.0353397504311626 | 0.982330124784419 |
| 14 | 0.0249370605876578 | 0.0498741211753156 | 0.975062939412342 |
| 15 | 0.0455819908046473 | 0.0911639816092946 | 0.954418009195353 |
| 16 | 0.0696055914909289 | 0.139211182981858 | 0.930394408509071 |
| 17 | 0.0632861641017665 | 0.126572328203533 | 0.936713835898233 |
| 18 | 0.0455554183754321 | 0.0911108367508643 | 0.954444581624568 |
| 19 | 0.0336006850517908 | 0.0672013701035816 | 0.96639931494821 |
| 20 | 0.0243648604488628 | 0.0487297208977256 | 0.975635139551137 |
| 21 | 0.0176786915741185 | 0.0353573831482369 | 0.982321308425882 |
| 22 | 0.0133883297601658 | 0.0267766595203315 | 0.986611670239834 |
| 23 | 0.0109438997866438 | 0.0218877995732875 | 0.989056100213356 |
| 24 | 0.00897516827345616 | 0.0179503365469123 | 0.991024831726544 |
| 25 | 0.00728029601630014 | 0.0145605920326003 | 0.9927197039837 |
| 26 | 0.0175403999280261 | 0.0350807998560522 | 0.982459600071974 |
| 27 | 0.0689996629398558 | 0.137999325879712 | 0.931000337060144 |
| 28 | 0.224410108785943 | 0.448820217571887 | 0.775589891214057 |
| 29 | 0.316731087610318 | 0.633462175220637 | 0.683268912389682 |
| 30 | 0.392848377236862 | 0.785696754473724 | 0.607151622763138 |
| 31 | 0.480995131820644 | 0.961990263641288 | 0.519004868179356 |
| 32 | 0.576310544693019 | 0.847378910613962 | 0.423689455306981 |
| 33 | 0.667362866823171 | 0.665274266353657 | 0.332637133176829 |
| 34 | 0.763392215504913 | 0.473215568990174 | 0.236607784495087 |
| 35 | 0.831715935835388 | 0.336568128329223 | 0.168284064164612 |
| 36 | 0.901591587703332 | 0.196816824593336 | 0.0984084122966678 |
| 37 | 0.955693973591153 | 0.0886120528176943 | 0.0443060264088472 |
| 38 | 0.963915076190692 | 0.0721698476186156 | 0.0360849238093078 |
| 39 | 0.98609585842938 | 0.0278082831412398 | 0.0139041415706199 |
| 40 | 0.990592183933436 | 0.0188156321331274 | 0.00940781606656369 |
| 41 | 0.991606576924803 | 0.0167868461503948 | 0.0083934230751974 |
| 42 | 0.9914334121037 | 0.0171331757926007 | 0.00856658789630036 |
| 43 | 0.990462023284222 | 0.0190759534315563 | 0.00953797671577814 |
| 44 | 0.989777981312145 | 0.0204440373757092 | 0.0102220186878546 |
| 45 | 0.98835430754682 | 0.0232913849063585 | 0.0116456924531792 |
| 46 | 0.98602561392603 | 0.0279487721479376 | 0.0139743860739688 |
| 47 | 0.982139072442474 | 0.0357218551150519 | 0.0178609275575259 |
| 48 | 0.996160277351776 | 0.00767944529644774 | 0.00383972264822387 |
| 49 | 0.999737208116572 | 0.000525583766855598 | 0.000262791883427799 |
| 50 | 0.99925449736343 | 0.00149100527314026 | 0.000745502636570132 |
| 51 | 0.998269480739515 | 0.00346103852097008 | 0.00173051926048504 |
| 52 | 0.995142470686393 | 0.00971505862721429 | 0.00485752931360714 |
| 53 | 0.993770813446771 | 0.0124583731064580 | 0.00622918655322901 |
| 54 | 0.998354632604871 | 0.00329073479025708 | 0.00164536739512854 |
| 55 | 0.998841455704154 | 0.00231708859169218 | 0.00115854429584609 |
| 56 | 0.99389267488076 | 0.0122146502384779 | 0.00610732511923893 |
| Meta Analysis of Goldfeld-Quandt test for Heteroskedasticity | |||
| Description | # significant tests | % significant tests | OK/NOK |
| 1% type I error level | 7 | 0.134615384615385 | NOK |
| 5% type I error level | 27 | 0.519230769230769 | NOK |
| 10% type I error level | 35 | 0.673076923076923 | NOK |