| Multiple Linear Regression - Estimated Regression Equation |
| Y[t] = -0.00358137222472382 + 0.0430371388604634X[t] + 1.59792849135609Y1[t] -0.866541593526066Y2[t] -0.115378085010860Y3[t] + 0.314938073658562Y4[t] + 0.114618565818876M1[t] + 0.0598786116445835M2[t] + 0.297454773809027M3[t] + 0.163732537521505M4[t] -0.0342366300054975M5[t] + 0.029629519712166M6[t] + 0.0750588409022986M7[t] + 0.0084280845813315M8[t] -0.0150917423286754M9[t] + 0.503060824356568M10[t] -0.379811338849724M11[t] + 0.00157047152209919t + e[t] |
| Multiple Linear Regression - Ordinary Least Squares | |||||
| Variable | Parameter | S.D. | T-STAT H0: parameter = 0 | 2-tail p-value | 1-tail p-value |
| (Intercept) | -0.00358137222472382 | 0.668581 | -0.0054 | 0.995747 | 0.497873 |
| X | 0.0430371388604634 | 0.055575 | 0.7744 | 0.44227 | 0.221135 |
| Y1 | 1.59792849135609 | 0.148078 | 10.7911 | 0 | 0 |
| Y2 | -0.866541593526066 | 0.269219 | -3.2187 | 0.002241 | 0.00112 |
| Y3 | -0.115378085010860 | 0.273253 | -0.4222 | 0.674625 | 0.337313 |
| Y4 | 0.314938073658562 | 0.154496 | 2.0385 | 0.046701 | 0.023351 |
| M1 | 0.114618565818876 | 0.194376 | 0.5897 | 0.558013 | 0.279006 |
| M2 | 0.0598786116445835 | 0.157694 | 0.3797 | 0.705734 | 0.352867 |
| M3 | 0.297454773809027 | 0.162991 | 1.825 | 0.073865 | 0.036932 |
| M4 | 0.163732537521505 | 0.173158 | 0.9456 | 0.348829 | 0.174414 |
| M5 | -0.0342366300054975 | 0.155588 | -0.22 | 0.826714 | 0.413357 |
| M6 | 0.029629519712166 | 0.153972 | 0.1924 | 0.848166 | 0.424083 |
| M7 | 0.0750588409022986 | 0.171619 | 0.4374 | 0.663699 | 0.33185 |
| M8 | 0.0084280845813315 | 0.176325 | 0.0478 | 0.962063 | 0.481032 |
| M9 | -0.0150917423286754 | 0.168227 | -0.0897 | 0.928869 | 0.464434 |
| M10 | 0.503060824356568 | 0.157899 | 3.186 | 0.002463 | 0.001231 |
| M11 | -0.379811338849724 | 0.202474 | -1.8759 | 0.066404 | 0.033202 |
| t | 0.00157047152209919 | 0.002253 | 0.6971 | 0.488932 | 0.244466 |
| Multiple Linear Regression - Regression Statistics | |
| Multiple R | 0.963039353437112 |
| R-squared | 0.927444796268571 |
| Adjusted R-squared | 0.903259728358095 |
| F-TEST (value) | 38.3478268368572 |
| F-TEST (DF numerator) | 17 |
| F-TEST (DF denominator) | 51 |
| p-value | 0 |
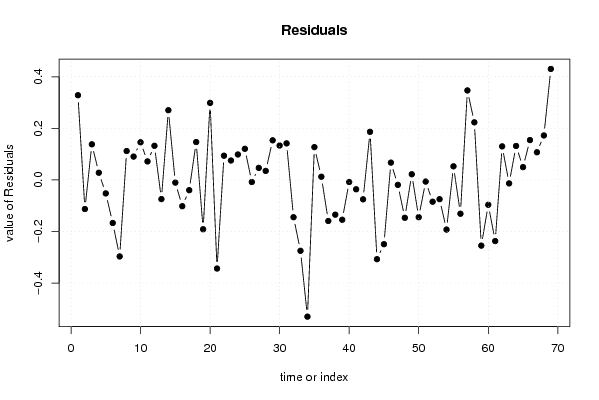
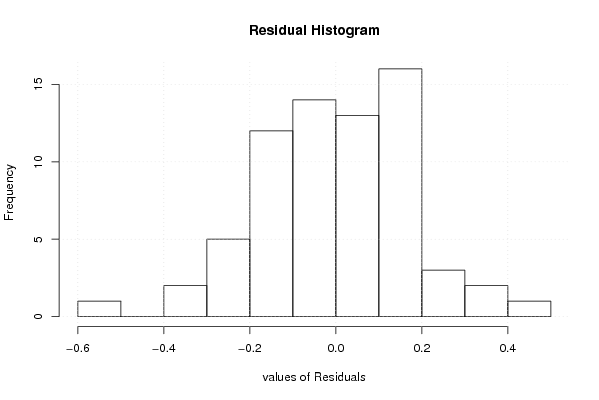
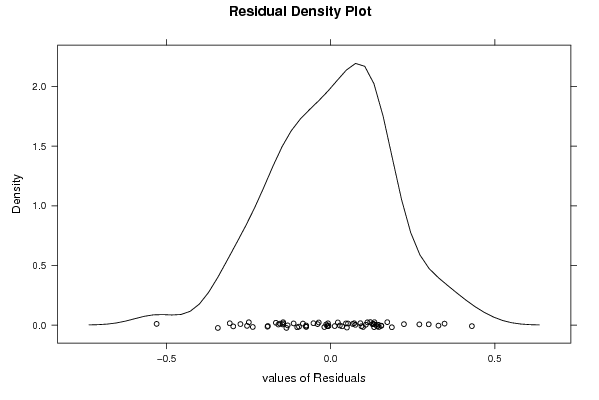
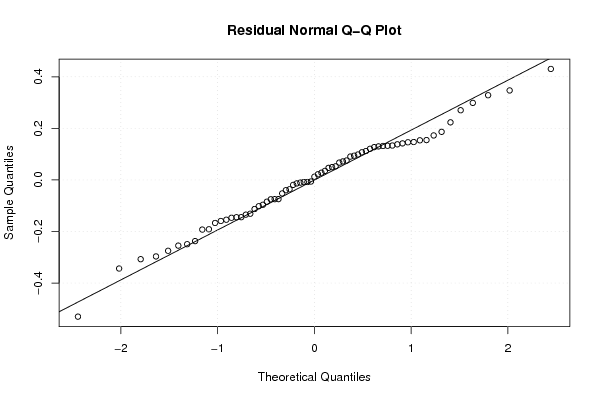
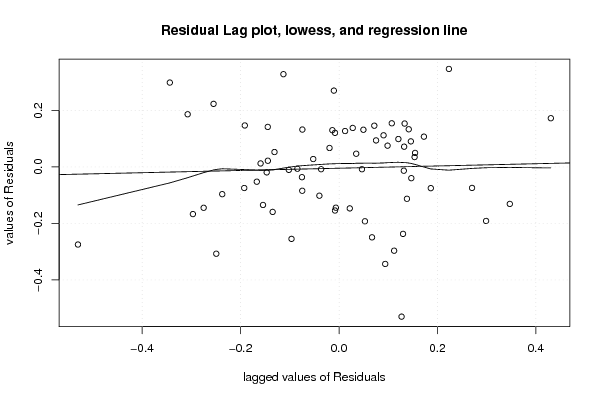
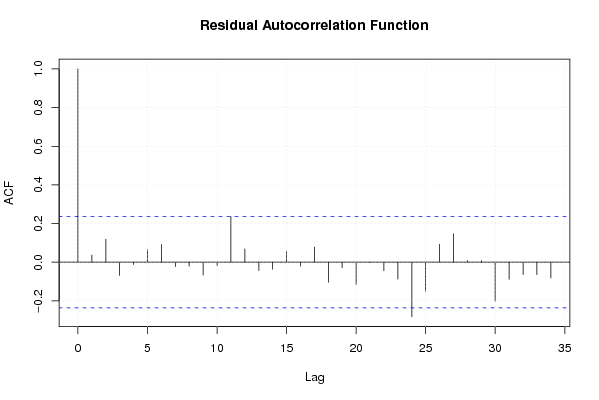
| Multiple Linear Regression - Residual Statistics | |
| Residual Standard Deviation | 0.205259595827174 |
| Sum Squared Residuals | 2.14870658563588 |
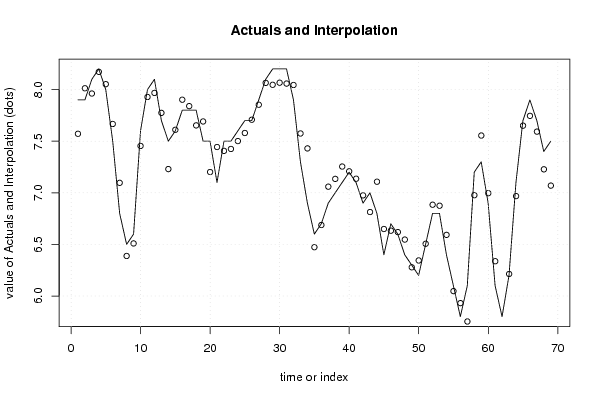
| Multiple Linear Regression - Actuals, Interpolation, and Residuals | |||
| Time or Index | Actuals | Interpolation Forecast | Residuals Prediction Error |
| 1 | 7.9 | 7.5716147032322 | 0.328385296767800 |
| 2 | 7.9 | 8.01288512534686 | -0.112885125346857 |
| 3 | 8.1 | 7.96194880676678 | 0.138051193233223 |
| 4 | 8.2 | 8.17208540545145 | 0.0279145945485524 |
| 5 | 8 | 8.05234894808846 | -0.0523489480884614 |
| 6 | 7.5 | 7.666951525272 | -0.166951525271997 |
| 7 | 6.8 | 7.09670805838156 | -0.296708058381559 |
| 8 | 6.5 | 6.38802690910635 | 0.111973090893651 |
| 9 | 6.6 | 6.50949811898381 | 0.090501881016189 |
| 10 | 7.6 | 7.45404267089778 | 0.145957329102217 |
| 11 | 8 | 7.92829808236166 | 0.0717019176383355 |
| 12 | 8.1 | 7.96768303737911 | 0.132316962620889 |
| 13 | 7.7 | 7.77443058382585 | -0.0744305838258467 |
| 14 | 7.5 | 7.22979267384446 | 0.270207326155542 |
| 15 | 7.6 | 7.61040766763255 | -0.0104076676325478 |
| 16 | 7.8 | 7.90191325373629 | -0.101913253736286 |
| 17 | 7.8 | 7.83985019807479 | -0.0398501980747887 |
| 18 | 7.8 | 7.65314936349049 | 0.146850636509507 |
| 19 | 7.5 | 7.69135249102222 | -0.191352491022223 |
| 20 | 7.5 | 7.20129384577615 | 0.298706154223852 |
| 21 | 7.1 | 7.44361068233211 | -0.343610682332107 |
| 22 | 7.5 | 7.40611660224678 | 0.09388339775322 |
| 23 | 7.5 | 7.42472895018998 | 0.0752710498100245 |
| 24 | 7.6 | 7.50134164326967 | 0.0986583567303307 |
| 25 | 7.7 | 7.5793747829622 | 0.120625217037794 |
| 26 | 7.7 | 7.70810436401226 | -0.00810436401225563 |
| 27 | 7.9 | 7.85336274373115 | 0.0466372562688485 |
| 28 | 8.1 | 8.06505638998776 | 0.0349436100122358 |
| 29 | 8.2 | 8.04642888091472 | 0.153571119085279 |
| 30 | 8.2 | 8.06666698781062 | 0.133333012189385 |
| 31 | 8.2 | 8.05831719112769 | 0.141682808872312 |
| 32 | 7.9 | 8.04470671255945 | -0.144706712559445 |
| 33 | 7.3 | 7.57487261713057 | -0.274872617130569 |
| 34 | 6.9 | 7.43023074967045 | -0.530230749670445 |
| 35 | 6.6 | 6.47290347083481 | 0.127096529165192 |
| 36 | 6.7 | 6.68766137234708 | 0.0123386276529165 |
| 37 | 6.9 | 7.05927555726046 | -0.159275557260464 |
| 38 | 7 | 7.13476466790858 | -0.134764667908577 |
| 39 | 7.1 | 7.25437660142686 | -0.154376601426861 |
| 40 | 7.2 | 7.20808543069417 | -0.00808543069417039 |
| 41 | 7.1 | 7.1362752307029 | -0.0362752307028975 |
| 42 | 6.9 | 6.97522084231921 | -0.0752208423192126 |
| 43 | 7 | 6.81354880886365 | 0.186451191136349 |
| 44 | 6.8 | 7.10740645222836 | -0.307406452228362 |
| 45 | 6.4 | 6.64928047942271 | -0.249280479422713 |
| 46 | 6.7 | 6.63291873044608 | 0.0670812695539187 |
| 47 | 6.6 | 6.61927050628903 | -0.0192705062890313 |
| 48 | 6.4 | 6.54684575319587 | -0.14684575319587 |
| 49 | 6.3 | 6.27812202442365 | 0.0218779755763539 |
| 50 | 6.2 | 6.34448724193971 | -0.144487241939710 |
| 51 | 6.5 | 6.50638070936561 | -0.00638070936561317 |
| 52 | 6.8 | 6.88450813124295 | -0.0845081312429514 |
| 53 | 6.8 | 6.87465836406415 | -0.0746583640641462 |
| 54 | 6.4 | 6.59250670494674 | -0.192506704946743 |
| 55 | 6.1 | 6.04729195605271 | 0.0527080439472889 |
| 56 | 5.8 | 5.93104004169687 | -0.131040041696870 |
| 57 | 6.1 | 5.75304070650848 | 0.346959293491515 |
| 58 | 7.2 | 6.97669124673891 | 0.223308753261090 |
| 59 | 7.3 | 7.55479899032452 | -0.254798990324520 |
| 60 | 6.9 | 6.99646819380827 | -0.096468193808266 |
| 61 | 6.1 | 6.33718234829564 | -0.237182348295637 |
| 62 | 5.8 | 5.66996592694814 | 0.130034073051858 |
| 63 | 6.2 | 6.21352347107705 | -0.0135234710770500 |
| 64 | 7.1 | 6.96835138888738 | 0.13164861111262 |
| 65 | 7.7 | 7.65043837815499 | 0.0495616218450148 |
| 66 | 7.9 | 7.74550457616094 | 0.154495423839061 |
| 67 | 7.7 | 7.59278149455217 | 0.107218505447832 |
| 68 | 7.4 | 7.22752603863283 | 0.172473961367174 |
| 69 | 7.5 | 7.06969739562232 | 0.430302604377684 |
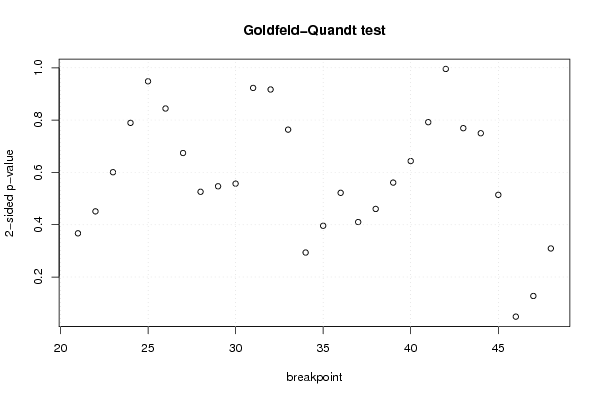
| Goldfeld-Quandt test for Heteroskedasticity | |||
| p-values | Alternative Hypothesis | ||
| breakpoint index | greater | 2-sided | less |
| 21 | 0.816495258883685 | 0.367009482232629 | 0.183504741116315 |
| 22 | 0.774500963616633 | 0.450998072766734 | 0.225499036383367 |
| 23 | 0.699660541547621 | 0.600678916904757 | 0.300339458452379 |
| 24 | 0.605353671917411 | 0.789292656165178 | 0.394646328082589 |
| 25 | 0.525884891046345 | 0.94823021790731 | 0.474115108953655 |
| 26 | 0.422084534350258 | 0.844169068700515 | 0.577915465649742 |
| 27 | 0.337009968874212 | 0.674019937748423 | 0.662990031125788 |
| 28 | 0.262925289899928 | 0.525850579799856 | 0.737074710100072 |
| 29 | 0.273410860448021 | 0.546821720896041 | 0.72658913955198 |
| 30 | 0.278469477522919 | 0.556938955045838 | 0.721530522477081 |
| 31 | 0.461412111898618 | 0.922824223797236 | 0.538587888101382 |
| 32 | 0.458446452730322 | 0.916892905460643 | 0.541553547269678 |
| 33 | 0.381721356102745 | 0.76344271220549 | 0.618278643897255 |
| 34 | 0.853265002631051 | 0.293469994737897 | 0.146734997368949 |
| 35 | 0.802051897600116 | 0.395896204799769 | 0.197948102399884 |
| 36 | 0.739080763204453 | 0.521838473591093 | 0.260919236795547 |
| 37 | 0.794940444883794 | 0.410119110232412 | 0.205059555116206 |
| 38 | 0.769903570608607 | 0.460192858782786 | 0.230096429391393 |
| 39 | 0.71954461772717 | 0.56091076454566 | 0.28045538227283 |
| 40 | 0.67837386799804 | 0.64325226400392 | 0.32162613200196 |
| 41 | 0.604028763907724 | 0.791942472184551 | 0.395971236092276 |
| 42 | 0.497713283493834 | 0.995426566987668 | 0.502286716506166 |
| 43 | 0.615470773411963 | 0.769058453176073 | 0.384529226588037 |
| 44 | 0.625170175340474 | 0.749659649319052 | 0.374829824659526 |
| 45 | 0.742939512189661 | 0.514120975620678 | 0.257060487810339 |
| 46 | 0.975804873000564 | 0.0483902539988716 | 0.0241951269994358 |
| 47 | 0.936290702273911 | 0.127418595452178 | 0.0637092977260889 |
| 48 | 0.84542253764683 | 0.309154924706341 | 0.154577462353171 |
| Meta Analysis of Goldfeld-Quandt test for Heteroskedasticity | |||
| Description | # significant tests | % significant tests | OK/NOK |
| 1% type I error level | 0 | 0 | OK |
| 5% type I error level | 1 | 0.0357142857142857 | OK |
| 10% type I error level | 1 | 0.0357142857142857 | OK |