| Multiple Linear Regression - Estimated Regression Equation |
| Rvnp[t] = + 18.4525616663621 -0.0204001461721176Svdg[t] -1.03551982459347M1[t] -1.62120043851635M2[t] -2.78367988306231M3[t] -2.75143979535904M4[t] -3.16735976612461M5[t] -3.45183994153115M6[t] -3.88488032157866M7[t] -3.47632011693769M8[t] -2.30775991229673M9[t] -0.808160058468847M10[t] -0.356320116937693M11[t] + e[t] |
| Multiple Linear Regression - Ordinary Least Squares | |||||
| Variable | Parameter | S.D. | T-STAT H0: parameter = 0 | 2-tail p-value | 1-tail p-value |
| (Intercept) | 18.4525616663621 | 5.481337 | 3.3664 | 0.001526 | 0.000763 |
| Svdg | -0.0204001461721176 | 0.230032 | -0.0887 | 0.92971 | 0.464855 |
| M1 | -1.03551982459347 | 6.812685 | -0.152 | 0.879839 | 0.439919 |
| M2 | -1.62120043851635 | 6.841982 | -0.2369 | 0.813726 | 0.406863 |
| M3 | -2.78367988306231 | 6.809578 | -0.4088 | 0.684551 | 0.342276 |
| M4 | -2.75143979535904 | 6.814705 | -0.4038 | 0.688227 | 0.344114 |
| M5 | -3.16735976612461 | 6.817034 | -0.4646 | 0.644346 | 0.322173 |
| M6 | -3.45183994153115 | 6.807713 | -0.507 | 0.614492 | 0.307246 |
| M7 | -3.88488032157866 | 6.825877 | -0.5691 | 0.571971 | 0.285986 |
| M8 | -3.47632011693769 | 6.809578 | -0.5105 | 0.612088 | 0.306044 |
| M9 | -2.30775991229673 | 6.80849 | -0.339 | 0.736155 | 0.368077 |
| M10 | -0.808160058468847 | 6.807713 | -0.1187 | 0.906009 | 0.453005 |
| M11 | -0.356320116937693 | 6.809578 | -0.0523 | 0.95849 | 0.479245 |
| Multiple Linear Regression - Regression Statistics | |
| Multiple R | 0.133224252760056 |
| R-squared | 0.0177487015234754 |
| Adjusted R-squared | -0.233038864044999 |
| F-TEST (value) | 0.0707718561853072 |
| F-TEST (DF numerator) | 12 |
| F-TEST (DF denominator) | 47 |
| p-value | 0.999990611475983 |
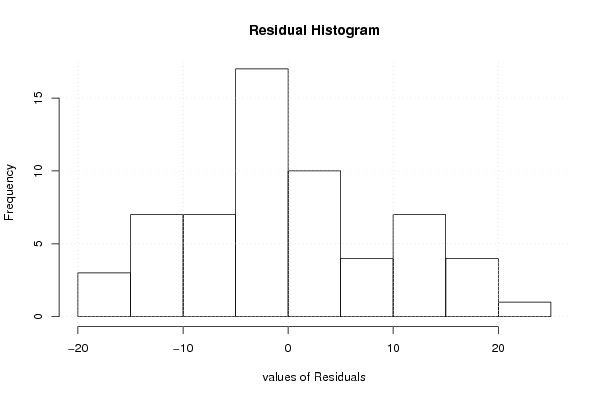
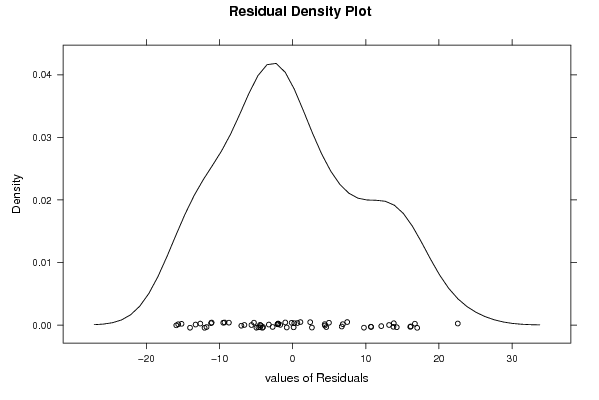
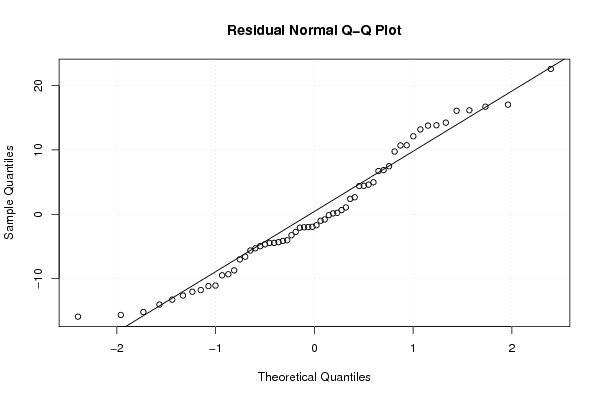
| Multiple Linear Regression - Residual Statistics | |
| Residual Standard Deviation | 10.7629555079151 |
| Sum Squared Residuals | 5444.53692947195 |
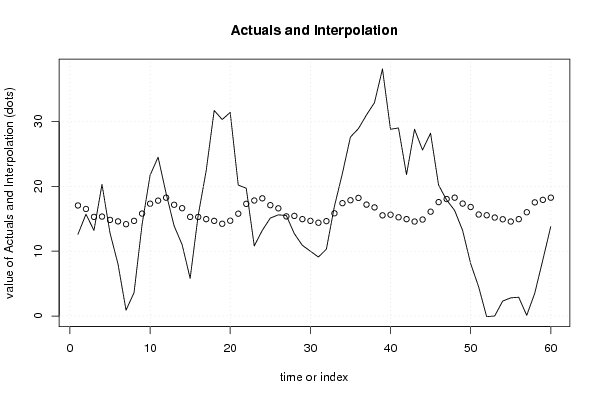
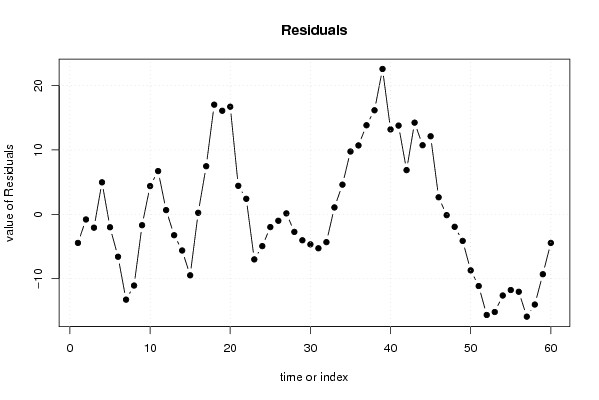
| Multiple Linear Regression - Actuals, Interpolation, and Residuals | |||
| Time or Index | Actuals | Interpolation Forecast | Residuals Prediction Error |
| 1 | 12.6 | 17.0498392106706 | -4.44983921067059 |
| 2 | 15.7 | 16.5049588890919 | -0.804958889091902 |
| 3 | 13.2 | 15.2812790060296 | -2.0812790060296 |
| 4 | 20.3 | 15.333919239905 | 4.96608076009501 |
| 5 | 12.8 | 14.8159985382788 | -2.01599853827882 |
| 6 | 8 | 14.5927188013886 | -6.59271880138864 |
| 7 | 0.9 | 14.1596784213411 | -13.2596784213411 |
| 8 | 3.6 | 14.6702393568427 | -11.0702393568427 |
| 9 | 14.1 | 15.7979992691394 | -1.69799926913941 |
| 10 | 21.7 | 17.3179992691394 | 4.38200073086059 |
| 11 | 24.5 | 17.7902393568427 | 6.70976064315731 |
| 12 | 18.9 | 18.2485602046410 | 0.651439795359037 |
| 13 | 13.9 | 17.1518399415311 | -3.25183994153114 |
| 14 | 11 | 16.6273597661246 | -5.62735976612461 |
| 15 | 5.8 | 15.2812790060296 | -9.4812790060296 |
| 16 | 15.5 | 15.2727188013886 | 0.227281198611366 |
| 17 | 22.4 | 14.9383994153115 | 7.46160058468847 |
| 18 | 31.7 | 14.6743193860771 | 17.0256806139229 |
| 19 | 30.3 | 14.2208788598575 | 16.0791211401425 |
| 20 | 31.4 | 14.6906395030148 | 16.7093604969852 |
| 21 | 20.2 | 15.7775991229673 | 4.42240087703271 |
| 22 | 19.7 | 17.2975991229673 | 2.40240087703271 |
| 23 | 10.8 | 17.8106395030148 | -7.0106395030148 |
| 24 | 13.2 | 18.1465594737804 | -4.94655947378038 |
| 25 | 15.1 | 17.0906395030148 | -1.99063950301479 |
| 26 | 15.6 | 16.6069596199525 | -1.00695961995249 |
| 27 | 15.5 | 15.3628795907181 | 0.137120409281927 |
| 28 | 12.7 | 15.4359199707656 | -2.73591997076558 |
| 29 | 10.9 | 14.9383994153115 | -4.03839941531153 |
| 30 | 10 | 14.6743193860771 | -4.6743193860771 |
| 31 | 9.1 | 14.3840800292344 | -5.28408002923442 |
| 32 | 10.3 | 14.6294390644984 | -4.32943906449844 |
| 33 | 16.9 | 15.8387995614836 | 1.06120043851635 |
| 34 | 22 | 17.3995998538279 | 4.60040014617212 |
| 35 | 27.6 | 17.8514397953590 | 9.74856020464096 |
| 36 | 28.9 | 18.2077599122967 | 10.6922400877033 |
| 37 | 31 | 17.1722400877033 | 13.8277599122967 |
| 38 | 32.9 | 16.7497606431573 | 16.1502393568427 |
| 39 | 38.1 | 15.5260807600950 | 22.573919239905 |
| 40 | 28.8 | 15.6195212863146 | 13.1804787136854 |
| 41 | 29 | 15.2240014617212 | 13.7759985382788 |
| 42 | 21.8 | 14.9395212863146 | 6.86047871368536 |
| 43 | 28.8 | 14.5676813447835 | 14.2323186552165 |
| 44 | 25.6 | 14.8742408185639 | 10.7257591814361 |
| 45 | 28.2 | 16.0836013155491 | 12.1163986844509 |
| 46 | 20.2 | 17.5628010232048 | 2.63719897679517 |
| 47 | 17.9 | 18.0350411109081 | -0.135041110908095 |
| 48 | 16.3 | 18.2485602046410 | -1.94856020464096 |
| 49 | 13.2 | 17.3354412570802 | -4.1354412570802 |
| 50 | 8.1 | 16.8109610816737 | -8.71096108167367 |
| 51 | 4.5 | 15.6484816371277 | -11.1484816371277 |
| 52 | -0.1 | 15.5379207016262 | -15.6379207016262 |
| 53 | 0 | 15.1832011693770 | -15.1832011693770 |
| 54 | 2.3 | 14.9191211401425 | -12.6191211401425 |
| 55 | 2.8 | 14.5676813447835 | -11.7676813447835 |
| 56 | 2.9 | 14.9354412570802 | -12.0354412570802 |
| 57 | 0.1 | 16.0020007308606 | -15.9020007308606 |
| 58 | 3.5 | 17.5220007308606 | -14.0220007308606 |
| 59 | 8.6 | 17.9126402338754 | -9.31264023387539 |
| 60 | 13.8 | 18.2485602046410 | -4.44856020464096 |
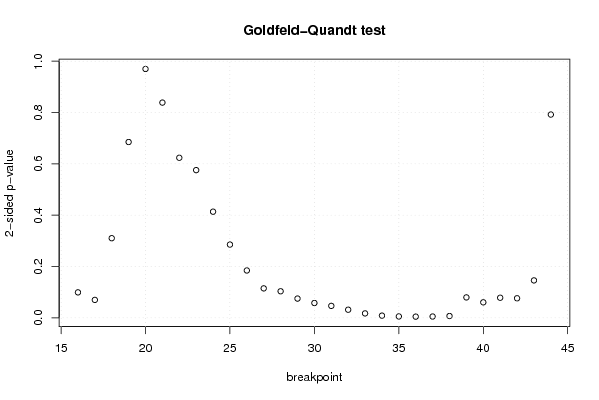
| Goldfeld-Quandt test for Heteroskedasticity | |||
| p-values | Alternative Hypothesis | ||
| breakpoint index | greater | 2-sided | less |
| 16 | 0.0496233549463809 | 0.0992467098927618 | 0.95037664505362 |
| 17 | 0.0349474073056031 | 0.0698948146112062 | 0.965052592694397 |
| 18 | 0.155143790124196 | 0.310287580248392 | 0.844856209875804 |
| 19 | 0.342525594519004 | 0.685051189038008 | 0.657474405480996 |
| 20 | 0.515116604999925 | 0.96976679000015 | 0.484883395000075 |
| 21 | 0.419313391875039 | 0.838626783750078 | 0.580686608124961 |
| 22 | 0.311839549852880 | 0.623679099705761 | 0.68816045014712 |
| 23 | 0.287761688786072 | 0.575523377572145 | 0.712238311213928 |
| 24 | 0.206790357695469 | 0.413580715390937 | 0.793209642304531 |
| 25 | 0.142739350240227 | 0.285478700480454 | 0.857260649759773 |
| 26 | 0.0922785967850378 | 0.184557193570076 | 0.907721403214962 |
| 27 | 0.0574091396295178 | 0.114818279259036 | 0.942590860370482 |
| 28 | 0.0517489712977251 | 0.103497942595450 | 0.948251028702275 |
| 29 | 0.037524380976095 | 0.07504876195219 | 0.962475619023905 |
| 30 | 0.0288716910273695 | 0.057743382054739 | 0.97112830897263 |
| 31 | 0.0233069661799426 | 0.0466139323598853 | 0.976693033820057 |
| 32 | 0.0158068175266925 | 0.0316136350533850 | 0.984193182473307 |
| 33 | 0.00862466349615174 | 0.0172493269923035 | 0.991375336503848 |
| 34 | 0.00427980646742578 | 0.00855961293485156 | 0.995720193532574 |
| 35 | 0.002738177426988 | 0.005476354853976 | 0.997261822573012 |
| 36 | 0.00229787479739983 | 0.00459574959479966 | 0.9977021252026 |
| 37 | 0.00254241171738609 | 0.00508482343477217 | 0.997457588282614 |
| 38 | 0.00352185352349237 | 0.00704370704698474 | 0.996478146476508 |
| 39 | 0.0398024985372744 | 0.0796049970745488 | 0.960197501462726 |
| 40 | 0.0302273201767292 | 0.0604546403534585 | 0.96977267982327 |
| 41 | 0.0391286989065364 | 0.0782573978130727 | 0.960871301093464 |
| 42 | 0.0380835012071680 | 0.0761670024143361 | 0.961916498792832 |
| 43 | 0.072929672700523 | 0.145859345401046 | 0.927070327299477 |
| 44 | 0.396013244199629 | 0.792026488399257 | 0.603986755800371 |
| Meta Analysis of Goldfeld-Quandt test for Heteroskedasticity | |||
| Description | # significant tests | % significant tests | OK/NOK |
| 1% type I error level | 5 | 0.172413793103448 | NOK |
| 5% type I error level | 8 | 0.275862068965517 | NOK |
| 10% type I error level | 16 | 0.551724137931034 | NOK |