| Multiple Linear Regression - Estimated Regression Equation |
| Y[t] = + 5272.08916666666 -5964.88333333334X[t] + 2128.74684722222M1[t] + 2147.04786111111M2[t] + 1957.28287500000M3[t] + 2053.99188888889M4[t] + 1806.99490277778M5[t] + 1344.14391666667M6[t] + 988.842930555555M7[t] + 763.891944444445M8[t] + 741.208958333335M9[t] + 367.093972222224M10[t] + 69.474986111113M11[t] + 173.856986111111t + e[t] |
| Multiple Linear Regression - Ordinary Least Squares | |||||
| Variable | Parameter | S.D. | T-STAT H0: parameter = 0 | 2-tail p-value | 1-tail p-value |
| (Intercept) | 5272.08916666666 | 677.476199 | 7.782 | 0 | 0 |
| X | -5964.88333333334 | 556.882005 | -10.7112 | 0 | 0 |
| M1 | 2128.74684722222 | 785.030268 | 2.7117 | 0.009382 | 0.004691 |
| M2 | 2147.04786111111 | 782.722481 | 2.7431 | 0.008647 | 0.004323 |
| M3 | 1957.28287500000 | 780.628605 | 2.5073 | 0.015759 | 0.00788 |
| M4 | 2053.99188888889 | 778.750365 | 2.6375 | 0.011354 | 0.005677 |
| M5 | 1806.99490277778 | 777.089325 | 2.3253 | 0.024519 | 0.01226 |
| M6 | 1344.14391666667 | 775.646879 | 1.7329 | 0.089808 | 0.044904 |
| M7 | 988.842930555555 | 774.424249 | 1.2769 | 0.208055 | 0.104027 |
| M8 | 763.891944444445 | 773.422478 | 0.9877 | 0.328478 | 0.164239 |
| M9 | 741.208958333335 | 772.642425 | 0.9593 | 0.342414 | 0.171207 |
| M10 | 367.093972222224 | 772.084762 | 0.4755 | 0.636711 | 0.318355 |
| M11 | 69.474986111113 | 771.74997 | 0.09 | 0.92866 | 0.46433 |
| t | 173.856986111111 | 13.125835 | 13.2454 | 0 | 0 |
| Multiple Linear Regression - Regression Statistics | |
| Multiple R | 0.893031005209968 |
| R-squared | 0.797504376266327 |
| Adjusted R-squared | 0.74027735216768 |
| F-TEST (value) | 13.9358002417110 |
| F-TEST (DF numerator) | 13 |
| F-TEST (DF denominator) | 46 |
| p-value | 7.49089679175086e-12 |
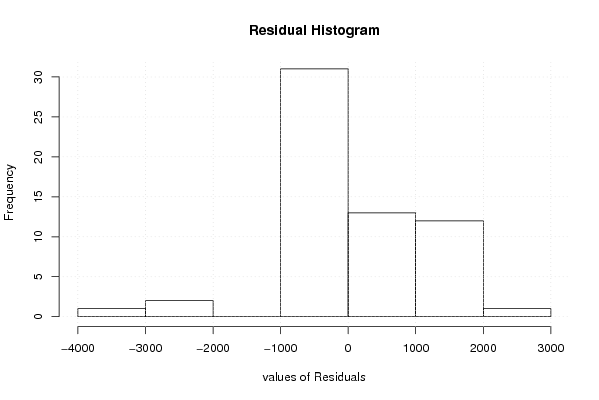
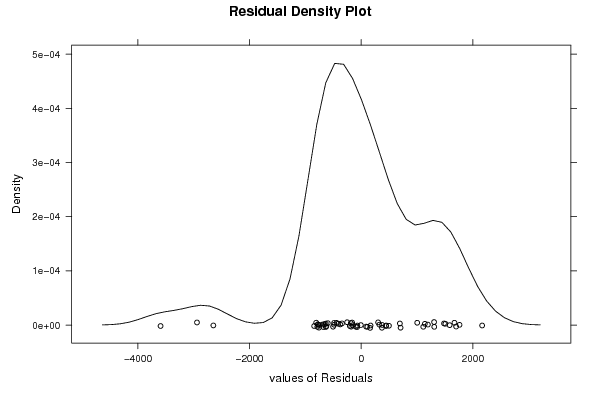
| Multiple Linear Regression - Residual Statistics | |
| Residual Standard Deviation | 1220.06734362336 |
| Sum Squared Residuals | 68473958.8569033 |
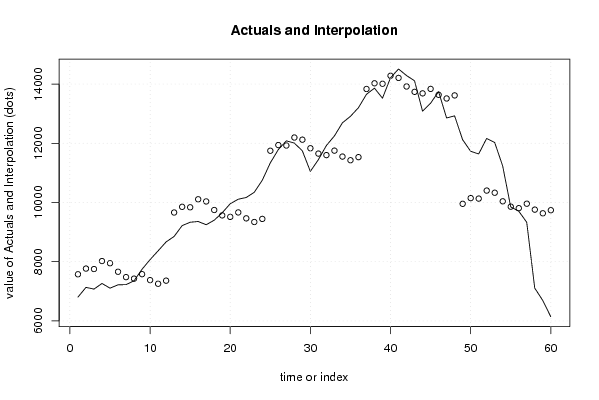
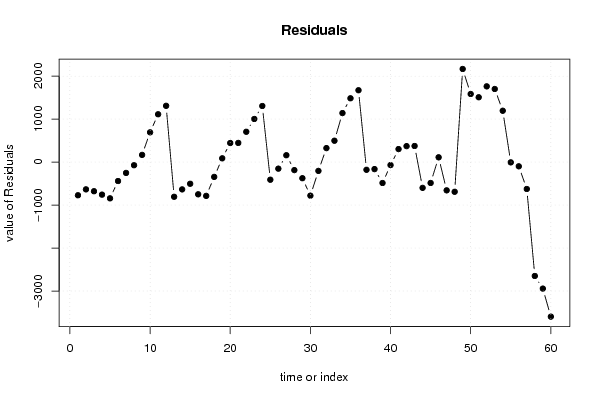
| Multiple Linear Regression - Actuals, Interpolation, and Residuals | |||
| Time or Index | Actuals | Interpolation Forecast | Residuals Prediction Error |
| 1 | 6802.96 | 7574.693 | -771.733000000007 |
| 2 | 7132.68 | 7766.85099999999 | -634.17099999999 |
| 3 | 7073.29 | 7750.943 | -677.653000000002 |
| 4 | 7264.5 | 8021.509 | -757.009000000002 |
| 5 | 7105.33 | 7948.369 | -843.038999999994 |
| 6 | 7218.71 | 7659.375 | -440.664999999997 |
| 7 | 7225.72 | 7477.931 | -252.211000000003 |
| 8 | 7354.25 | 7426.837 | -72.587000000002 |
| 9 | 7745.46 | 7578.011 | 167.448999999999 |
| 10 | 8070.26 | 7377.753 | 692.507 |
| 11 | 8366.33 | 7253.991 | 1112.33900000000 |
| 12 | 8667.51 | 7358.373 | 1309.137 |
| 13 | 8854.34 | 9660.97683333333 | -806.63683333333 |
| 14 | 9218.1 | 9853.13483333334 | -635.034833333337 |
| 15 | 9332.9 | 9837.22683333333 | -504.326833333334 |
| 16 | 9358.31 | 10107.7928333333 | -749.482833333333 |
| 17 | 9248.66 | 10034.6528333333 | -785.992833333336 |
| 18 | 9401.2 | 9745.65883333333 | -344.458833333333 |
| 19 | 9652.04 | 9564.21483333333 | 87.8251666666692 |
| 20 | 9957.38 | 9513.12083333333 | 444.259166666666 |
| 21 | 10110.63 | 9664.29483333333 | 446.335166666666 |
| 22 | 10169.26 | 9464.03683333333 | 705.223166666666 |
| 23 | 10343.78 | 9340.27483333333 | 1003.50516666667 |
| 24 | 10750.21 | 9444.65683333333 | 1305.55316666667 |
| 25 | 11337.5 | 11747.2606666667 | -409.760666666666 |
| 26 | 11786.96 | 11939.4186666667 | -152.458666666669 |
| 27 | 12083.04 | 11923.5106666667 | 159.529333333334 |
| 28 | 12007.74 | 12194.0766666667 | -186.336666666666 |
| 29 | 11745.93 | 12120.9366666667 | -375.006666666669 |
| 30 | 11051.51 | 11831.9426666667 | -780.432666666666 |
| 31 | 11445.9 | 11650.4986666667 | -204.598666666665 |
| 32 | 11924.88 | 11599.4046666667 | 325.475333333333 |
| 33 | 12247.63 | 11750.5786666667 | 497.051333333333 |
| 34 | 12690.91 | 11550.3206666667 | 1140.58933333333 |
| 35 | 12910.7 | 11426.5586666667 | 1484.14133333333 |
| 36 | 13202.12 | 11530.9406666667 | 1671.17933333334 |
| 37 | 13654.67 | 13833.5445 | -178.874499999998 |
| 38 | 13862.82 | 14025.7025 | -162.882500000002 |
| 39 | 13523.93 | 14009.7945 | -485.864499999999 |
| 40 | 14211.17 | 14280.3605 | -69.1904999999997 |
| 41 | 14510.35 | 14207.2205 | 303.129499999998 |
| 42 | 14289.23 | 13918.2265 | 371.003499999998 |
| 43 | 14111.82 | 13736.7825 | 375.037499999999 |
| 44 | 13086.59 | 13685.6885 | -599.098499999999 |
| 45 | 13351.54 | 13836.8625 | -485.322499999999 |
| 46 | 13747.69 | 13636.6045 | 111.085500000001 |
| 47 | 12855.61 | 13512.8425 | -657.2325 |
| 48 | 12926.93 | 13617.2245 | -690.294499999998 |
| 49 | 12121.95 | 9954.945 | 2167.005 |
| 50 | 11731.65 | 10147.103 | 1584.54700000000 |
| 51 | 11639.51 | 10131.195 | 1508.315 |
| 52 | 12163.78 | 10401.761 | 1762.019 |
| 53 | 12029.53 | 10328.621 | 1700.90900000000 |
| 54 | 11234.18 | 10039.627 | 1194.553 |
| 55 | 9852.13 | 9858.183 | -6.05299999999912 |
| 56 | 9709.04 | 9807.089 | -98.0489999999993 |
| 57 | 9332.75 | 9958.263 | -625.513 |
| 58 | 7108.6 | 9758.005 | -2649.405 |
| 59 | 6691.49 | 9634.243 | -2942.753 |
| 60 | 6143.05 | 9738.625 | -3595.575 |
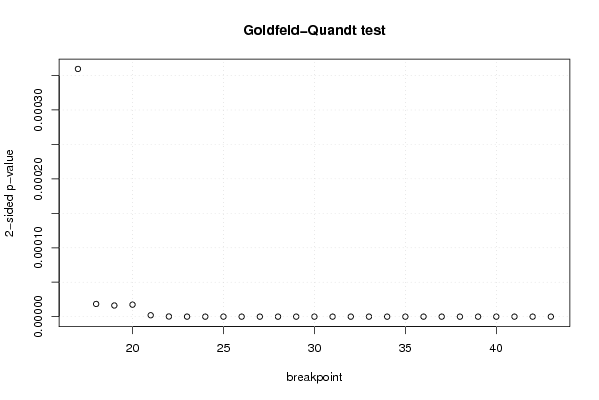
| Goldfeld-Quandt test for Heteroskedasticity | |||
| p-values | Alternative Hypothesis | ||
| breakpoint index | greater | 2-sided | less |
| 17 | 0.000179765772587634 | 0.000359531545175267 | 0.999820234227412 |
| 18 | 9.20222302826022e-06 | 1.84044460565204e-05 | 0.999990797776972 |
| 19 | 8.10799139000903e-06 | 1.62159827800181e-05 | 0.99999189200861 |
| 20 | 8.69442663901354e-06 | 1.73888532780271e-05 | 0.99999130557336 |
| 21 | 1.01545632111591e-06 | 2.03091264223182e-06 | 0.999998984543679 |
| 22 | 1.18315219048744e-07 | 2.36630438097488e-07 | 0.99999988168478 |
| 23 | 2.31893599842789e-08 | 4.63787199685578e-08 | 0.99999997681064 |
| 24 | 2.82074966342616e-09 | 5.64149932685231e-09 | 0.99999999717925 |
| 25 | 6.07586489954362e-10 | 1.21517297990872e-09 | 0.999999999392414 |
| 26 | 1.84531909274842e-10 | 3.69063818549684e-10 | 0.999999999815468 |
| 27 | 3.21556725641831e-10 | 6.43113451283662e-10 | 0.999999999678443 |
| 28 | 9.07529960694118e-11 | 1.81505992138824e-10 | 0.999999999909247 |
| 29 | 2.40582355739146e-11 | 4.81164711478292e-11 | 0.999999999975942 |
| 30 | 1.15014333894896e-09 | 2.30028667789793e-09 | 0.999999998849857 |
| 31 | 1.51049312705473e-09 | 3.02098625410946e-09 | 0.999999998489507 |
| 32 | 5.40876349878247e-10 | 1.08175269975649e-09 | 0.999999999459124 |
| 33 | 2.17096364193548e-10 | 4.34192728387097e-10 | 0.999999999782904 |
| 34 | 5.72486400880437e-11 | 1.14497280176087e-10 | 0.999999999942751 |
| 35 | 1.08675399480315e-11 | 2.17350798960630e-11 | 0.999999999989132 |
| 36 | 1.62566723601535e-12 | 3.2513344720307e-12 | 0.999999999998374 |
| 37 | 1.04386890194342e-12 | 2.08773780388684e-12 | 0.999999999998956 |
| 38 | 4.43512258823131e-13 | 8.87024517646263e-13 | 0.999999999999556 |
| 39 | 3.46982349626026e-12 | 6.93964699252052e-12 | 0.99999999999653 |
| 40 | 1.07893202078003e-11 | 2.15786404156006e-11 | 0.99999999998921 |
| 41 | 5.43990873048885e-10 | 1.08798174609777e-09 | 0.99999999945601 |
| 42 | 9.44124944719725e-09 | 1.88824988943945e-08 | 0.99999999055875 |
| 43 | 4.66544290133591e-09 | 9.33088580267181e-09 | 0.999999995334557 |
| Meta Analysis of Goldfeld-Quandt test for Heteroskedasticity | |||
| Description | # significant tests | % significant tests | OK/NOK |
| 1% type I error level | 27 | 1 | NOK |
| 5% type I error level | 27 | 1 | NOK |
| 10% type I error level | 27 | 1 | NOK |