| Multiple Linear Regression - Estimated Regression Equation |
| Y[t] = + 295.989857812736 + 2.19348434427469X[t] + e[t] |
| Multiple Linear Regression - Ordinary Least Squares | |||||
| Variable | Parameter | S.D. | T-STAT H0: parameter = 0 | 2-tail p-value | 1-tail p-value |
| (Intercept) | 295.989857812736 | 14.664053 | 20.1847 | 0 | 0 |
| X | 2.19348434427469 | 0.122304 | 17.9347 | 0 | 0 |
| Multiple Linear Regression - Regression Statistics | |
| Multiple R | 0.920450295083232 |
| R-squared | 0.84722874571881 |
| Adjusted R-squared | 0.84459475857603 |
| F-TEST (value) | 321.652574516703 |
| F-TEST (DF numerator) | 1 |
| F-TEST (DF denominator) | 58 |
| p-value | 0 |
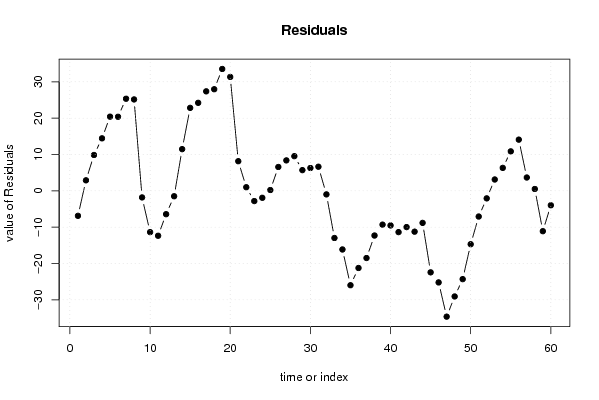
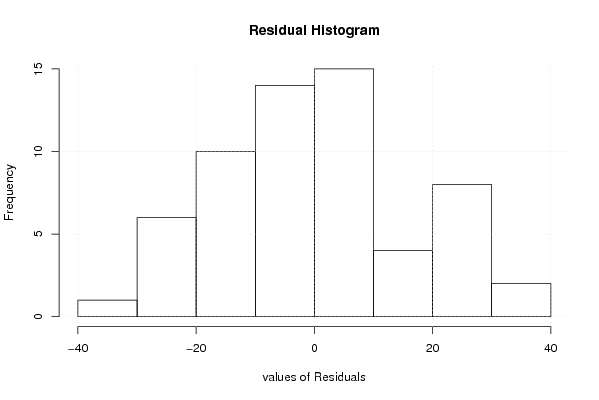
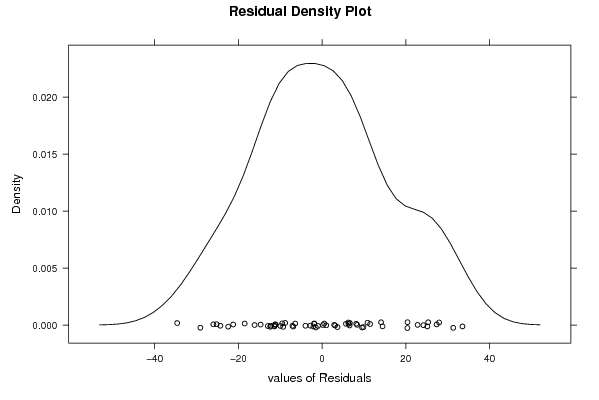
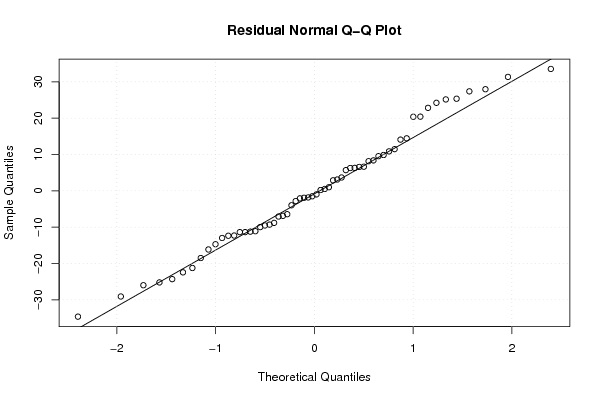
| Multiple Linear Regression - Residual Statistics | |
| Residual Standard Deviation | 16.2389882592519 |
| Sum Squared Residuals | 15294.874901679 |
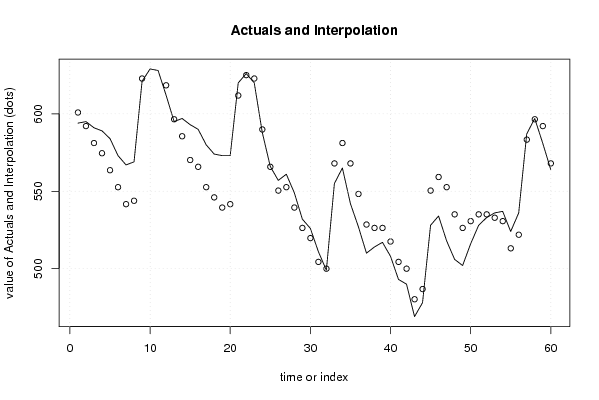
| Multiple Linear Regression - Actuals, Interpolation, and Residuals | |||
| Time or Index | Actuals | Interpolation Forecast | Residuals Prediction Error |
| 1 | 594 | 600.884181666918 | -6.8841816669177 |
| 2 | 595 | 592.11024428982 | 2.88975571017992 |
| 3 | 591 | 581.142822568447 | 9.85717743155344 |
| 4 | 589 | 574.562369535622 | 14.4376304643775 |
| 5 | 584 | 563.594947814249 | 20.405052185751 |
| 6 | 573 | 552.627526092876 | 20.3724739071245 |
| 7 | 567 | 541.660104371502 | 25.3398956284979 |
| 8 | 569 | 543.853588715777 | 25.1464112842233 |
| 9 | 621 | 622.819025109666 | -1.81902510966577 |
| 10 | 629 | 640.366899863863 | -11.3668998638633 |
| 11 | 628 | 640.366899863863 | -12.3668998638633 |
| 12 | 612 | 618.432056421116 | -6.43205642111638 |
| 13 | 595 | 596.49721297837 | -1.49721297836942 |
| 14 | 597 | 585.529791256996 | 11.4702087430040 |
| 15 | 593 | 570.175400847073 | 22.8245991529269 |
| 16 | 590 | 565.788432158524 | 24.2115678414763 |
| 17 | 580 | 552.627526092876 | 27.3724739071245 |
| 18 | 574 | 546.047073060051 | 27.9529269399486 |
| 19 | 573 | 539.466620027227 | 33.5333799727726 |
| 20 | 573 | 541.660104371502 | 31.3398956284979 |
| 21 | 620 | 611.851603388292 | 8.1483966117077 |
| 22 | 626 | 625.01250945394 | 0.987490546059543 |
| 23 | 620 | 622.819025109666 | -2.81902510966577 |
| 24 | 588 | 589.916759945545 | -1.91675994554534 |
| 25 | 566 | 565.788432158524 | 0.211567841476303 |
| 26 | 557 | 550.434041748601 | 6.56595825139917 |
| 27 | 561 | 552.627526092876 | 8.37247390712447 |
| 28 | 549 | 539.466620027227 | 9.53337997277264 |
| 29 | 532 | 526.305713961579 | 5.69428603842081 |
| 30 | 526 | 519.725260928755 | 6.2747390712449 |
| 31 | 511 | 504.370870518832 | 6.62912948116776 |
| 32 | 499 | 499.983901830283 | -0.98390183028285 |
| 33 | 555 | 567.981916502798 | -12.9819165027984 |
| 34 | 565 | 581.142822568447 | -16.1428225684466 |
| 35 | 542 | 567.981916502798 | -25.9819165027984 |
| 36 | 527 | 548.240557404326 | -21.2405574043261 |
| 37 | 510 | 528.499198305854 | -18.4991983058539 |
| 38 | 514 | 526.305713961579 | -12.3057139615792 |
| 39 | 517 | 526.305713961579 | -9.30571396157919 |
| 40 | 508 | 517.53177658448 | -9.5317765844804 |
| 41 | 493 | 504.370870518832 | -11.3708705188322 |
| 42 | 490 | 499.983901830283 | -9.98390183028285 |
| 43 | 469 | 480.24254273181 | -11.2425427318106 |
| 44 | 478 | 486.822995764635 | -8.82299576463468 |
| 45 | 528 | 550.434041748601 | -22.4340417486008 |
| 46 | 534 | 559.2079791257 | -25.2079791256996 |
| 47 | 518 | 552.627526092876 | -34.6275260928755 |
| 48 | 506 | 535.079651338678 | -29.079651338678 |
| 49 | 502 | 526.305713961579 | -24.3057139615792 |
| 50 | 516 | 530.692682650129 | -14.6926826501286 |
| 51 | 528 | 535.079651338678 | -7.07965133867797 |
| 52 | 533 | 535.079651338678 | -2.07965133867797 |
| 53 | 536 | 532.886166994403 | 3.11383300559673 |
| 54 | 537 | 530.692682650129 | 6.30731734987142 |
| 55 | 524 | 513.144807895931 | 10.8551921040690 |
| 56 | 536 | 521.91874527303 | 14.0812547269702 |
| 57 | 587 | 583.336306912721 | 3.66369308727874 |
| 58 | 597 | 596.49721297837 | 0.502787021630576 |
| 59 | 581 | 592.11024428982 | -11.1102442898200 |
| 60 | 564 | 567.981916502798 | -3.98191650279839 |
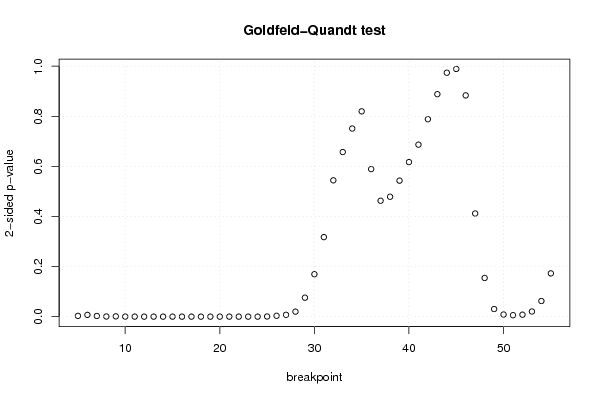
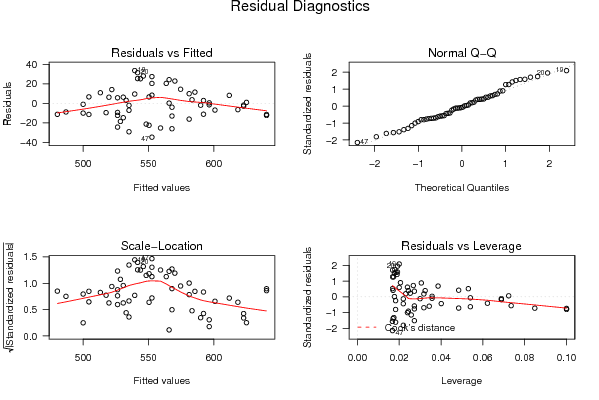
| Goldfeld-Quandt test for Heteroskedasticity | |||
| p-values | Alternative Hypothesis | ||
| breakpoint index | greater | 2-sided | less |
| 5 | 0.00150816497513730 | 0.00301632995027460 | 0.998491835024863 |
| 6 | 0.00353797580830073 | 0.00707595161660145 | 0.9964620241917 |
| 7 | 0.00136014244386616 | 0.00272028488773233 | 0.998639857556134 |
| 8 | 0.000329924873886748 | 0.000659849747773496 | 0.999670075126113 |
| 9 | 0.000604093640244319 | 0.00120818728048864 | 0.999395906359756 |
| 10 | 0.000173797636251672 | 0.000347595272503343 | 0.999826202363748 |
| 11 | 4.20460973741466e-05 | 8.40921947482933e-05 | 0.999957953902626 |
| 12 | 1.03873661505277e-05 | 2.07747323010555e-05 | 0.99998961263385 |
| 13 | 5.38679202537246e-06 | 1.07735840507449e-05 | 0.999994613207975 |
| 14 | 1.89827393233831e-06 | 3.79654786467663e-06 | 0.999998101726068 |
| 15 | 4.22451908174427e-06 | 8.44903816348855e-06 | 0.999995775480918 |
| 16 | 5.4025931050441e-06 | 1.08051862100882e-05 | 0.999994597406895 |
| 17 | 4.0188041111402e-06 | 8.0376082222804e-06 | 0.99999598119589 |
| 18 | 2.59973881449693e-06 | 5.19947762899386e-06 | 0.999997400261186 |
| 19 | 4.20728308965899e-06 | 8.41456617931797e-06 | 0.99999579271691 |
| 20 | 7.3606063258039e-06 | 1.47212126516078e-05 | 0.999992639393674 |
| 21 | 2.14644127143787e-05 | 4.29288254287574e-05 | 0.999978535587286 |
| 22 | 2.14307786120394e-05 | 4.28615572240789e-05 | 0.999978569221388 |
| 23 | 9.01847660517522e-06 | 1.80369532103504e-05 | 0.999990981523395 |
| 24 | 2.22718507655450e-05 | 4.45437015310900e-05 | 0.999977728149234 |
| 25 | 0.000354156788832783 | 0.000708313577665566 | 0.999645843211167 |
| 26 | 0.00173943589879551 | 0.00347887179759102 | 0.998260564101205 |
| 27 | 0.00366197234927203 | 0.00732394469854406 | 0.996338027650728 |
| 28 | 0.00998389881270964 | 0.0199677976254193 | 0.99001610118729 |
| 29 | 0.0378777010563375 | 0.075755402112675 | 0.962122298943662 |
| 30 | 0.0847317655014376 | 0.169463531002875 | 0.915268234498562 |
| 31 | 0.158788945262687 | 0.317577890525375 | 0.841211054737313 |
| 32 | 0.272186388663840 | 0.544372777327679 | 0.72781361133616 |
| 33 | 0.32865293619586 | 0.65730587239172 | 0.67134706380414 |
| 34 | 0.375591516952235 | 0.75118303390447 | 0.624408483047765 |
| 35 | 0.590107057977864 | 0.819785884044272 | 0.409892942022136 |
| 36 | 0.705418254156091 | 0.589163491687819 | 0.294581745843909 |
| 37 | 0.768565162019142 | 0.462869675961717 | 0.231434837980858 |
| 38 | 0.760610842408552 | 0.478778315182896 | 0.239389157591448 |
| 39 | 0.728466787781028 | 0.543066424437943 | 0.271533212218972 |
| 40 | 0.691354027496877 | 0.617291945006246 | 0.308645972503123 |
| 41 | 0.656646093765286 | 0.686707812469428 | 0.343353906234714 |
| 42 | 0.605805074535818 | 0.788389850928364 | 0.394194925464182 |
| 43 | 0.555846650988652 | 0.888306698022695 | 0.444153349011348 |
| 44 | 0.487019128659022 | 0.974038257318045 | 0.512980871340978 |
| 45 | 0.50545915898387 | 0.98908168203226 | 0.49454084101613 |
| 46 | 0.558258150034554 | 0.883483699930892 | 0.441741849965446 |
| 47 | 0.794063256927184 | 0.411873486145632 | 0.205936743072816 |
| 48 | 0.922702930283894 | 0.154594139432212 | 0.0772970697161058 |
| 49 | 0.984794193844174 | 0.0304116123116513 | 0.0152058061558256 |
| 50 | 0.99577508070873 | 0.00844983858253842 | 0.00422491929126921 |
| 51 | 0.99707950454876 | 0.00584099090247895 | 0.00292049545123947 |
| 52 | 0.996051080455724 | 0.00789783908855175 | 0.00394891954427587 |
| 53 | 0.989710750497369 | 0.0205784990052627 | 0.0102892495026313 |
| 54 | 0.968844735728933 | 0.062310528542133 | 0.0311552642710665 |
| 55 | 0.913582679578395 | 0.17283464084321 | 0.086417320421605 |
| Meta Analysis of Goldfeld-Quandt test for Heteroskedasticity | |||
| Description | # significant tests | % significant tests | OK/NOK |
| 1% type I error level | 26 | 0.509803921568627 | NOK |
| 5% type I error level | 29 | 0.568627450980392 | NOK |
| 10% type I error level | 31 | 0.607843137254902 | NOK |