| Multiple Linear Regression - Estimated Regression Equation |
| wkl[t] = + 356.359058985737 + 0.0361691651132457bvg[t] + 8.56292555607903M1[t] + 4.52298938484529M2[t] + 9.20429259096884M3[t] + 6.34447970174317M4[t] + 17.7168814951074M5[t] + 7.72003391933123M6[t] -2.02485392329182M7[t] -1.57777765723701M8[t] -7.0784462199644M9[t] + 15.7665893416910M10[t] + 19.1439730815084M11[t] + e[t] |
| Multiple Linear Regression - Ordinary Least Squares | |||||
| Variable | Parameter | S.D. | T-STAT H0: parameter = 0 | 2-tail p-value | 1-tail p-value |
| (Intercept) | 356.359058985737 | 32.20814 | 11.0643 | 0 | 0 |
| bvg | 0.0361691651132457 | 0.01276 | 2.8346 | 0.006695 | 0.003348 |
| M1 | 8.56292555607903 | 16.386103 | 0.5226 | 0.603676 | 0.301838 |
| M2 | 4.52298938484529 | 17.322916 | 0.2611 | 0.795133 | 0.397567 |
| M3 | 9.20429259096884 | 17.231166 | 0.5342 | 0.595693 | 0.297846 |
| M4 | 6.34447970174317 | 16.749714 | 0.3788 | 0.706521 | 0.35326 |
| M5 | 17.7168814951074 | 17.943204 | 0.9874 | 0.328404 | 0.164202 |
| M6 | 7.72003391933123 | 17.242416 | 0.4477 | 0.656359 | 0.328179 |
| M7 | -2.02485392329182 | 16.703121 | -0.1212 | 0.904018 | 0.452009 |
| M8 | -1.57777765723701 | 17.052526 | -0.0925 | 0.926666 | 0.463333 |
| M9 | -7.0784462199644 | 16.667794 | -0.4247 | 0.672969 | 0.336484 |
| M10 | 15.7665893416910 | 16.78322 | 0.9394 | 0.352216 | 0.176108 |
| M11 | 19.1439730815084 | 16.922399 | 1.1313 | 0.263558 | 0.131779 |
| Multiple Linear Regression - Regression Statistics | |
| Multiple R | 0.448758728566603 |
| R-squared | 0.201384396464714 |
| Adjusted R-squared | 0.00173049558089289 |
| F-TEST (value) | 1.00866747693500 |
| F-TEST (DF numerator) | 12 |
| F-TEST (DF denominator) | 48 |
| p-value | 0.455970418781994 |
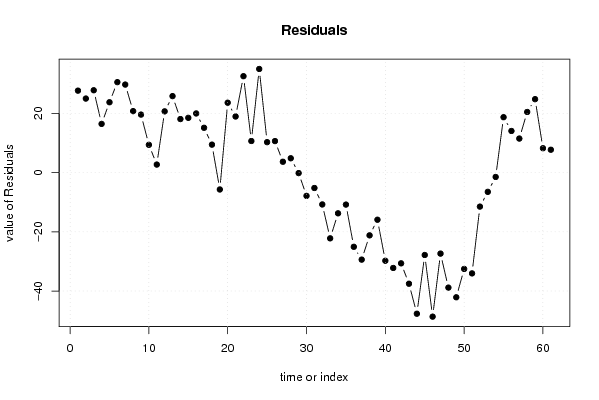
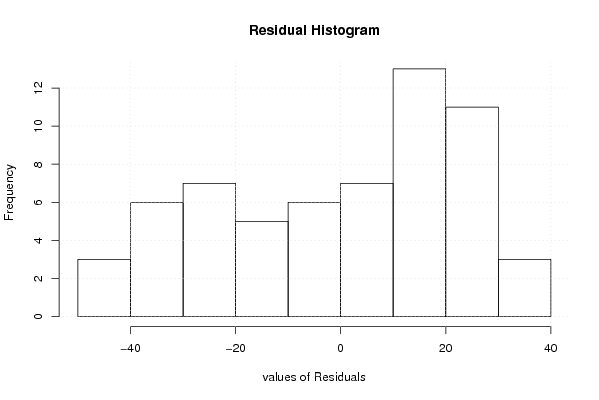
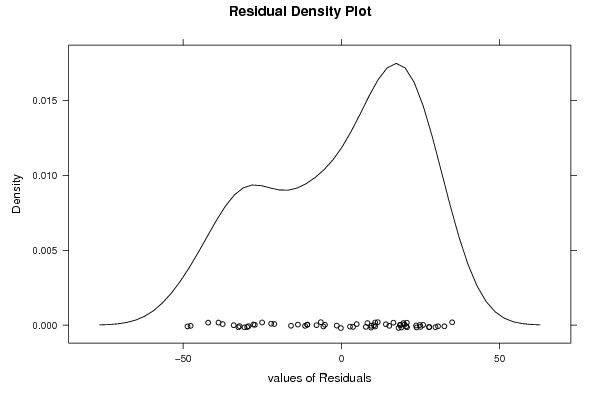
| Multiple Linear Regression - Residual Statistics | |
| Residual Standard Deviation | 26.1987945445670 |
| Sum Squared Residuals | 32946.0881082447 |
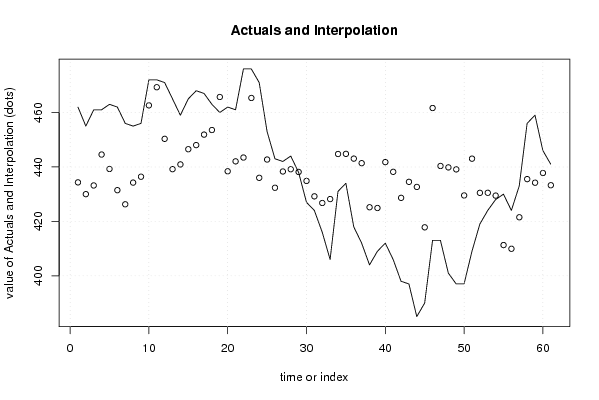
| Multiple Linear Regression - Actuals, Interpolation, and Residuals | |||
| Time or Index | Actuals | Interpolation Forecast | Residuals Prediction Error |
| 1 | 462 | 434.330612394134 | 27.6693876058664 |
| 2 | 455 | 430.001322901995 | 24.9986770980054 |
| 3 | 461 | 433.199690338475 | 27.8003096615250 |
| 4 | 461 | 444.554359338755 | 16.4456406612451 |
| 5 | 463 | 439.252776014913 | 23.7472239850872 |
| 6 | 462 | 431.462247511045 | 30.5377524889553 |
| 7 | 456 | 426.274674472691 | 29.7253255273094 |
| 8 | 455 | 434.2449370823 | 20.7550629176995 |
| 9 | 456 | 436.412131523581 | 19.5878684764188 |
| 10 | 472 | 462.620899440768 | 9.37910055923155 |
| 11 | 472 | 469.289677205891 | 2.71032279410877 |
| 12 | 471 | 450.326549949949 | 20.6734500500510 |
| 13 | 465 | 439.177280519309 | 25.8227194806908 |
| 14 | 459 | 440.924410766195 | 18.0755892338053 |
| 15 | 465 | 446.509943100149 | 18.4900568998505 |
| 16 | 468 | 448.026599189626 | 19.9734008103735 |
| 17 | 467 | 451.875814639436 | 15.1241853605644 |
| 18 | 463 | 453.561607395238 | 9.43839260476218 |
| 19 | 460 | 465.699064446128 | -5.69906444612843 |
| 20 | 462 | 438.404391070324 | 23.5956089296762 |
| 21 | 461 | 442.054521281248 | 18.9454787187525 |
| 22 | 476 | 443.451241930748 | 32.5487580692518 |
| 23 | 476 | 465.347238208547 | 10.6527617914526 |
| 24 | 471 | 436.003560565104 | 34.9964394348962 |
| 25 | 453 | 442.721858700407 | 10.2781412995928 |
| 26 | 443 | 432.352318634356 | 10.6476813656445 |
| 27 | 442 | 438.335711784556 | 3.66428821544409 |
| 28 | 444 | 439.165153736881 | 4.8348462631187 |
| 29 | 438 | 438.167701061515 | -0.167701061515477 |
| 30 | 427 | 434.86214903169 | -7.86214903168978 |
| 31 | 424 | 429.204376846864 | -5.2043768468635 |
| 32 | 416 | 426.757919903859 | -10.7579199038586 |
| 33 | 406 | 428.201731042874 | -22.2017310428744 |
| 34 | 431 | 444.753331874825 | -13.7533318748251 |
| 35 | 434 | 444.803152424224 | -10.8031524242238 |
| 36 | 418 | 443.056547762187 | -25.0565477621867 |
| 37 | 412 | 441.383599591217 | -29.3835995912172 |
| 38 | 404 | 425.190823941933 | -21.1908239419329 |
| 39 | 409 | 424.916951527542 | -15.9169515275417 |
| 40 | 412 | 441.769333625035 | -29.769333625035 |
| 41 | 406 | 438.203870226629 | -32.2038702266287 |
| 42 | 398 | 428.641052632212 | -30.6410526322115 |
| 43 | 397 | 434.521244118511 | -37.5212441185106 |
| 44 | 385 | 432.653493817318 | -47.6534938173177 |
| 45 | 390 | 417.821180655373 | -27.8211806553729 |
| 46 | 413 | 461.644331982711 | -48.6443319827108 |
| 47 | 413 | 440.354345115295 | -27.3543451152946 |
| 48 | 401 | 439.837492067108 | -38.8374920671078 |
| 49 | 397 | 439.104942189083 | -42.1049421890827 |
| 50 | 397 | 429.531123755522 | -32.5311237555223 |
| 51 | 409 | 443.037703249278 | -34.0377032492779 |
| 52 | 419 | 430.484554109702 | -11.4845541097023 |
| 53 | 424 | 430.499838057507 | -6.49983805750738 |
| 54 | 428 | 429.472943429816 | -1.47294342981616 |
| 55 | 430 | 411.300640115807 | 18.6993598841931 |
| 56 | 424 | 409.939258126199 | 14.0607418738006 |
| 57 | 433 | 421.510435496924 | 11.4895645030760 |
| 58 | 456 | 435.530194770947 | 20.4698052290526 |
| 59 | 459 | 434.205587046043 | 24.7944129539571 |
| 60 | 446 | 437.775849655653 | 8.22415034434721 |
| 61 | 441 | 433.28170660585 | 7.71829339414989 |
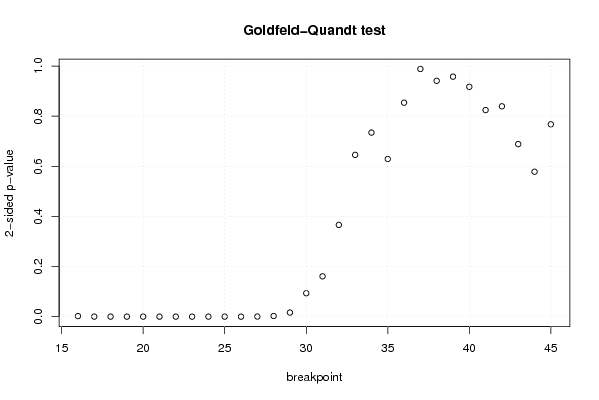
| Goldfeld-Quandt test for Heteroskedasticity | |||
| p-values | Alternative Hypothesis | ||
| breakpoint index | greater | 2-sided | less |
| 16 | 0.00111383901519994 | 0.00222767803039988 | 0.9988861609848 |
| 17 | 9.2964761969175e-05 | 0.00018592952393835 | 0.999907035238031 |
| 18 | 2.85027988114868e-05 | 5.70055976229736e-05 | 0.999971497201188 |
| 19 | 3.55272712958011e-06 | 7.10545425916021e-06 | 0.99999644727287 |
| 20 | 2.04131820005764e-06 | 4.08263640011528e-06 | 0.9999979586818 |
| 21 | 6.05032366324585e-07 | 1.21006473264917e-06 | 0.999999394967634 |
| 22 | 3.57327540352414e-07 | 7.14655080704828e-07 | 0.99999964267246 |
| 23 | 1.77416735414836e-07 | 3.54833470829673e-07 | 0.999999822583265 |
| 24 | 5.33112449775572e-08 | 1.06622489955114e-07 | 0.999999946688755 |
| 25 | 5.02709000663388e-07 | 1.00541800132678e-06 | 0.999999497291 |
| 26 | 7.04174380946219e-06 | 1.40834876189244e-05 | 0.99999295825619 |
| 27 | 0.000231628379451259 | 0.000463256758902518 | 0.999768371620549 |
| 28 | 0.00123781890701027 | 0.00247563781402053 | 0.99876218109299 |
| 29 | 0.00815255594983233 | 0.0163051118996647 | 0.991847444050168 |
| 30 | 0.0467573760150095 | 0.093514752030019 | 0.95324262398499 |
| 31 | 0.0804843016363668 | 0.160968603272734 | 0.919515698363633 |
| 32 | 0.183049811287510 | 0.366099622575019 | 0.81695018871249 |
| 33 | 0.322872119172126 | 0.645744238344253 | 0.677127880827874 |
| 34 | 0.367262172366226 | 0.734524344732453 | 0.632737827633774 |
| 35 | 0.314648911409605 | 0.629297822819209 | 0.685351088590395 |
| 36 | 0.426973330048694 | 0.853946660097387 | 0.573026669951306 |
| 37 | 0.494309231534686 | 0.988618463069372 | 0.505690768465314 |
| 38 | 0.470609296367544 | 0.941218592735088 | 0.529390703632456 |
| 39 | 0.47889719546208 | 0.95779439092416 | 0.52110280453792 |
| 40 | 0.458652907353971 | 0.917305814707941 | 0.541347092646029 |
| 41 | 0.412219952982272 | 0.824439905964543 | 0.587780047017728 |
| 42 | 0.419750490326861 | 0.839500980653722 | 0.580249509673139 |
| 43 | 0.344311163653681 | 0.688622327307363 | 0.655688836346319 |
| 44 | 0.289228983478521 | 0.578457966957041 | 0.71077101652148 |
| 45 | 0.383858990299359 | 0.767717980598718 | 0.616141009700641 |
| Meta Analysis of Goldfeld-Quandt test for Heteroskedasticity | |||
| Description | # significant tests | % significant tests | OK/NOK |
| 1% type I error level | 13 | 0.433333333333333 | NOK |
| 5% type I error level | 14 | 0.466666666666667 | NOK |
| 10% type I error level | 15 | 0.5 | NOK |