| Multiple Linear Regression - Estimated Regression Equation |
| Y[t] = + 4034.67414588099 -212.018661728933X[t] + 149.111280543151M1[t] -155.569382420216M2[t] + 125.531550666231M3[t] + 18.9031937939464M4[t] + 42.8421256459596M5[t] + 429.378880296264M6[t] -10.3214307325519M7[t] -131.409330864466M8[t] -134.291943506517M9[t] + 94.7117888392695M10[t] -220.682612642051M11[t] + e[t] |
| Multiple Linear Regression - Ordinary Least Squares | |||||
| Variable | Parameter | S.D. | T-STAT H0: parameter = 0 | 2-tail p-value | 1-tail p-value |
| (Intercept) | 4034.67414588099 | 453.024601 | 8.9061 | 0 | 0 |
| X | -212.018661728933 | 52.75716 | -4.0188 | 0.000183 | 9.1e-05 |
| M1 | 149.111280543151 | 167.757815 | 0.8888 | 0.378027 | 0.189013 |
| M2 | -155.569382420216 | 173.688078 | -0.8957 | 0.374398 | 0.187199 |
| M3 | 125.531550666231 | 173.017748 | 0.7255 | 0.471253 | 0.235626 |
| M4 | 18.9031937939464 | 170.09019 | 0.1111 | 0.91192 | 0.45596 |
| M5 | 42.8421256459596 | 168.148178 | 0.2548 | 0.799855 | 0.399927 |
| M6 | 429.378880296264 | 167.687287 | 2.5606 | 0.013278 | 0.006639 |
| M7 | -10.3214307325519 | 167.70619 | -0.0615 | 0.951153 | 0.475576 |
| M8 | -131.409330864466 | 177.088114 | -0.7421 | 0.461269 | 0.230634 |
| M9 | -134.291943506517 | 178.337931 | -0.753 | 0.454709 | 0.227354 |
| M10 | 94.7117888392695 | 176.644335 | 0.5362 | 0.594041 | 0.297021 |
| M11 | -220.682612642051 | 175.268148 | -1.2591 | 0.213405 | 0.106702 |
| Multiple Linear Regression - Regression Statistics | |
| Multiple R | 0.64418846056054 |
| R-squared | 0.414978772719358 |
| Adjusted R-squared | 0.284974055545882 |
| F-TEST (value) | 3.19202857974467 |
| F-TEST (DF numerator) | 12 |
| F-TEST (DF denominator) | 54 |
| p-value | 0.0016767257417023 |
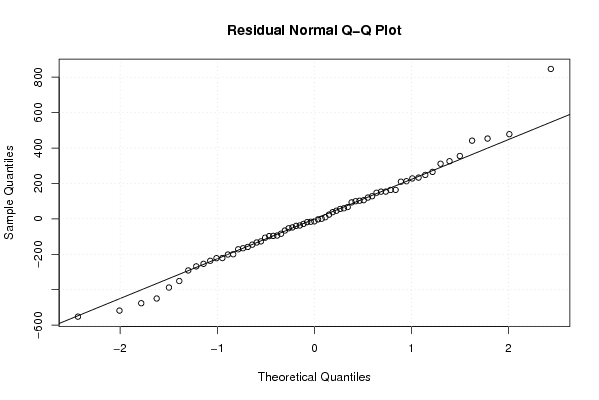
| Multiple Linear Regression - Residual Statistics | |
| Residual Standard Deviation | 276.877096315935 |
| Sum Squared Residuals | 4139690.02907454 |
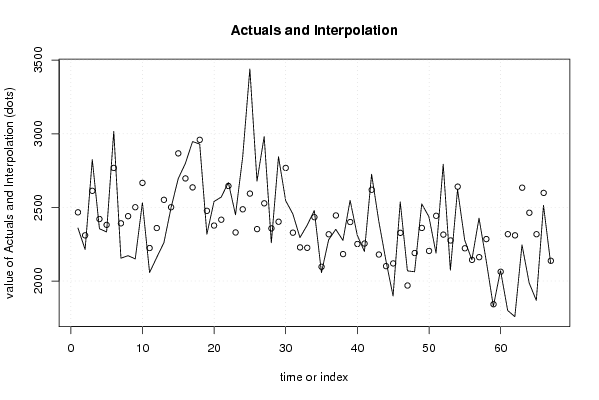
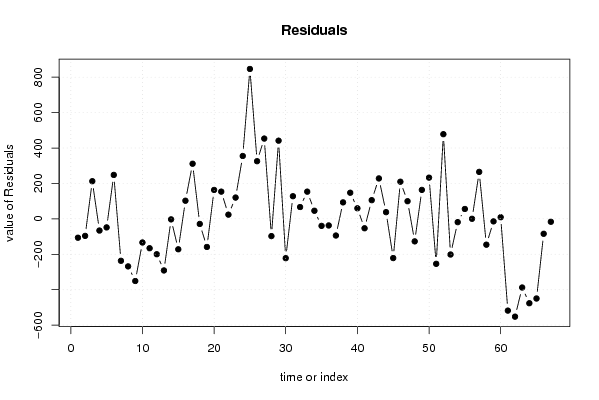
| Multiple Linear Regression - Actuals, Interpolation, and Residuals | |||
| Time or Index | Actuals | Interpolation Forecast | Residuals Prediction Error |
| 1 | 2360 | 2466.43426641978 | -106.434266419778 |
| 2 | 2214 | 2310.16666666667 | -96.1666666666658 |
| 3 | 2825 | 2612.46946592601 | 212.530534073993 |
| 4 | 2355 | 2421.03364436215 | -66.0336443621488 |
| 5 | 2333 | 2381.36697769548 | -48.3669776954822 |
| 6 | 3016 | 2767.90373234579 | 248.096267654213 |
| 7 | 2155 | 2391.80901983565 | -236.809019835651 |
| 8 | 2172 | 2440.33604908688 | -268.336049086882 |
| 9 | 2150 | 2501.05903496351 | -351.059034963512 |
| 10 | 2533 | 2666.45716879062 | -133.457168790618 |
| 11 | 2058 | 2223.85157027194 | -165.851570271939 |
| 12 | 2160 | 2359.72671822242 | -199.726718222416 |
| 13 | 2260 | 2551.24173111135 | -291.241731111353 |
| 14 | 2498 | 2500.98346222271 | -2.98346222270652 |
| 15 | 2695 | 2866.89186000073 | -171.891860000726 |
| 16 | 2799 | 2696.65790460976 | 102.342095390238 |
| 17 | 2947 | 2635.7893717702 | 311.210628229798 |
| 18 | 2930 | 2958.72052790183 | -28.7205279018265 |
| 19 | 2318 | 2476.61648452722 | -158.616484527224 |
| 20 | 2540 | 2376.73045056820 | 163.269549431797 |
| 21 | 2570 | 2416.25157027194 | 153.748429728062 |
| 22 | 2669 | 2645.25530261773 | 23.7446973822750 |
| 23 | 2450 | 2329.86090113641 | 120.139098863595 |
| 24 | 2842 | 2486.93791525978 | 355.062084740224 |
| 25 | 3440 | 2593.64546345714 | 846.35453654286 |
| 26 | 2678 | 2352.57039901245 | 325.429600987547 |
| 27 | 2981 | 2527.66200123443 | 453.337998765567 |
| 28 | 2260 | 2357.42804584347 | -97.4280458434689 |
| 29 | 2844 | 2402.56884386838 | 441.431156131625 |
| 30 | 2546 | 2767.90373234579 | -221.903732345787 |
| 31 | 2456 | 2328.20342131697 | 127.796578683029 |
| 32 | 2295 | 2228.31738735795 | 66.6826126420505 |
| 33 | 2379 | 2225.4347747159 | 153.565225284101 |
| 34 | 2479 | 2433.23664088879 | 45.763359111208 |
| 35 | 2057 | 2096.64037323458 | -39.6403732345787 |
| 36 | 2280 | 2317.32298587663 | -37.3229858766295 |
| 37 | 2351 | 2445.23240024689 | -94.232400246887 |
| 38 | 2276 | 2182.95546962931 | 93.044530370693 |
| 39 | 2548 | 2400.45080419707 | 147.549195802927 |
| 40 | 2311 | 2251.418714979 | 59.5812850209976 |
| 41 | 2201 | 2254.15578065812 | -53.1557806581225 |
| 42 | 2725 | 2619.49066913553 | 105.509330864466 |
| 43 | 2408 | 2179.79035810672 | 228.209641893282 |
| 44 | 2139 | 2101.10619032059 | 37.8938096794103 |
| 45 | 1898 | 2119.42544385143 | -221.425443851432 |
| 46 | 2537 | 2327.22731002433 | 209.772689975674 |
| 47 | 2069 | 1969.42917619722 | 99.570823802781 |
| 48 | 2063 | 2190.11178883927 | -127.111788839270 |
| 49 | 2524 | 2360.42493555531 | 163.575064444686 |
| 50 | 2437 | 2204.1573358022 | 232.842664197800 |
| 51 | 2189 | 2442.85453654286 | -253.85453654286 |
| 52 | 2793 | 2315.02431349768 | 477.975686502318 |
| 53 | 2074 | 2275.35764683102 | -201.357646831016 |
| 54 | 2622 | 2640.69253530843 | -18.6925353084269 |
| 55 | 2278 | 2222.19409045250 | 55.8059095474956 |
| 56 | 2144 | 2143.50992266638 | 0.490077333623784 |
| 57 | 2427 | 2161.82917619722 | 265.170823802781 |
| 58 | 2139 | 2284.82357767854 | -145.823577678539 |
| 59 | 1828 | 1842.21797915986 | -14.2179791598589 |
| 60 | 2072 | 2062.90059180191 | 9.09940819809035 |
| 61 | 1800 | 2318.02120320953 | -518.021203209527 |
| 62 | 1758 | 2310.16666666667 | -552.166666666667 |
| 63 | 2246 | 2633.6713320989 | -387.6713320989 |
| 64 | 1987 | 2463.43737670794 | -476.437376707936 |
| 65 | 1868 | 2317.76137917680 | -449.761379176802 |
| 66 | 2514 | 2598.28880296264 | -84.28880296264 |
| 67 | 2121 | 2137.38662576093 | -16.3866257609312 |
| Goldfeld-Quandt test for Heteroskedasticity | |||
| p-values | Alternative Hypothesis | ||
| breakpoint index | greater | 2-sided | less |
| 16 | 0.243585764529288 | 0.487171529058576 | 0.756414235470712 |
| 17 | 0.255602054878227 | 0.511204109756455 | 0.744397945121773 |
| 18 | 0.206355725446027 | 0.412711450892054 | 0.793644274553973 |
| 19 | 0.127333817143743 | 0.254667634287485 | 0.872666182856257 |
| 20 | 0.155539102904025 | 0.311078205808051 | 0.844460897095975 |
| 21 | 0.200247470969106 | 0.400494941938213 | 0.799752529030894 |
| 22 | 0.137789324294898 | 0.275578648589796 | 0.862210675705102 |
| 23 | 0.113457450162302 | 0.226914900324604 | 0.886542549837698 |
| 24 | 0.165887385911855 | 0.331774771823710 | 0.834112614088145 |
| 25 | 0.775184527400033 | 0.449630945199935 | 0.224815472599967 |
| 26 | 0.792569819531496 | 0.414860360937009 | 0.207430180468504 |
| 27 | 0.867237380298591 | 0.265525239402817 | 0.132762619701409 |
| 28 | 0.816903462334444 | 0.366193075331113 | 0.183096537665556 |
| 29 | 0.91126352784083 | 0.17747294431834 | 0.08873647215917 |
| 30 | 0.890423120252179 | 0.219153759495642 | 0.109576879747821 |
| 31 | 0.869468948953047 | 0.261062102093907 | 0.130531051046953 |
| 32 | 0.82391896602947 | 0.35216206794106 | 0.17608103397053 |
| 33 | 0.786289245297884 | 0.427421509404232 | 0.213710754702116 |
| 34 | 0.724228411633905 | 0.551543176732189 | 0.275771588366095 |
| 35 | 0.653883002726569 | 0.692233994546863 | 0.346116997273431 |
| 36 | 0.611479766146738 | 0.777040467706524 | 0.388520233853262 |
| 37 | 0.57763523212851 | 0.84472953574298 | 0.42236476787149 |
| 38 | 0.493046044798612 | 0.986092089597225 | 0.506953955201388 |
| 39 | 0.430461746397717 | 0.860923492795433 | 0.569538253602283 |
| 40 | 0.353046587211779 | 0.706093174423557 | 0.646953412788221 |
| 41 | 0.313072664583677 | 0.626145329167354 | 0.686927335416323 |
| 42 | 0.244745341111718 | 0.489490682223437 | 0.755254658888282 |
| 43 | 0.207372876098845 | 0.414745752197689 | 0.792627123901155 |
| 44 | 0.143058175088548 | 0.286116350177095 | 0.856941824911452 |
| 45 | 0.166110710453573 | 0.332221420907146 | 0.833889289546427 |
| 46 | 0.158851377101226 | 0.317702754202452 | 0.841148622898774 |
| 47 | 0.137795902344098 | 0.275591804688196 | 0.862204097655902 |
| 48 | 0.0940173949073892 | 0.188034789814778 | 0.905982605092611 |
| 49 | 0.257436976606669 | 0.514873953213338 | 0.74256302339333 |
| 50 | 0.308264046101571 | 0.616528092203142 | 0.691735953898429 |
| 51 | 0.417755435977154 | 0.835510871954307 | 0.582244564022846 |
| Meta Analysis of Goldfeld-Quandt test for Heteroskedasticity | |||
| Description | # significant tests | % significant tests | OK/NOK |
| 1% type I error level | 0 | 0 | OK |
| 5% type I error level | 0 | 0 | OK |
| 10% type I error level | 0 | 0 | OK |