| Multiple Linear Regression - Estimated Regression Equation |
| Y[t] = + 0.519647105611932 + 1.28632287139419X[t] + 0.92813262756989Y1[t] + 0.336764561898729Y2[t] -0.439355918249917Y3[t] + 0.115147021620269Y4[t] + 0.182944690656144M1[t] + 0.332354786967214M2[t] + 0.351787973684101M3[t] + 0.236941355263420M4[t] + 0.445899792676542M5[t] + 0.6150272299015M6[t] + 0.59084113843511M7[t] + 0.333801824039458M8[t] + 0.49230003939364M9[t] + 0.912247008553877M10[t] + 0.618871180476981M11[t] + 0.00823090323162158t + e[t] |
| Multiple Linear Regression - Ordinary Least Squares | |||||
| Variable | Parameter | S.D. | T-STAT H0: parameter = 0 | 2-tail p-value | 1-tail p-value |
| (Intercept) | 0.519647105611932 | 2.087843 | 0.2489 | 0.804785 | 0.402392 |
| X | 1.28632287139419 | 1.823485 | 0.7054 | 0.484851 | 0.242425 |
| Y1 | 0.92813262756989 | 0.16089 | 5.7688 | 1e-06 | 1e-06 |
| Y2 | 0.336764561898729 | 0.202726 | 1.6612 | 0.104908 | 0.052454 |
| Y3 | -0.439355918249917 | 0.205414 | -2.1389 | 0.038933 | 0.019466 |
| Y4 | 0.115147021620269 | 0.152488 | 0.7551 | 0.454831 | 0.227415 |
| M1 | 0.182944690656144 | 1.142351 | 0.1601 | 0.873613 | 0.436807 |
| M2 | 0.332354786967214 | 1.139071 | 0.2918 | 0.772044 | 0.386022 |
| M3 | 0.351787973684101 | 1.134906 | 0.31 | 0.758277 | 0.379138 |
| M4 | 0.236941355263420 | 1.133238 | 0.2091 | 0.8355 | 0.41775 |
| M5 | 0.445899792676542 | 1.13587 | 0.3926 | 0.696836 | 0.348418 |
| M6 | 0.6150272299015 | 1.140329 | 0.5393 | 0.592797 | 0.296399 |
| M7 | 0.59084113843511 | 1.146563 | 0.5153 | 0.609318 | 0.304659 |
| M8 | 0.333801824039458 | 1.156665 | 0.2886 | 0.774464 | 0.387232 |
| M9 | 0.49230003939364 | 1.191888 | 0.413 | 0.681897 | 0.340949 |
| M10 | 0.912247008553877 | 1.187457 | 0.7682 | 0.447095 | 0.223548 |
| M11 | 0.618871180476981 | 1.18309 | 0.5231 | 0.603944 | 0.301972 |
| t | 0.00823090323162158 | 0.018177 | 0.4528 | 0.653248 | 0.326624 |
| Multiple Linear Regression - Regression Statistics | |
| Multiple R | 0.964983665084489 |
| R-squared | 0.931193473879893 |
| Adjusted R-squared | 0.900411606931424 |
| F-TEST (value) | 30.2513643970582 |
| F-TEST (DF numerator) | 17 |
| F-TEST (DF denominator) | 38 |
| p-value | 0 |
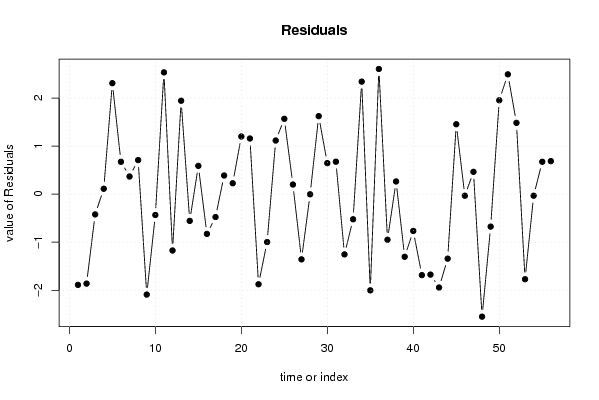
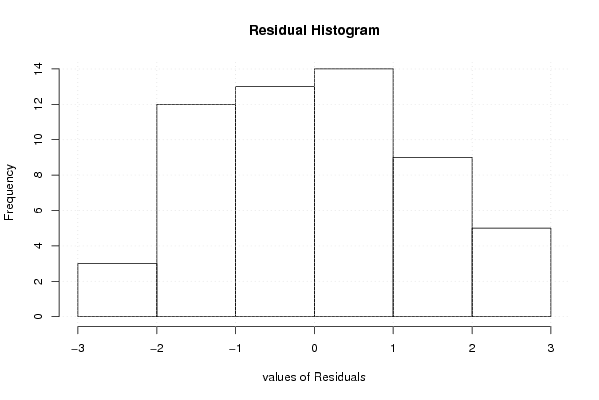
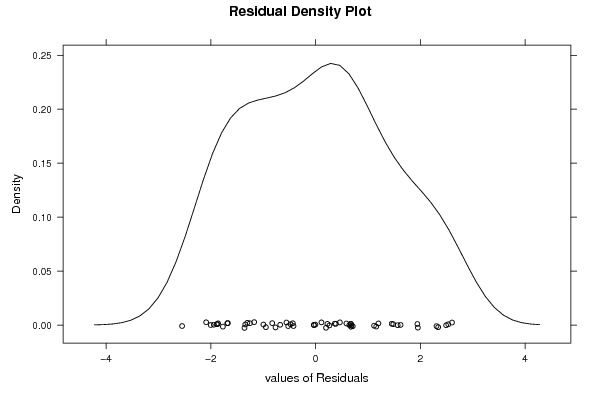
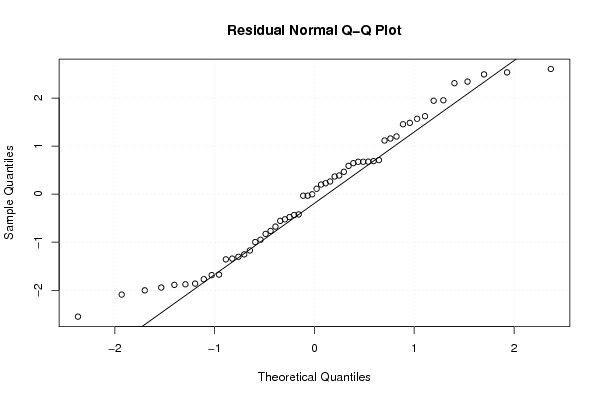
| Multiple Linear Regression - Residual Statistics | |
| Residual Standard Deviation | 1.67073379959745 |
| Sum Squared Residuals | 106.071354306458 |
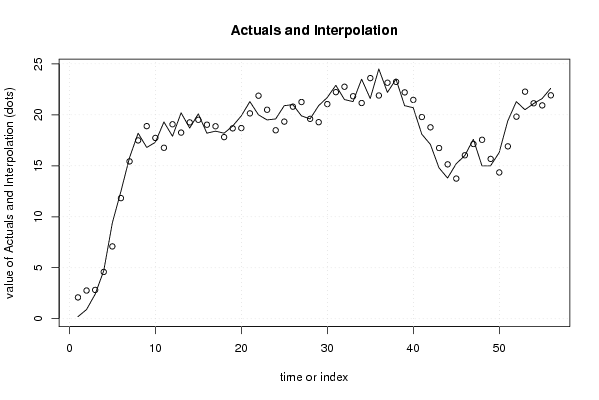
| Multiple Linear Regression - Actuals, Interpolation, and Residuals | |||
| Time or Index | Actuals | Interpolation Forecast | Residuals Prediction Error |
| 1 | 0.2 | 2.08771937194585 | -1.88771937194584 |
| 2 | 0.9 | 2.76125117416827 | -1.86125117416827 |
| 3 | 2.4 | 2.82150938662777 | -0.421509386627771 |
| 4 | 4.7 | 4.58765838639479 | 0.112341613605212 |
| 5 | 9.4 | 7.09109166187532 | 2.30890833812468 |
| 6 | 12.5 | 11.8268008820368 | 0.673199117963227 |
| 7 | 15.8 | 15.4330522006483 | 0.366947799351721 |
| 8 | 18.2 | 17.4909169363030 | 0.709083063697043 |
| 9 | 16.8 | 18.8893521989686 | -2.08935219896863 |
| 10 | 17.3 | 17.7334605781177 | -0.433460578117702 |
| 11 | 19.3 | 16.7664425479462 | 2.53355745205376 |
| 12 | 17.9 | 19.0719009442286 | -1.17190094422856 |
| 13 | 20.2 | 18.2563361939226 | 1.94366380607740 |
| 14 | 18.7 | 19.2560735245281 | -0.556073524528114 |
| 15 | 20.1 | 19.5114894942793 | 0.588510505720713 |
| 16 | 18.2 | 19.0273881725968 | -0.827388172596795 |
| 17 | 18.4 | 18.8764679346185 | -0.476467934618465 |
| 18 | 18.2 | 17.8117813150011 | 0.388218684998854 |
| 19 | 18.9 | 18.6735345885754 | 0.226465411424633 |
| 20 | 19.9 | 18.700415579602 | 1.19958442039798 |
| 21 | 21.3 | 20.1419131070609 | 1.15808689293914 |
| 22 | 20 | 21.8756626728503 | -1.87566267285030 |
| 23 | 19.5 | 20.4966627157067 | -0.996662715706658 |
| 24 | 19.6 | 18.4842109302784 | 1.11578906972161 |
| 25 | 20.9 | 19.3321860299671 | 1.56781397003295 |
| 26 | 21 | 20.8000627325591 | 0.199937267440922 |
| 27 | 19.9 | 21.2568249130978 | -1.35682491309780 |
| 28 | 19.6 | 19.6032917722089 | -0.00329177220886537 |
| 29 | 20.9 | 19.2773558427754 | 1.6226441572246 |
| 30 | 21.7 | 21.0550634427402 | 0.644936557259845 |
| 31 | 22.9 | 22.2245533387223 | 0.675446661277677 |
| 32 | 21.5 | 22.7532089299502 | -1.25320892995017 |
| 33 | 21.3 | 21.8228762377230 | -0.522876237723018 |
| 34 | 23.5 | 21.158847713339 | 2.34115228666101 |
| 35 | 21.6 | 23.6015163682619 | -2.00151636826194 |
| 36 | 24.5 | 21.8949714881926 | 2.6050285118074 |
| 37 | 22.2 | 23.1482666099516 | -0.94826660995159 |
| 38 | 23.5 | 23.2359194878293 | 0.264080512170718 |
| 39 | 20.9 | 22.2026859972483 | -1.3026859972483 |
| 40 | 20.7 | 21.4651643555195 | -0.765164355519465 |
| 41 | 18.1 | 19.7851384662620 | -1.68513846626202 |
| 42 | 17.1 | 18.7740155782133 | -1.67401557821328 |
| 43 | 14.8 | 16.7428288289092 | -1.94282882890921 |
| 44 | 13.8 | 15.1418467955614 | -1.34184679556143 |
| 45 | 15.2 | 13.7458584562475 | 1.45414154375251 |
| 46 | 16 | 16.032029035693 | -0.0320290356930054 |
| 47 | 17.6 | 17.1353783680852 | 0.46462163191484 |
| 48 | 15 | 17.5489166373005 | -2.54891663730046 |
| 49 | 15 | 15.6754917942129 | -0.675491794212917 |
| 50 | 16.3 | 14.3466930809153 | 1.95330691908474 |
| 51 | 19.4 | 16.9074902087468 | 2.49250979125315 |
| 52 | 21.3 | 19.8164973132801 | 1.48350268671991 |
| 53 | 20.5 | 22.2699460944688 | -1.76994609446879 |
| 54 | 21.1 | 21.1323387820086 | -0.0323387820086480 |
| 55 | 21.6 | 20.9260310431448 | 0.67396895685518 |
| 56 | 22.6 | 21.9136117585834 | 0.68638824141658 |
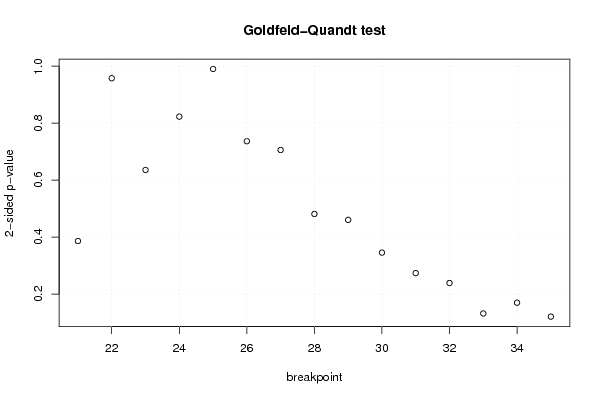
| Goldfeld-Quandt test for Heteroskedasticity | |||
| p-values | Alternative Hypothesis | ||
| breakpoint index | greater | 2-sided | less |
| 21 | 0.19311366928071 | 0.38622733856142 | 0.80688633071929 |
| 22 | 0.478871219971892 | 0.957742439943783 | 0.521128780028108 |
| 23 | 0.682137564780425 | 0.63572487043915 | 0.317862435219575 |
| 24 | 0.588520673848601 | 0.822958652302798 | 0.411479326151399 |
| 25 | 0.495137437679358 | 0.990274875358716 | 0.504862562320642 |
| 26 | 0.368301597361017 | 0.736603194722035 | 0.631698402638983 |
| 27 | 0.35292727849534 | 0.70585455699068 | 0.64707272150466 |
| 28 | 0.24059073375981 | 0.48118146751962 | 0.75940926624019 |
| 29 | 0.230282844508911 | 0.460565689017821 | 0.76971715549109 |
| 30 | 0.172792839693763 | 0.345585679387527 | 0.827207160306237 |
| 31 | 0.136846917334994 | 0.273693834669987 | 0.863153082665006 |
| 32 | 0.119457520440973 | 0.238915040881947 | 0.880542479559027 |
| 33 | 0.0659959104559046 | 0.131991820911809 | 0.934004089544095 |
| 34 | 0.084928085005692 | 0.169856170011384 | 0.915071914994308 |
| 35 | 0.0604199213477978 | 0.120839842695596 | 0.939580078652202 |
| Meta Analysis of Goldfeld-Quandt test for Heteroskedasticity | |||
| Description | # significant tests | % significant tests | OK/NOK |
| 1% type I error level | 0 | 0 | OK |
| 5% type I error level | 0 | 0 | OK |
| 10% type I error level | 0 | 0 | OK |