| Multiple Linear Regression - Estimated Regression Equation |
| TWIB[t] = + 17449.4878192846 + 1308.17632173413GI[t] + 0.99428281596959TWIB1[t] -0.0329312886467168`TWIB2 `[t] -3736.91327370935M1[t] + 7320.3659768742M2[t] + 58676.1756270611M3[t] + 15535.1254686653M4[t] + 557.825793580474M5[t] -6334.55395907056M6[t] -7567.63201795877M7[t] + 11374.1603938179M8[t] + 8282.24218097304M9[t] + 1910.72164777117M10[t] -3066.56991435644M11[t] -170.214815449318t + e[t] |
| Multiple Linear Regression - Ordinary Least Squares | |||||
| Variable | Parameter | S.D. | T-STAT H0: parameter = 0 | 2-tail p-value | 1-tail p-value |
| (Intercept) | 17449.4878192846 | 17152.637454 | 1.0173 | 0.313718 | 0.156859 |
| GI | 1308.17632173413 | 1078.72132 | 1.2127 | 0.230721 | 0.115361 |
| TWIB1 | 0.99428281596959 | 0.143548 | 6.9265 | 0 | 0 |
| `TWIB2 ` | -0.0329312886467168 | 0.140787 | -0.2339 | 0.815975 | 0.407988 |
| M1 | -3736.91327370935 | 3956.796504 | -0.9444 | 0.349318 | 0.174659 |
| M2 | 7320.3659768742 | 3956.301952 | 1.8503 | 0.069955 | 0.034977 |
| M3 | 58676.1756270611 | 4268.734679 | 13.7456 | 0 | 0 |
| M4 | 15535.1254686653 | 9776.578552 | 1.589 | 0.118119 | 0.05906 |
| M5 | 557.825793580474 | 4928.716726 | 0.1132 | 0.910325 | 0.455162 |
| M6 | -6334.55395907056 | 4043.672772 | -1.5665 | 0.123289 | 0.061645 |
| M7 | -7567.63201795877 | 3979.157759 | -1.9018 | 0.062741 | 0.031371 |
| M8 | 11374.1603938179 | 3961.407036 | 2.8712 | 0.005902 | 0.002951 |
| M9 | 8282.24218097304 | 4393.45407 | 1.8851 | 0.065005 | 0.032503 |
| M10 | 1910.72164777117 | 4389.124588 | 0.4353 | 0.665124 | 0.332562 |
| M11 | -3066.56991435644 | 4134.419778 | -0.7417 | 0.461596 | 0.230798 |
| t | -170.214815449318 | 58.669167 | -2.9013 | 0.005437 | 0.002719 |
| Multiple Linear Regression - Regression Statistics | |
| Multiple R | 0.990297707438577 |
| R-squared | 0.980689549358102 |
| Adjusted R-squared | 0.975119227057554 |
| F-TEST (value) | 176.056159131347 |
| F-TEST (DF numerator) | 15 |
| F-TEST (DF denominator) | 52 |
| p-value | 0 |
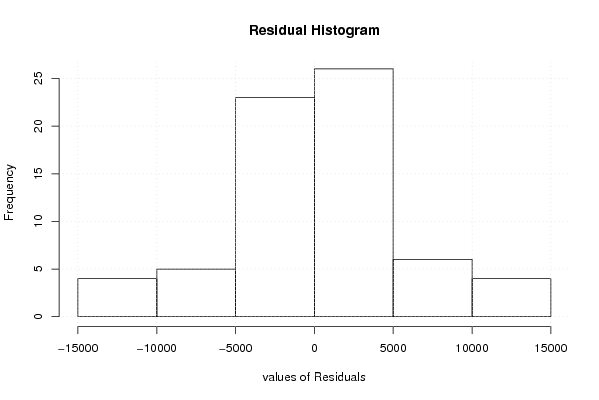
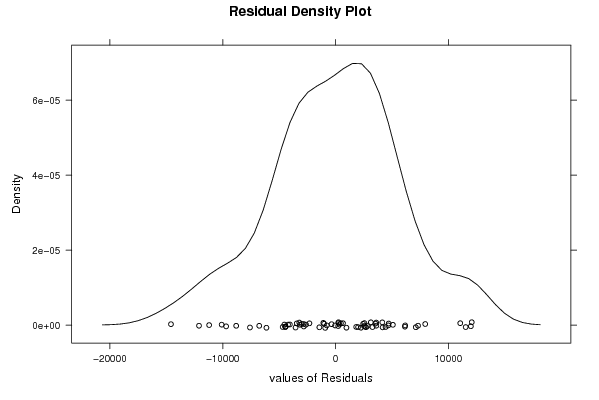
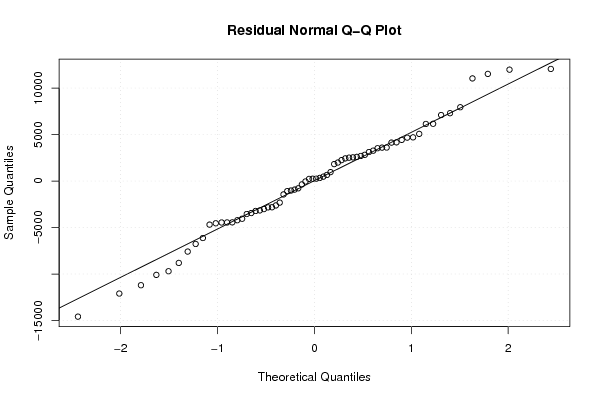
| Multiple Linear Regression - Residual Statistics | |
| Residual Standard Deviation | 6427.4395375485 |
| Sum Squared Residuals | 2148222908.45976 |
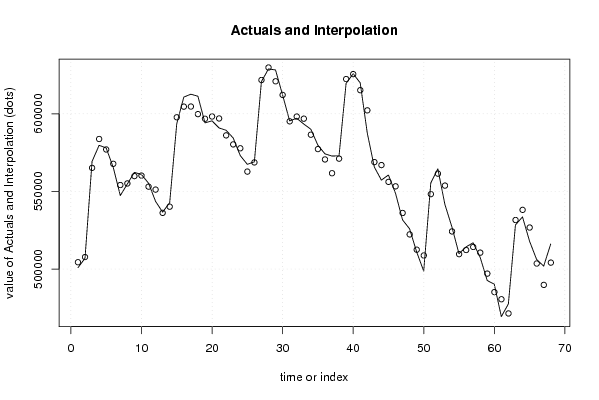
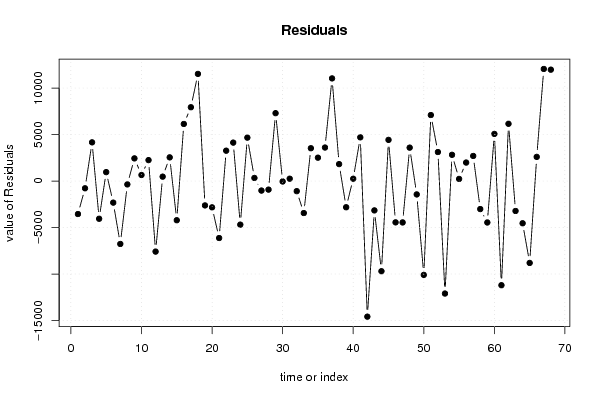
| Multiple Linear Regression - Actuals, Interpolation, and Residuals | |||
| Time or Index | Actuals | Interpolation Forecast | Residuals Prediction Error |
| 1 | 500857 | 504404.830116698 | -3547.83011669796 |
| 2 | 506971 | 507749.806443279 | -778.8064432789 |
| 3 | 569323 | 565155.97053979 | 4167.02946021052 |
| 4 | 579714 | 583769.703440668 | -4055.7034406678 |
| 5 | 577992 | 577031.267613347 | 960.732386653092 |
| 6 | 565464 | 567783.511383645 | -2319.51138364549 |
| 7 | 547344 | 554111.368702064 | -6767.36870206405 |
| 8 | 554788 | 555148.287225015 | -360.287225015 |
| 9 | 562325 | 559884.310429077 | 2440.68957092303 |
| 10 | 560854 | 560198.891255182 | 655.108744817821 |
| 11 | 555332 | 553078.956468437 | 2253.04353156315 |
| 12 | 543599 | 551187.411944026 | -7588.4119440263 |
| 13 | 536662 | 536188.663047524 | 473.336952476172 |
| 14 | 542722 | 540172.317501449 | 2549.68249855130 |
| 15 | 593530 | 597742.528182478 | -4212.52818247766 |
| 16 | 610763 | 604618.403281043 | 6144.59671895693 |
| 17 | 612613 | 604670.556380204 | 7942.44361979637 |
| 18 | 611324 | 599795.603549612 | 11528.3964503880 |
| 19 | 594167 | 596788.121977146 | -2621.12197714644 |
| 20 | 595454 | 598281.602466602 | -2827.60246660231 |
| 21 | 590865 | 596994.931173946 | -6129.93117394614 |
| 22 | 589379 | 586109.684678669 | 3269.31532133100 |
| 23 | 584428 | 580289.883881028 | 4138.11611897189 |
| 24 | 573100 | 577789.210124305 | -4689.21012430516 |
| 25 | 567456 | 562781.889105933 | 4674.11089406713 |
| 26 | 569028 | 568691.902229872 | 336.097770128443 |
| 27 | 620735 | 621757.191476609 | -1022.19147660879 |
| 28 | 628884 | 629805.54008235 | -921.540082350759 |
| 29 | 628232 | 620926.840484924 | 7305.15951507644 |
| 30 | 612117 | 612162.710656588 | -45.7106565884505 |
| 31 | 595404 | 595150.474299619 | 253.525700381135 |
| 32 | 597141 | 598227.743805708 | -1086.7438057085 |
| 33 | 593408 | 596850.607759386 | -3442.60775938586 |
| 34 | 590072 | 586540.013010341 | 3531.98698965915 |
| 35 | 579799 | 577282.788233994 | 2516.21176600635 |
| 36 | 574205 | 570598.005272064 | 3606.99472793573 |
| 37 | 572775 | 561728.797502986 | 11046.2024970137 |
| 38 | 572942 | 571116.619875627 | 1825.38012437311 |
| 39 | 619567 | 622384.534051223 | -2817.53405122274 |
| 40 | 625809 | 625557.023478929 | 251.976521070690 |
| 41 | 619916 | 615211.218624698 | 4704.78137530246 |
| 42 | 587625 | 602214.575950529 | -14589.575950529 |
| 43 | 565742 | 568898.960749713 | -3156.96074971251 |
| 44 | 557274 | 566976.031725868 | -9702.03172586842 |
| 45 | 560576 | 556145.764833573 | 4430.23516642672 |
| 46 | 548854 | 553296.831127687 | -4442.8311276875 |
| 47 | 531673 | 536123.967201857 | -4450.96720185673 |
| 48 | 525919 | 522323.569805107 | 3595.43019489287 |
| 49 | 511038 | 512476.225070058 | -1438.2250700582 |
| 50 | 498662 | 508756.853555622 | -10094.8535556222 |
| 51 | 555362 | 548258.072398445 | 7103.92760155475 |
| 52 | 564591 | 561468.565454021 | 3122.43454597903 |
| 53 | 541657 | 553760.900637975 | -12103.9006379747 |
| 54 | 527070 | 524245.589266374 | 2824.41073362574 |
| 55 | 509846 | 509617.209658006 | 228.79034199423 |
| 56 | 514258 | 512266.899268256 | 1991.10073174381 |
| 57 | 516922 | 514220.385804018 | 2701.61419598226 |
| 58 | 507561 | 510574.57992812 | -3013.57992812047 |
| 59 | 492622 | 497078.404214685 | -4456.40421468465 |
| 60 | 490243 | 485167.802854497 | 5075.19714550285 |
| 61 | 469357 | 480564.595156801 | -11207.5951568009 |
| 62 | 477580 | 471417.500394152 | 6162.49960584819 |
| 63 | 528379 | 531597.703351456 | -3218.70335145607 |
| 64 | 533590 | 538131.764262988 | -4541.76426298808 |
| 65 | 517945 | 526754.216258854 | -8809.21625885367 |
| 66 | 506174 | 503572.009193251 | 2601.99080674921 |
| 67 | 501866 | 489802.864613452 | 12063.1353865476 |
| 68 | 516141 | 504155.43550855 | 11985.5644914504 |
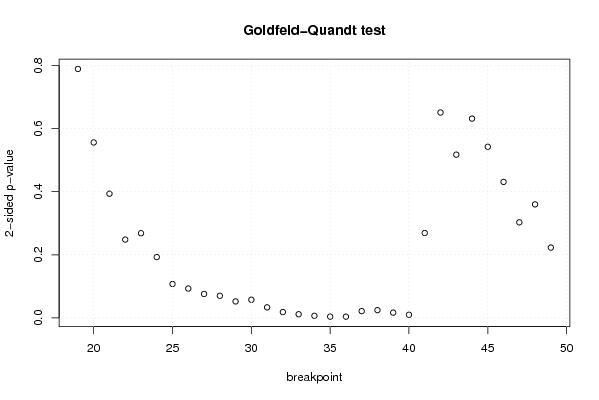
| Goldfeld-Quandt test for Heteroskedasticity | |||
| p-values | Alternative Hypothesis | ||
| breakpoint index | greater | 2-sided | less |
| 19 | 0.394236688023268 | 0.788473376046535 | 0.605763311976732 |
| 20 | 0.277816185168378 | 0.555632370336757 | 0.722183814831622 |
| 21 | 0.196706716012789 | 0.393413432025578 | 0.80329328398721 |
| 22 | 0.124075749764129 | 0.248151499528258 | 0.875924250235871 |
| 23 | 0.134113604111581 | 0.268227208223163 | 0.865886395888419 |
| 24 | 0.0963496738431998 | 0.192699347686400 | 0.9036503261568 |
| 25 | 0.0537142318478846 | 0.107428463695769 | 0.946285768152115 |
| 26 | 0.0465547232685474 | 0.0931094465370949 | 0.953445276731453 |
| 27 | 0.037932369174464 | 0.075864738348928 | 0.962067630825536 |
| 28 | 0.0350744192217013 | 0.0701488384434025 | 0.96492558077830 |
| 29 | 0.026144627606742 | 0.052289255213484 | 0.973855372393258 |
| 30 | 0.028803860559177 | 0.057607721118354 | 0.971196139440823 |
| 31 | 0.0167266531467957 | 0.0334533062935913 | 0.983273346853204 |
| 32 | 0.00931700933892444 | 0.0186340186778489 | 0.990682990661076 |
| 33 | 0.00586057592914463 | 0.0117211518582893 | 0.994139424070855 |
| 34 | 0.00339660670568067 | 0.00679321341136133 | 0.99660339329432 |
| 35 | 0.00205673235564202 | 0.00411346471128404 | 0.997943267644358 |
| 36 | 0.00203518492023581 | 0.00407036984047161 | 0.997964815079764 |
| 37 | 0.0107939358059513 | 0.0215878716119027 | 0.989206064194049 |
| 38 | 0.0123204320531501 | 0.0246408641063003 | 0.98767956794685 |
| 39 | 0.00840116894779004 | 0.0168023378955801 | 0.99159883105221 |
| 40 | 0.00501993494564298 | 0.0100398698912860 | 0.994980065054357 |
| 41 | 0.134450777770978 | 0.268901555541956 | 0.865549222229022 |
| 42 | 0.325274228940437 | 0.650548457880874 | 0.674725771059563 |
| 43 | 0.258524734077681 | 0.517049468155363 | 0.741475265922318 |
| 44 | 0.315604326918517 | 0.631208653837034 | 0.684395673081483 |
| 45 | 0.271008937926646 | 0.542017875853292 | 0.728991062073354 |
| 46 | 0.215372496149584 | 0.430744992299168 | 0.784627503850416 |
| 47 | 0.151371393367972 | 0.302742786735944 | 0.848628606632028 |
| 48 | 0.179832645692258 | 0.359665291384516 | 0.820167354307742 |
| 49 | 0.888596439153102 | 0.222807121693797 | 0.111403560846898 |
| Meta Analysis of Goldfeld-Quandt test for Heteroskedasticity | |||
| Description | # significant tests | % significant tests | OK/NOK |
| 1% type I error level | 3 | 0.0967741935483871 | NOK |
| 5% type I error level | 10 | 0.32258064516129 | NOK |
| 10% type I error level | 15 | 0.483870967741935 | NOK |