Free Statistics

of Irreproducible Research!

Author's title

Author*The author of this computation has been verified*
R Software Modulerwasp_multipleregression.wasp
Title produced by softwareMultiple Regression
Date of computationFri, 20 Nov 2009 11:38:36 -0700
Cite this page as followsStatistical Computations at FreeStatistics.org, Office for Research Development and Education, URL https://freestatistics.org/blog/index.php?v=date/2009/Nov/20/t1258742613hnrmv8a7ua2u8zk.htm/, Retrieved Fri, 19 Apr 2024 22:40:09 +0000
Statistical Computations at FreeStatistics.org, Office for Research Development and Education, URL https://freestatistics.org/blog/index.php?pk=58412, Retrieved Fri, 19 Apr 2024 22:40:09 +0000
QR Codes:

Original text written by user:
IsPrivate?No (this computation is public)
User-defined keywords
Estimated Impact164
Family? (F = Feedback message, R = changed R code, M = changed R Module, P = changed Parameters, D = changed Data)
-     [Multiple Regression] [Q1 The Seatbeltlaw] [2007-11-14 19:27:43] [8cd6641b921d30ebe00b648d1481bba0]
- RMPD  [Multiple Regression] [Seatbelt] [2009-11-12 14:03:14] [b98453cac15ba1066b407e146608df68]
-   PD    [Multiple Regression] [] [2009-11-19 09:52:29] [d181e5359f7da6c8509e4702d1229fb0]
-    D        [Multiple Regression] [multiple regressi...] [2009-11-20 18:38:36] [371dc2189c569d90e2c1567f632c3ec0] [Current]
-    D          [Multiple Regression] [multiple regressi...] [2009-12-14 19:49:08] [34d27ebe78dc2d31581e8710befe8733]
Feedback Forum

Post a new message
Dataseries X:
462	1919
455	1911
461	1870
461	2263
463	1802
462	1863
456	1989
455	2197
456	2409
472	2502
472	2593
471	2598
465	2053
459	2213
465	2238
468	2359
467	2151
463	2474
460	3079
462	2312
461	2565
476	1972
476	2484
471	2202
453	2151
443	1976
442	2012
444	2114
438	1772
427	1957
424	2070
416	1990
406	2182
431	2008
434	1916
418	2397
412	2114
404	1778
409	1641
412	2186
406	1773
398	1785
397	2217
385	2153
390	1895
413	2475
413	1793
401	2308
397	2051
397	1898
409	2142
419	1874
424	1560
428	1808
430	1575
424	1525
433	1997
456	1753
459	1623
446	2251
441	1890


Summary of computational transaction
Raw Inputview raw input (R code)
Raw Outputview raw output of R engine
Computing time3 seconds
R Server'Gwilym Jenkins' @ 72.249.127.135

\begin{tabular}{lllllllll}
\hline
Summary of computational transaction \tabularnewline
Raw Input & view raw input (R code)  \tabularnewline
Raw Output & view raw output of R engine  \tabularnewline
Computing time & 3 seconds \tabularnewline
R Server & 'Gwilym Jenkins' @ 72.249.127.135 \tabularnewline
\hline
\end{tabular}
%Source: https://freestatistics.org/blog/index.php?pk=58412&T=0

[TABLE]
[ROW][C]Summary of computational transaction[/C][/ROW]
[ROW][C]Raw Input[/C][C]view raw input (R code) [/C][/ROW]
[ROW][C]Raw Output[/C][C]view raw output of R engine [/C][/ROW]
[ROW][C]Computing time[/C][C]3 seconds[/C][/ROW]
[ROW][C]R Server[/C][C]'Gwilym Jenkins' @ 72.249.127.135[/C][/ROW]
[/TABLE]
Source: https://freestatistics.org/blog/index.php?pk=58412&T=0

Globally Unique Identifier (entire table): ba.freestatistics.org/blog/index.php?pk=58412&T=0

As an alternative you can also use a QR Code:  

The GUIDs for individual cells are displayed in the table below:

Summary of computational transaction
Raw Inputview raw input (R code)
Raw Outputview raw output of R engine
Computing time3 seconds
R Server'Gwilym Jenkins' @ 72.249.127.135


Multiple Linear Regression - Estimated Regression Equation
wkl[t] = + 477.993760890492 + 0.000337047508224897bvg[t] -8.15082618449848M1[t] -20.0515922400293M2[t] -13.4216469414095M3[t] -8.84333732104988M4[t] -8.88767330186228M5[t] -11.9050494733973M6[t] -13.1368512782844M7[t] -17.0475856182171M8[t] -15.2677929888212M9[t] + 6.19349772806338M10[t] + 8.45229429338714M11[t] -1.03850630532863t + e[t]

\begin{tabular}{lllllllll}
\hline
Multiple Linear Regression - Estimated Regression Equation \tabularnewline
wkl[t] =  +  477.993760890492 +  0.000337047508224897bvg[t] -8.15082618449848M1[t] -20.0515922400293M2[t] -13.4216469414095M3[t] -8.84333732104988M4[t] -8.88767330186228M5[t] -11.9050494733973M6[t] -13.1368512782844M7[t] -17.0475856182171M8[t] -15.2677929888212M9[t] +  6.19349772806338M10[t] +  8.45229429338714M11[t] -1.03850630532863t  + e[t] \tabularnewline
\hline
\end{tabular}
%Source: https://freestatistics.org/blog/index.php?pk=58412&T=1

[TABLE]
[ROW][C]Multiple Linear Regression - Estimated Regression Equation[/C][/ROW]
[ROW][C]wkl[t] =  +  477.993760890492 +  0.000337047508224897bvg[t] -8.15082618449848M1[t] -20.0515922400293M2[t] -13.4216469414095M3[t] -8.84333732104988M4[t] -8.88767330186228M5[t] -11.9050494733973M6[t] -13.1368512782844M7[t] -17.0475856182171M8[t] -15.2677929888212M9[t] +  6.19349772806338M10[t] +  8.45229429338714M11[t] -1.03850630532863t  + e[t][/C][/ROW]
[/TABLE]
Source: https://freestatistics.org/blog/index.php?pk=58412&T=1

Globally Unique Identifier (entire table): ba.freestatistics.org/blog/index.php?pk=58412&T=1

As an alternative you can also use a QR Code:  

The GUIDs for individual cells are displayed in the table below:

Multiple Linear Regression - Estimated Regression Equation
wkl[t] = + 477.993760890492 + 0.000337047508224897bvg[t] -8.15082618449848M1[t] -20.0515922400293M2[t] -13.4216469414095M3[t] -8.84333732104988M4[t] -8.88767330186228M5[t] -11.9050494733973M6[t] -13.1368512782844M7[t] -17.0475856182171M8[t] -15.2677929888212M9[t] + 6.19349772806338M10[t] + 8.45229429338714M11[t] -1.03850630532863t + e[t]


Multiple Linear Regression - Ordinary Least Squares
VariableParameterS.D.T-STATH0: parameter = 02-tail p-value1-tail p-value
(Intercept)477.99376089049231.66601215.094900
bvg0.0003370475082248970.0113530.02970.9764420.488221
M1-8.1508261844984812.732764-0.64010.5251860.262593
M2-20.051592240029313.754834-1.45780.151550.075775
M3-13.421646941409513.595873-0.98720.3286070.164303
M4-8.8433373210498812.950613-0.68290.4980530.249027
M5-8.8876733018622814.304897-0.62130.5374020.268701
M6-11.905049473397313.475594-0.88350.3814890.190744
M7-13.136851278284412.801573-1.02620.3100550.155027
M8-17.047585618217113.184982-1.2930.2023460.101173
M9-15.267792988821212.714327-1.20080.2358330.117916
M106.1934977280633812.8276930.48280.6314630.315732
M118.4522942933871412.9564770.65240.5173470.258673
t-1.038506305328630.172032-6.036700

\begin{tabular}{lllllllll}
\hline
Multiple Linear Regression - Ordinary Least Squares \tabularnewline
Variable & Parameter & S.D. & T-STATH0: parameter = 0 & 2-tail p-value & 1-tail p-value \tabularnewline
(Intercept) & 477.993760890492 & 31.666012 & 15.0949 & 0 & 0 \tabularnewline
bvg & 0.000337047508224897 & 0.011353 & 0.0297 & 0.976442 & 0.488221 \tabularnewline
M1 & -8.15082618449848 & 12.732764 & -0.6401 & 0.525186 & 0.262593 \tabularnewline
M2 & -20.0515922400293 & 13.754834 & -1.4578 & 0.15155 & 0.075775 \tabularnewline
M3 & -13.4216469414095 & 13.595873 & -0.9872 & 0.328607 & 0.164303 \tabularnewline
M4 & -8.84333732104988 & 12.950613 & -0.6829 & 0.498053 & 0.249027 \tabularnewline
M5 & -8.88767330186228 & 14.304897 & -0.6213 & 0.537402 & 0.268701 \tabularnewline
M6 & -11.9050494733973 & 13.475594 & -0.8835 & 0.381489 & 0.190744 \tabularnewline
M7 & -13.1368512782844 & 12.801573 & -1.0262 & 0.310055 & 0.155027 \tabularnewline
M8 & -17.0475856182171 & 13.184982 & -1.293 & 0.202346 & 0.101173 \tabularnewline
M9 & -15.2677929888212 & 12.714327 & -1.2008 & 0.235833 & 0.117916 \tabularnewline
M10 & 6.19349772806338 & 12.827693 & 0.4828 & 0.631463 & 0.315732 \tabularnewline
M11 & 8.45229429338714 & 12.956477 & 0.6524 & 0.517347 & 0.258673 \tabularnewline
t & -1.03850630532863 & 0.172032 & -6.0367 & 0 & 0 \tabularnewline
\hline
\end{tabular}
%Source: https://freestatistics.org/blog/index.php?pk=58412&T=2

[TABLE]
[ROW][C]Multiple Linear Regression - Ordinary Least Squares[/C][/ROW]
[ROW][C]Variable[/C][C]Parameter[/C][C]S.D.[/C][C]T-STATH0: parameter = 0[/C][C]2-tail p-value[/C][C]1-tail p-value[/C][/ROW]
[ROW][C](Intercept)[/C][C]477.993760890492[/C][C]31.666012[/C][C]15.0949[/C][C]0[/C][C]0[/C][/ROW]
[ROW][C]bvg[/C][C]0.000337047508224897[/C][C]0.011353[/C][C]0.0297[/C][C]0.976442[/C][C]0.488221[/C][/ROW]
[ROW][C]M1[/C][C]-8.15082618449848[/C][C]12.732764[/C][C]-0.6401[/C][C]0.525186[/C][C]0.262593[/C][/ROW]
[ROW][C]M2[/C][C]-20.0515922400293[/C][C]13.754834[/C][C]-1.4578[/C][C]0.15155[/C][C]0.075775[/C][/ROW]
[ROW][C]M3[/C][C]-13.4216469414095[/C][C]13.595873[/C][C]-0.9872[/C][C]0.328607[/C][C]0.164303[/C][/ROW]
[ROW][C]M4[/C][C]-8.84333732104988[/C][C]12.950613[/C][C]-0.6829[/C][C]0.498053[/C][C]0.249027[/C][/ROW]
[ROW][C]M5[/C][C]-8.88767330186228[/C][C]14.304897[/C][C]-0.6213[/C][C]0.537402[/C][C]0.268701[/C][/ROW]
[ROW][C]M6[/C][C]-11.9050494733973[/C][C]13.475594[/C][C]-0.8835[/C][C]0.381489[/C][C]0.190744[/C][/ROW]
[ROW][C]M7[/C][C]-13.1368512782844[/C][C]12.801573[/C][C]-1.0262[/C][C]0.310055[/C][C]0.155027[/C][/ROW]
[ROW][C]M8[/C][C]-17.0475856182171[/C][C]13.184982[/C][C]-1.293[/C][C]0.202346[/C][C]0.101173[/C][/ROW]
[ROW][C]M9[/C][C]-15.2677929888212[/C][C]12.714327[/C][C]-1.2008[/C][C]0.235833[/C][C]0.117916[/C][/ROW]
[ROW][C]M10[/C][C]6.19349772806338[/C][C]12.827693[/C][C]0.4828[/C][C]0.631463[/C][C]0.315732[/C][/ROW]
[ROW][C]M11[/C][C]8.45229429338714[/C][C]12.956477[/C][C]0.6524[/C][C]0.517347[/C][C]0.258673[/C][/ROW]
[ROW][C]t[/C][C]-1.03850630532863[/C][C]0.172032[/C][C]-6.0367[/C][C]0[/C][C]0[/C][/ROW]
[/TABLE]
Source: https://freestatistics.org/blog/index.php?pk=58412&T=2

Globally Unique Identifier (entire table): ba.freestatistics.org/blog/index.php?pk=58412&T=2

As an alternative you can also use a QR Code:  

The GUIDs for individual cells are displayed in the table below:

Multiple Linear Regression - Ordinary Least Squares
VariableParameterS.D.T-STATH0: parameter = 02-tail p-value1-tail p-value
(Intercept)477.99376089049231.66601215.094900
bvg0.0003370475082248970.0113530.02970.9764420.488221
M1-8.1508261844984812.732764-0.64010.5251860.262593
M2-20.051592240029313.754834-1.45780.151550.075775
M3-13.421646941409513.595873-0.98720.3286070.164303
M4-8.8433373210498812.950613-0.68290.4980530.249027
M5-8.8876733018622814.304897-0.62130.5374020.268701
M6-11.905049473397313.475594-0.88350.3814890.190744
M7-13.136851278284412.801573-1.02620.3100550.155027
M8-17.047585618217113.184982-1.2930.2023460.101173
M9-15.267792988821212.714327-1.20080.2358330.117916
M106.1934977280633812.8276930.48280.6314630.315732
M118.4522942933871412.9564770.65240.5173470.258673
t-1.038506305328630.172032-6.036700


Multiple Linear Regression - Regression Statistics
Multiple R0.741731690526168
R-squared0.550165900730807
Adjusted R-squared0.425743703060604
F-TEST (value)4.42176646155290
F-TEST (DF numerator)13
F-TEST (DF denominator)47
p-value7.76836363377553e-05
Multiple Linear Regression - Residual Statistics
Residual Standard Deviation19.8705683838929
Sum Squared Residuals18557.4559312513

\begin{tabular}{lllllllll}
\hline
Multiple Linear Regression - Regression Statistics \tabularnewline
Multiple R & 0.741731690526168 \tabularnewline
R-squared & 0.550165900730807 \tabularnewline
Adjusted R-squared & 0.425743703060604 \tabularnewline
F-TEST (value) & 4.42176646155290 \tabularnewline
F-TEST (DF numerator) & 13 \tabularnewline
F-TEST (DF denominator) & 47 \tabularnewline
p-value & 7.76836363377553e-05 \tabularnewline
Multiple Linear Regression - Residual Statistics \tabularnewline
Residual Standard Deviation & 19.8705683838929 \tabularnewline
Sum Squared Residuals & 18557.4559312513 \tabularnewline
\hline
\end{tabular}
%Source: https://freestatistics.org/blog/index.php?pk=58412&T=3

[TABLE]
[ROW][C]Multiple Linear Regression - Regression Statistics[/C][/ROW]
[ROW][C]Multiple R[/C][C]0.741731690526168[/C][/ROW]
[ROW][C]R-squared[/C][C]0.550165900730807[/C][/ROW]
[ROW][C]Adjusted R-squared[/C][C]0.425743703060604[/C][/ROW]
[ROW][C]F-TEST (value)[/C][C]4.42176646155290[/C][/ROW]
[ROW][C]F-TEST (DF numerator)[/C][C]13[/C][/ROW]
[ROW][C]F-TEST (DF denominator)[/C][C]47[/C][/ROW]
[ROW][C]p-value[/C][C]7.76836363377553e-05[/C][/ROW]
[ROW][C]Multiple Linear Regression - Residual Statistics[/C][/ROW]
[ROW][C]Residual Standard Deviation[/C][C]19.8705683838929[/C][/ROW]
[ROW][C]Sum Squared Residuals[/C][C]18557.4559312513[/C][/ROW]
[/TABLE]
Source: https://freestatistics.org/blog/index.php?pk=58412&T=3

Globally Unique Identifier (entire table): ba.freestatistics.org/blog/index.php?pk=58412&T=3

As an alternative you can also use a QR Code:  

The GUIDs for individual cells are displayed in the table below:

Multiple Linear Regression - Regression Statistics
Multiple R0.741731690526168
R-squared0.550165900730807
Adjusted R-squared0.425743703060604
F-TEST (value)4.42176646155290
F-TEST (DF numerator)13
F-TEST (DF denominator)47
p-value7.76836363377553e-05
Multiple Linear Regression - Residual Statistics
Residual Standard Deviation19.8705683838929
Sum Squared Residuals18557.4559312513


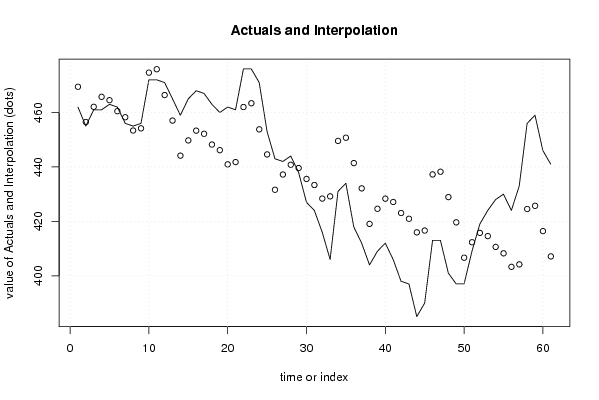
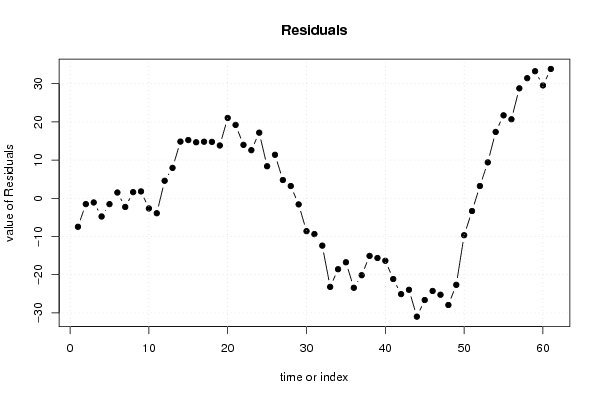
Multiple Linear Regression - Actuals, Interpolation, and Residuals
Time or IndexActualsInterpolationForecastResidualsPrediction Error
1462469.451222568948-7.45122256894819
2455456.509253828024-1.50925382802365
3461462.086873873477-1.08687387347749
4461465.759136859241-4.75913685924094
5463464.520915671808-1.52091567180823
6462460.4855930929461.51440690705374
7456458.257752968767-2.25775296876687
8455453.3786182052161.62138179478368
9456454.1913586010271.8086413989728
10472474.645488430848-2.64548843084813
11472475.896450014092-3.89645001409176
12471466.4073346529174.59266534708293
13465457.0343112711077.9656887288926
14459444.14896651156414.8510334884360
15465449.74883169256115.2511683074393
16468453.32941775608714.6705822439131
17467452.17646958823514.8235304117649
18463448.22945345652814.7705465434719
19460446.16305908878813.8369409112116
20462440.95530300471921.0446969952814
21461441.78186234836719.2181376516333
22476462.00477758754513.9952224124546
23476463.39763617175212.6023638282484
24471453.81178817571617.1882118242836
25453444.605266262978.39473373703014
26443431.60701058817111.3929894118289
27442437.2105832917584.78941670824174
28444440.7847654526283.21523454737176
29438439.586652918674-1.58665291867430
30427435.593124230832-8.5931242308322
31424433.360902489046-9.36090248904592
32416428.384698043127-12.3846980431266
33406429.190697488773-23.190697488773
34431449.554835633898-18.5548356338979
35434450.744117523136-16.7441175231363
36418441.415436775877-23.4154367758767
37412432.130719841222-20.1307198412219
38404419.078199517599-15.0781995175990
39409424.623463002263-15.6234630022632
40412428.346957209277-16.3469572092768
41406427.124914302239-21.1249143022389
42398423.073076395474-25.0730763954739
43397420.948372808811-23.9483728088114
44385415.977561123024-30.9775611230237
45390416.631889189969-26.6318891899689
46413437.250161156295-24.2501611562953
47413438.240585015681-25.2405850156811
48401428.923363883701-27.9233638837011
49397419.64741018426-22.6474101842602
50397406.656569554642-9.65656955464235
51409412.33024813994-3.33024813994032
52419415.7797227227673.22027727723292
53424414.5910475190439.40895248095656
54428410.61875282421917.3812471757805
55430408.26991264458721.7300873554126
56424403.30381962391520.6961803760852
57433404.20419237186428.7958076281358
58456424.54473719141331.4552628085867
59459425.72121127533933.2787887246608
60446416.44207651178929.5579234882113
61441407.13106987149233.8689301285076

\begin{tabular}{lllllllll}
\hline
Multiple Linear Regression - Actuals, Interpolation, and Residuals \tabularnewline
Time or Index & Actuals & InterpolationForecast & ResidualsPrediction Error \tabularnewline
1 & 462 & 469.451222568948 & -7.45122256894819 \tabularnewline
2 & 455 & 456.509253828024 & -1.50925382802365 \tabularnewline
3 & 461 & 462.086873873477 & -1.08687387347749 \tabularnewline
4 & 461 & 465.759136859241 & -4.75913685924094 \tabularnewline
5 & 463 & 464.520915671808 & -1.52091567180823 \tabularnewline
6 & 462 & 460.485593092946 & 1.51440690705374 \tabularnewline
7 & 456 & 458.257752968767 & -2.25775296876687 \tabularnewline
8 & 455 & 453.378618205216 & 1.62138179478368 \tabularnewline
9 & 456 & 454.191358601027 & 1.8086413989728 \tabularnewline
10 & 472 & 474.645488430848 & -2.64548843084813 \tabularnewline
11 & 472 & 475.896450014092 & -3.89645001409176 \tabularnewline
12 & 471 & 466.407334652917 & 4.59266534708293 \tabularnewline
13 & 465 & 457.034311271107 & 7.9656887288926 \tabularnewline
14 & 459 & 444.148966511564 & 14.8510334884360 \tabularnewline
15 & 465 & 449.748831692561 & 15.2511683074393 \tabularnewline
16 & 468 & 453.329417756087 & 14.6705822439131 \tabularnewline
17 & 467 & 452.176469588235 & 14.8235304117649 \tabularnewline
18 & 463 & 448.229453456528 & 14.7705465434719 \tabularnewline
19 & 460 & 446.163059088788 & 13.8369409112116 \tabularnewline
20 & 462 & 440.955303004719 & 21.0446969952814 \tabularnewline
21 & 461 & 441.781862348367 & 19.2181376516333 \tabularnewline
22 & 476 & 462.004777587545 & 13.9952224124546 \tabularnewline
23 & 476 & 463.397636171752 & 12.6023638282484 \tabularnewline
24 & 471 & 453.811788175716 & 17.1882118242836 \tabularnewline
25 & 453 & 444.60526626297 & 8.39473373703014 \tabularnewline
26 & 443 & 431.607010588171 & 11.3929894118289 \tabularnewline
27 & 442 & 437.210583291758 & 4.78941670824174 \tabularnewline
28 & 444 & 440.784765452628 & 3.21523454737176 \tabularnewline
29 & 438 & 439.586652918674 & -1.58665291867430 \tabularnewline
30 & 427 & 435.593124230832 & -8.5931242308322 \tabularnewline
31 & 424 & 433.360902489046 & -9.36090248904592 \tabularnewline
32 & 416 & 428.384698043127 & -12.3846980431266 \tabularnewline
33 & 406 & 429.190697488773 & -23.190697488773 \tabularnewline
34 & 431 & 449.554835633898 & -18.5548356338979 \tabularnewline
35 & 434 & 450.744117523136 & -16.7441175231363 \tabularnewline
36 & 418 & 441.415436775877 & -23.4154367758767 \tabularnewline
37 & 412 & 432.130719841222 & -20.1307198412219 \tabularnewline
38 & 404 & 419.078199517599 & -15.0781995175990 \tabularnewline
39 & 409 & 424.623463002263 & -15.6234630022632 \tabularnewline
40 & 412 & 428.346957209277 & -16.3469572092768 \tabularnewline
41 & 406 & 427.124914302239 & -21.1249143022389 \tabularnewline
42 & 398 & 423.073076395474 & -25.0730763954739 \tabularnewline
43 & 397 & 420.948372808811 & -23.9483728088114 \tabularnewline
44 & 385 & 415.977561123024 & -30.9775611230237 \tabularnewline
45 & 390 & 416.631889189969 & -26.6318891899689 \tabularnewline
46 & 413 & 437.250161156295 & -24.2501611562953 \tabularnewline
47 & 413 & 438.240585015681 & -25.2405850156811 \tabularnewline
48 & 401 & 428.923363883701 & -27.9233638837011 \tabularnewline
49 & 397 & 419.64741018426 & -22.6474101842602 \tabularnewline
50 & 397 & 406.656569554642 & -9.65656955464235 \tabularnewline
51 & 409 & 412.33024813994 & -3.33024813994032 \tabularnewline
52 & 419 & 415.779722722767 & 3.22027727723292 \tabularnewline
53 & 424 & 414.591047519043 & 9.40895248095656 \tabularnewline
54 & 428 & 410.618752824219 & 17.3812471757805 \tabularnewline
55 & 430 & 408.269912644587 & 21.7300873554126 \tabularnewline
56 & 424 & 403.303819623915 & 20.6961803760852 \tabularnewline
57 & 433 & 404.204192371864 & 28.7958076281358 \tabularnewline
58 & 456 & 424.544737191413 & 31.4552628085867 \tabularnewline
59 & 459 & 425.721211275339 & 33.2787887246608 \tabularnewline
60 & 446 & 416.442076511789 & 29.5579234882113 \tabularnewline
61 & 441 & 407.131069871492 & 33.8689301285076 \tabularnewline
\hline
\end{tabular}
%Source: https://freestatistics.org/blog/index.php?pk=58412&T=4

[TABLE]
[ROW][C]Multiple Linear Regression - Actuals, Interpolation, and Residuals[/C][/ROW]
[ROW][C]Time or Index[/C][C]Actuals[/C][C]InterpolationForecast[/C][C]ResidualsPrediction Error[/C][/ROW]
[ROW][C]1[/C][C]462[/C][C]469.451222568948[/C][C]-7.45122256894819[/C][/ROW]
[ROW][C]2[/C][C]455[/C][C]456.509253828024[/C][C]-1.50925382802365[/C][/ROW]
[ROW][C]3[/C][C]461[/C][C]462.086873873477[/C][C]-1.08687387347749[/C][/ROW]
[ROW][C]4[/C][C]461[/C][C]465.759136859241[/C][C]-4.75913685924094[/C][/ROW]
[ROW][C]5[/C][C]463[/C][C]464.520915671808[/C][C]-1.52091567180823[/C][/ROW]
[ROW][C]6[/C][C]462[/C][C]460.485593092946[/C][C]1.51440690705374[/C][/ROW]
[ROW][C]7[/C][C]456[/C][C]458.257752968767[/C][C]-2.25775296876687[/C][/ROW]
[ROW][C]8[/C][C]455[/C][C]453.378618205216[/C][C]1.62138179478368[/C][/ROW]
[ROW][C]9[/C][C]456[/C][C]454.191358601027[/C][C]1.8086413989728[/C][/ROW]
[ROW][C]10[/C][C]472[/C][C]474.645488430848[/C][C]-2.64548843084813[/C][/ROW]
[ROW][C]11[/C][C]472[/C][C]475.896450014092[/C][C]-3.89645001409176[/C][/ROW]
[ROW][C]12[/C][C]471[/C][C]466.407334652917[/C][C]4.59266534708293[/C][/ROW]
[ROW][C]13[/C][C]465[/C][C]457.034311271107[/C][C]7.9656887288926[/C][/ROW]
[ROW][C]14[/C][C]459[/C][C]444.148966511564[/C][C]14.8510334884360[/C][/ROW]
[ROW][C]15[/C][C]465[/C][C]449.748831692561[/C][C]15.2511683074393[/C][/ROW]
[ROW][C]16[/C][C]468[/C][C]453.329417756087[/C][C]14.6705822439131[/C][/ROW]
[ROW][C]17[/C][C]467[/C][C]452.176469588235[/C][C]14.8235304117649[/C][/ROW]
[ROW][C]18[/C][C]463[/C][C]448.229453456528[/C][C]14.7705465434719[/C][/ROW]
[ROW][C]19[/C][C]460[/C][C]446.163059088788[/C][C]13.8369409112116[/C][/ROW]
[ROW][C]20[/C][C]462[/C][C]440.955303004719[/C][C]21.0446969952814[/C][/ROW]
[ROW][C]21[/C][C]461[/C][C]441.781862348367[/C][C]19.2181376516333[/C][/ROW]
[ROW][C]22[/C][C]476[/C][C]462.004777587545[/C][C]13.9952224124546[/C][/ROW]
[ROW][C]23[/C][C]476[/C][C]463.397636171752[/C][C]12.6023638282484[/C][/ROW]
[ROW][C]24[/C][C]471[/C][C]453.811788175716[/C][C]17.1882118242836[/C][/ROW]
[ROW][C]25[/C][C]453[/C][C]444.60526626297[/C][C]8.39473373703014[/C][/ROW]
[ROW][C]26[/C][C]443[/C][C]431.607010588171[/C][C]11.3929894118289[/C][/ROW]
[ROW][C]27[/C][C]442[/C][C]437.210583291758[/C][C]4.78941670824174[/C][/ROW]
[ROW][C]28[/C][C]444[/C][C]440.784765452628[/C][C]3.21523454737176[/C][/ROW]
[ROW][C]29[/C][C]438[/C][C]439.586652918674[/C][C]-1.58665291867430[/C][/ROW]
[ROW][C]30[/C][C]427[/C][C]435.593124230832[/C][C]-8.5931242308322[/C][/ROW]
[ROW][C]31[/C][C]424[/C][C]433.360902489046[/C][C]-9.36090248904592[/C][/ROW]
[ROW][C]32[/C][C]416[/C][C]428.384698043127[/C][C]-12.3846980431266[/C][/ROW]
[ROW][C]33[/C][C]406[/C][C]429.190697488773[/C][C]-23.190697488773[/C][/ROW]
[ROW][C]34[/C][C]431[/C][C]449.554835633898[/C][C]-18.5548356338979[/C][/ROW]
[ROW][C]35[/C][C]434[/C][C]450.744117523136[/C][C]-16.7441175231363[/C][/ROW]
[ROW][C]36[/C][C]418[/C][C]441.415436775877[/C][C]-23.4154367758767[/C][/ROW]
[ROW][C]37[/C][C]412[/C][C]432.130719841222[/C][C]-20.1307198412219[/C][/ROW]
[ROW][C]38[/C][C]404[/C][C]419.078199517599[/C][C]-15.0781995175990[/C][/ROW]
[ROW][C]39[/C][C]409[/C][C]424.623463002263[/C][C]-15.6234630022632[/C][/ROW]
[ROW][C]40[/C][C]412[/C][C]428.346957209277[/C][C]-16.3469572092768[/C][/ROW]
[ROW][C]41[/C][C]406[/C][C]427.124914302239[/C][C]-21.1249143022389[/C][/ROW]
[ROW][C]42[/C][C]398[/C][C]423.073076395474[/C][C]-25.0730763954739[/C][/ROW]
[ROW][C]43[/C][C]397[/C][C]420.948372808811[/C][C]-23.9483728088114[/C][/ROW]
[ROW][C]44[/C][C]385[/C][C]415.977561123024[/C][C]-30.9775611230237[/C][/ROW]
[ROW][C]45[/C][C]390[/C][C]416.631889189969[/C][C]-26.6318891899689[/C][/ROW]
[ROW][C]46[/C][C]413[/C][C]437.250161156295[/C][C]-24.2501611562953[/C][/ROW]
[ROW][C]47[/C][C]413[/C][C]438.240585015681[/C][C]-25.2405850156811[/C][/ROW]
[ROW][C]48[/C][C]401[/C][C]428.923363883701[/C][C]-27.9233638837011[/C][/ROW]
[ROW][C]49[/C][C]397[/C][C]419.64741018426[/C][C]-22.6474101842602[/C][/ROW]
[ROW][C]50[/C][C]397[/C][C]406.656569554642[/C][C]-9.65656955464235[/C][/ROW]
[ROW][C]51[/C][C]409[/C][C]412.33024813994[/C][C]-3.33024813994032[/C][/ROW]
[ROW][C]52[/C][C]419[/C][C]415.779722722767[/C][C]3.22027727723292[/C][/ROW]
[ROW][C]53[/C][C]424[/C][C]414.591047519043[/C][C]9.40895248095656[/C][/ROW]
[ROW][C]54[/C][C]428[/C][C]410.618752824219[/C][C]17.3812471757805[/C][/ROW]
[ROW][C]55[/C][C]430[/C][C]408.269912644587[/C][C]21.7300873554126[/C][/ROW]
[ROW][C]56[/C][C]424[/C][C]403.303819623915[/C][C]20.6961803760852[/C][/ROW]
[ROW][C]57[/C][C]433[/C][C]404.204192371864[/C][C]28.7958076281358[/C][/ROW]
[ROW][C]58[/C][C]456[/C][C]424.544737191413[/C][C]31.4552628085867[/C][/ROW]
[ROW][C]59[/C][C]459[/C][C]425.721211275339[/C][C]33.2787887246608[/C][/ROW]
[ROW][C]60[/C][C]446[/C][C]416.442076511789[/C][C]29.5579234882113[/C][/ROW]
[ROW][C]61[/C][C]441[/C][C]407.131069871492[/C][C]33.8689301285076[/C][/ROW]
[/TABLE]
Source: https://freestatistics.org/blog/index.php?pk=58412&T=4

Globally Unique Identifier (entire table): ba.freestatistics.org/blog/index.php?pk=58412&T=4

As an alternative you can also use a QR Code:  

The GUIDs for individual cells are displayed in the table below:

Multiple Linear Regression - Actuals, Interpolation, and Residuals
Time or IndexActualsInterpolationForecastResidualsPrediction Error
1462469.451222568948-7.45122256894819
2455456.509253828024-1.50925382802365
3461462.086873873477-1.08687387347749
4461465.759136859241-4.75913685924094
5463464.520915671808-1.52091567180823
6462460.4855930929461.51440690705374
7456458.257752968767-2.25775296876687
8455453.3786182052161.62138179478368
9456454.1913586010271.8086413989728
10472474.645488430848-2.64548843084813
11472475.896450014092-3.89645001409176
12471466.4073346529174.59266534708293
13465457.0343112711077.9656887288926
14459444.14896651156414.8510334884360
15465449.74883169256115.2511683074393
16468453.32941775608714.6705822439131
17467452.17646958823514.8235304117649
18463448.22945345652814.7705465434719
19460446.16305908878813.8369409112116
20462440.95530300471921.0446969952814
21461441.78186234836719.2181376516333
22476462.00477758754513.9952224124546
23476463.39763617175212.6023638282484
24471453.81178817571617.1882118242836
25453444.605266262978.39473373703014
26443431.60701058817111.3929894118289
27442437.2105832917584.78941670824174
28444440.7847654526283.21523454737176
29438439.586652918674-1.58665291867430
30427435.593124230832-8.5931242308322
31424433.360902489046-9.36090248904592
32416428.384698043127-12.3846980431266
33406429.190697488773-23.190697488773
34431449.554835633898-18.5548356338979
35434450.744117523136-16.7441175231363
36418441.415436775877-23.4154367758767
37412432.130719841222-20.1307198412219
38404419.078199517599-15.0781995175990
39409424.623463002263-15.6234630022632
40412428.346957209277-16.3469572092768
41406427.124914302239-21.1249143022389
42398423.073076395474-25.0730763954739
43397420.948372808811-23.9483728088114
44385415.977561123024-30.9775611230237
45390416.631889189969-26.6318891899689
46413437.250161156295-24.2501611562953
47413438.240585015681-25.2405850156811
48401428.923363883701-27.9233638837011
49397419.64741018426-22.6474101842602
50397406.656569554642-9.65656955464235
51409412.33024813994-3.33024813994032
52419415.7797227227673.22027727723292
53424414.5910475190439.40895248095656
54428410.61875282421917.3812471757805
55430408.26991264458721.7300873554126
56424403.30381962391520.6961803760852
57433404.20419237186428.7958076281358
58456424.54473719141331.4552628085867
59459425.72121127533933.2787887246608
60446416.44207651178929.5579234882113
61441407.13106987149233.8689301285076


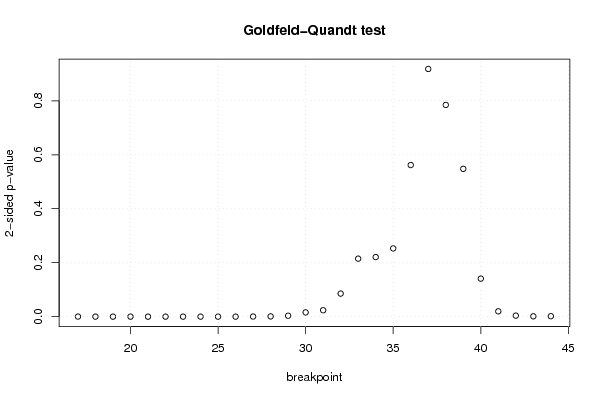
Goldfeld-Quandt test for Heteroskedasticity
p-valuesAlternative Hypothesis
breakpoint indexgreater2-sidedless
170.0001405426059760490.0002810852119520990.999859457394024
186.48173427370901e-061.29634685474180e-050.999993518265726
191.61445512218299e-063.22891024436599e-060.999998385544878
202.20281459475342e-074.40562918950683e-070.99999977971854
211.73875548978238e-083.47751097956477e-080.999999982612445
221.79774390630517e-093.59548781261034e-090.999999998202256
232.33694707305671e-104.67389414611341e-100.999999999766305
242.56239171090847e-105.12478342181695e-100.99999999974376
251.28150305251415e-062.56300610502830e-060.999998718496947
261.74606830111757e-053.49213660223515e-050.999982539316989
270.0002098106737886790.0004196213475773580.999790189326211
280.0004801065831978350.000960213166395670.999519893416802
290.001687925183716050.00337585036743210.998312074816284
300.007889515821676570.01577903164335310.992110484178323
310.01188909660048930.02377819320097850.98811090339951
320.04274068648773150.0854813729754630.957259313512268
330.1074952165899760.2149904331799510.892504783410024
340.1104115585833160.2208231171666310.889588441416684
350.1264627657413630.2529255314827250.873537234258637
360.2809443305421630.5618886610843260.719055669457837
370.4590693735841280.9181387471682550.540930626415872
380.6076020226513230.7847959546973530.392397977348677
390.7260635899783420.5478728200433150.273936410021658
400.9295094649527230.1409810700945540.0704905350472768
410.9900955635219640.01980887295607220.00990443647803609
420.9981499497804560.003700100439088060.00185005021954403
430.9993594569086120.001281086182776060.000640543091388029
440.9991609209190320.001678158161935830.000839079080967915

\begin{tabular}{lllllllll}
\hline
Goldfeld-Quandt test for Heteroskedasticity \tabularnewline
p-values & Alternative Hypothesis \tabularnewline
breakpoint index & greater & 2-sided & less \tabularnewline
17 & 0.000140542605976049 & 0.000281085211952099 & 0.999859457394024 \tabularnewline
18 & 6.48173427370901e-06 & 1.29634685474180e-05 & 0.999993518265726 \tabularnewline
19 & 1.61445512218299e-06 & 3.22891024436599e-06 & 0.999998385544878 \tabularnewline
20 & 2.20281459475342e-07 & 4.40562918950683e-07 & 0.99999977971854 \tabularnewline
21 & 1.73875548978238e-08 & 3.47751097956477e-08 & 0.999999982612445 \tabularnewline
22 & 1.79774390630517e-09 & 3.59548781261034e-09 & 0.999999998202256 \tabularnewline
23 & 2.33694707305671e-10 & 4.67389414611341e-10 & 0.999999999766305 \tabularnewline
24 & 2.56239171090847e-10 & 5.12478342181695e-10 & 0.99999999974376 \tabularnewline
25 & 1.28150305251415e-06 & 2.56300610502830e-06 & 0.999998718496947 \tabularnewline
26 & 1.74606830111757e-05 & 3.49213660223515e-05 & 0.999982539316989 \tabularnewline
27 & 0.000209810673788679 & 0.000419621347577358 & 0.999790189326211 \tabularnewline
28 & 0.000480106583197835 & 0.00096021316639567 & 0.999519893416802 \tabularnewline
29 & 0.00168792518371605 & 0.0033758503674321 & 0.998312074816284 \tabularnewline
30 & 0.00788951582167657 & 0.0157790316433531 & 0.992110484178323 \tabularnewline
31 & 0.0118890966004893 & 0.0237781932009785 & 0.98811090339951 \tabularnewline
32 & 0.0427406864877315 & 0.085481372975463 & 0.957259313512268 \tabularnewline
33 & 0.107495216589976 & 0.214990433179951 & 0.892504783410024 \tabularnewline
34 & 0.110411558583316 & 0.220823117166631 & 0.889588441416684 \tabularnewline
35 & 0.126462765741363 & 0.252925531482725 & 0.873537234258637 \tabularnewline
36 & 0.280944330542163 & 0.561888661084326 & 0.719055669457837 \tabularnewline
37 & 0.459069373584128 & 0.918138747168255 & 0.540930626415872 \tabularnewline
38 & 0.607602022651323 & 0.784795954697353 & 0.392397977348677 \tabularnewline
39 & 0.726063589978342 & 0.547872820043315 & 0.273936410021658 \tabularnewline
40 & 0.929509464952723 & 0.140981070094554 & 0.0704905350472768 \tabularnewline
41 & 0.990095563521964 & 0.0198088729560722 & 0.00990443647803609 \tabularnewline
42 & 0.998149949780456 & 0.00370010043908806 & 0.00185005021954403 \tabularnewline
43 & 0.999359456908612 & 0.00128108618277606 & 0.000640543091388029 \tabularnewline
44 & 0.999160920919032 & 0.00167815816193583 & 0.000839079080967915 \tabularnewline
\hline
\end{tabular}
%Source: https://freestatistics.org/blog/index.php?pk=58412&T=5

[TABLE]
[ROW][C]Goldfeld-Quandt test for Heteroskedasticity[/C][/ROW]
[ROW][C]p-values[/C][C]Alternative Hypothesis[/C][/ROW]
[ROW][C]breakpoint index[/C][C]greater[/C][C]2-sided[/C][C]less[/C][/ROW]
[ROW][C]17[/C][C]0.000140542605976049[/C][C]0.000281085211952099[/C][C]0.999859457394024[/C][/ROW]
[ROW][C]18[/C][C]6.48173427370901e-06[/C][C]1.29634685474180e-05[/C][C]0.999993518265726[/C][/ROW]
[ROW][C]19[/C][C]1.61445512218299e-06[/C][C]3.22891024436599e-06[/C][C]0.999998385544878[/C][/ROW]
[ROW][C]20[/C][C]2.20281459475342e-07[/C][C]4.40562918950683e-07[/C][C]0.99999977971854[/C][/ROW]
[ROW][C]21[/C][C]1.73875548978238e-08[/C][C]3.47751097956477e-08[/C][C]0.999999982612445[/C][/ROW]
[ROW][C]22[/C][C]1.79774390630517e-09[/C][C]3.59548781261034e-09[/C][C]0.999999998202256[/C][/ROW]
[ROW][C]23[/C][C]2.33694707305671e-10[/C][C]4.67389414611341e-10[/C][C]0.999999999766305[/C][/ROW]
[ROW][C]24[/C][C]2.56239171090847e-10[/C][C]5.12478342181695e-10[/C][C]0.99999999974376[/C][/ROW]
[ROW][C]25[/C][C]1.28150305251415e-06[/C][C]2.56300610502830e-06[/C][C]0.999998718496947[/C][/ROW]
[ROW][C]26[/C][C]1.74606830111757e-05[/C][C]3.49213660223515e-05[/C][C]0.999982539316989[/C][/ROW]
[ROW][C]27[/C][C]0.000209810673788679[/C][C]0.000419621347577358[/C][C]0.999790189326211[/C][/ROW]
[ROW][C]28[/C][C]0.000480106583197835[/C][C]0.00096021316639567[/C][C]0.999519893416802[/C][/ROW]
[ROW][C]29[/C][C]0.00168792518371605[/C][C]0.0033758503674321[/C][C]0.998312074816284[/C][/ROW]
[ROW][C]30[/C][C]0.00788951582167657[/C][C]0.0157790316433531[/C][C]0.992110484178323[/C][/ROW]
[ROW][C]31[/C][C]0.0118890966004893[/C][C]0.0237781932009785[/C][C]0.98811090339951[/C][/ROW]
[ROW][C]32[/C][C]0.0427406864877315[/C][C]0.085481372975463[/C][C]0.957259313512268[/C][/ROW]
[ROW][C]33[/C][C]0.107495216589976[/C][C]0.214990433179951[/C][C]0.892504783410024[/C][/ROW]
[ROW][C]34[/C][C]0.110411558583316[/C][C]0.220823117166631[/C][C]0.889588441416684[/C][/ROW]
[ROW][C]35[/C][C]0.126462765741363[/C][C]0.252925531482725[/C][C]0.873537234258637[/C][/ROW]
[ROW][C]36[/C][C]0.280944330542163[/C][C]0.561888661084326[/C][C]0.719055669457837[/C][/ROW]
[ROW][C]37[/C][C]0.459069373584128[/C][C]0.918138747168255[/C][C]0.540930626415872[/C][/ROW]
[ROW][C]38[/C][C]0.607602022651323[/C][C]0.784795954697353[/C][C]0.392397977348677[/C][/ROW]
[ROW][C]39[/C][C]0.726063589978342[/C][C]0.547872820043315[/C][C]0.273936410021658[/C][/ROW]
[ROW][C]40[/C][C]0.929509464952723[/C][C]0.140981070094554[/C][C]0.0704905350472768[/C][/ROW]
[ROW][C]41[/C][C]0.990095563521964[/C][C]0.0198088729560722[/C][C]0.00990443647803609[/C][/ROW]
[ROW][C]42[/C][C]0.998149949780456[/C][C]0.00370010043908806[/C][C]0.00185005021954403[/C][/ROW]
[ROW][C]43[/C][C]0.999359456908612[/C][C]0.00128108618277606[/C][C]0.000640543091388029[/C][/ROW]
[ROW][C]44[/C][C]0.999160920919032[/C][C]0.00167815816193583[/C][C]0.000839079080967915[/C][/ROW]
[/TABLE]
Source: https://freestatistics.org/blog/index.php?pk=58412&T=5

Globally Unique Identifier (entire table): ba.freestatistics.org/blog/index.php?pk=58412&T=5

As an alternative you can also use a QR Code:  

The GUIDs for individual cells are displayed in the table below:

Goldfeld-Quandt test for Heteroskedasticity
p-valuesAlternative Hypothesis
breakpoint indexgreater2-sidedless
170.0001405426059760490.0002810852119520990.999859457394024
186.48173427370901e-061.29634685474180e-050.999993518265726
191.61445512218299e-063.22891024436599e-060.999998385544878
202.20281459475342e-074.40562918950683e-070.99999977971854
211.73875548978238e-083.47751097956477e-080.999999982612445
221.79774390630517e-093.59548781261034e-090.999999998202256
232.33694707305671e-104.67389414611341e-100.999999999766305
242.56239171090847e-105.12478342181695e-100.99999999974376
251.28150305251415e-062.56300610502830e-060.999998718496947
261.74606830111757e-053.49213660223515e-050.999982539316989
270.0002098106737886790.0004196213475773580.999790189326211
280.0004801065831978350.000960213166395670.999519893416802
290.001687925183716050.00337585036743210.998312074816284
300.007889515821676570.01577903164335310.992110484178323
310.01188909660048930.02377819320097850.98811090339951
320.04274068648773150.0854813729754630.957259313512268
330.1074952165899760.2149904331799510.892504783410024
340.1104115585833160.2208231171666310.889588441416684
350.1264627657413630.2529255314827250.873537234258637
360.2809443305421630.5618886610843260.719055669457837
370.4590693735841280.9181387471682550.540930626415872
380.6076020226513230.7847959546973530.392397977348677
390.7260635899783420.5478728200433150.273936410021658
400.9295094649527230.1409810700945540.0704905350472768
410.9900955635219640.01980887295607220.00990443647803609
420.9981499497804560.003700100439088060.00185005021954403
430.9993594569086120.001281086182776060.000640543091388029
440.9991609209190320.001678158161935830.000839079080967915


Meta Analysis of Goldfeld-Quandt test for Heteroskedasticity
Description# significant tests% significant testsOK/NOK
1% type I error level160.571428571428571NOK
5% type I error level190.678571428571429NOK
10% type I error level200.714285714285714NOK

\begin{tabular}{lllllllll}
\hline
Meta Analysis of Goldfeld-Quandt test for Heteroskedasticity \tabularnewline
Description & # significant tests & % significant tests & OK/NOK \tabularnewline
1% type I error level & 16 & 0.571428571428571 & NOK \tabularnewline
5% type I error level & 19 & 0.678571428571429 & NOK \tabularnewline
10% type I error level & 20 & 0.714285714285714 & NOK \tabularnewline
\hline
\end{tabular}
%Source: https://freestatistics.org/blog/index.php?pk=58412&T=6

[TABLE]
[ROW][C]Meta Analysis of Goldfeld-Quandt test for Heteroskedasticity[/C][/ROW]
[ROW][C]Description[/C][C]# significant tests[/C][C]% significant tests[/C][C]OK/NOK[/C][/ROW]
[ROW][C]1% type I error level[/C][C]16[/C][C]0.571428571428571[/C][C]NOK[/C][/ROW]
[ROW][C]5% type I error level[/C][C]19[/C][C]0.678571428571429[/C][C]NOK[/C][/ROW]
[ROW][C]10% type I error level[/C][C]20[/C][C]0.714285714285714[/C][C]NOK[/C][/ROW]
[/TABLE]
Source: https://freestatistics.org/blog/index.php?pk=58412&T=6

Globally Unique Identifier (entire table): ba.freestatistics.org/blog/index.php?pk=58412&T=6

As an alternative you can also use a QR Code:  

The GUIDs for individual cells are displayed in the table below:

Meta Analysis of Goldfeld-Quandt test for Heteroskedasticity
Description# significant tests% significant testsOK/NOK
1% type I error level160.571428571428571NOK
5% type I error level190.678571428571429NOK
10% type I error level200.714285714285714NOK


Parameters (Session):
par1 = 1 ; par2 = Include Monthly Dummies ; par3 = Linear Trend ;
Parameters (R input):
par1 = 1 ; par2 = Include Monthly Dummies ; par3 = Linear Trend ;
R code (references can be found in the software module):
library(lattice)
library(lmtest)
n25 <- 25 #minimum number of obs. for Goldfeld-Quandt test
par1 <- as.numeric(par1)
x <- t(y)
k <- length(x[1,])
n <- length(x[,1])
x1 <- cbind(x[,par1], x[,1:k!=par1])
mycolnames <- c(colnames(x)[par1], colnames(x)[1:k!=par1])
colnames(x1) <- mycolnames #colnames(x)[par1]
x <- x1
if (par3 == 'First Differences'){
x2 <- array(0, dim=c(n-1,k), dimnames=list(1:(n-1), paste('(1-B)',colnames(x),sep='')))
for (i in 1:n-1) {
for (j in 1:k) {
x2[i,j] <- x[i+1,j] - x[i,j]
}
}
x <- x2
}
if (par2 == 'Include Monthly Dummies'){
x2 <- array(0, dim=c(n,11), dimnames=list(1:n, paste('M', seq(1:11), sep ='')))
for (i in 1:11){
x2[seq(i,n,12),i] <- 1
}
x <- cbind(x, x2)
}
if (par2 == 'Include Quarterly Dummies'){
x2 <- array(0, dim=c(n,3), dimnames=list(1:n, paste('Q', seq(1:3), sep ='')))
for (i in 1:3){
x2[seq(i,n,4),i] <- 1
}
x <- cbind(x, x2)
}
k <- length(x[1,])
if (par3 == 'Linear Trend'){
x <- cbind(x, c(1:n))
colnames(x)[k+1] <- 't'
}
x
k <- length(x[1,])
df <- as.data.frame(x)
(mylm <- lm(df))
(mysum <- summary(mylm))
if (n > n25) {
kp3 <- k + 3
nmkm3 <- n - k - 3
gqarr <- array(NA, dim=c(nmkm3-kp3+1,3))
numgqtests <- 0
numsignificant1 <- 0
numsignificant5 <- 0
numsignificant10 <- 0
for (mypoint in kp3:nmkm3) {
j <- 0
numgqtests <- numgqtests + 1
for (myalt in c('greater', 'two.sided', 'less')) {
j <- j + 1
gqarr[mypoint-kp3+1,j] <- gqtest(mylm, point=mypoint, alternative=myalt)$p.value
}
if (gqarr[mypoint-kp3+1,2] < 0.01) numsignificant1 <- numsignificant1 + 1
if (gqarr[mypoint-kp3+1,2] < 0.05) numsignificant5 <- numsignificant5 + 1
if (gqarr[mypoint-kp3+1,2] < 0.10) numsignificant10 <- numsignificant10 + 1
}
gqarr
}
bitmap(file='test0.png')
plot(x[,1], type='l', main='Actuals and Interpolation', ylab='value of Actuals and Interpolation (dots)', xlab='time or index')
points(x[,1]-mysum$resid)
grid()
dev.off()
bitmap(file='test1.png')
plot(mysum$resid, type='b', pch=19, main='Residuals', ylab='value of Residuals', xlab='time or index')
grid()
dev.off()
bitmap(file='test2.png')
hist(mysum$resid, main='Residual Histogram', xlab='values of Residuals')
grid()
dev.off()
bitmap(file='test3.png')
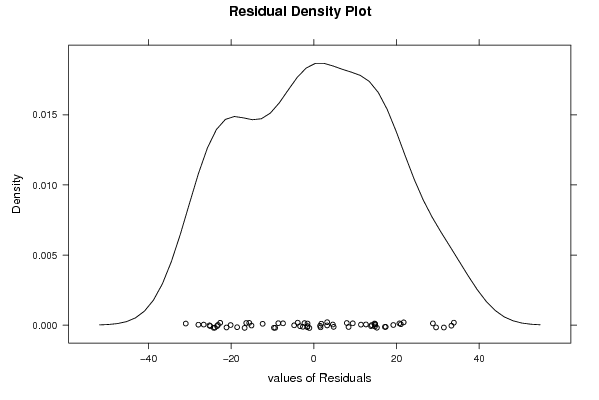
densityplot(~mysum$resid,col='black',main='Residual Density Plot', xlab='values of Residuals')
dev.off()
bitmap(file='test4.png')
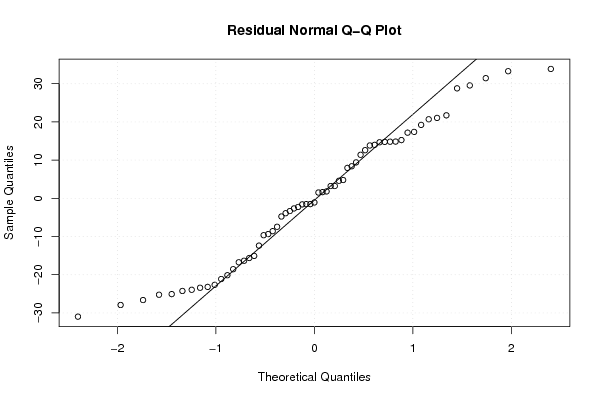
qqnorm(mysum$resid, main='Residual Normal Q-Q Plot')
qqline(mysum$resid)
grid()
dev.off()
(myerror <- as.ts(mysum$resid))
bitmap(file='test5.png')
dum <- cbind(lag(myerror,k=1),myerror)
dum
dum1 <- dum[2:length(myerror),]
dum1
z <- as.data.frame(dum1)
z
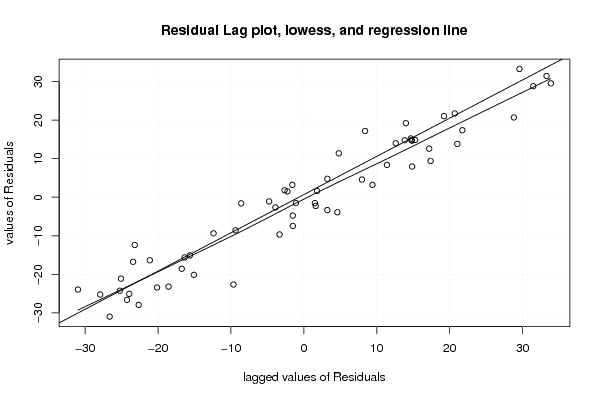
plot(z,main=paste('Residual Lag plot, lowess, and regression line'), ylab='values of Residuals', xlab='lagged values of Residuals')
lines(lowess(z))
abline(lm(z))
grid()
dev.off()
bitmap(file='test6.png')
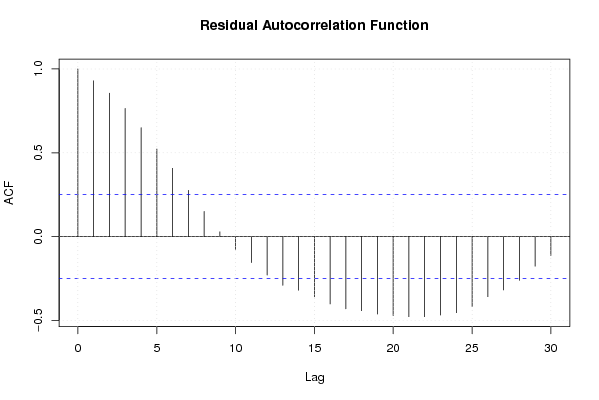
acf(mysum$resid, lag.max=length(mysum$resid)/2, main='Residual Autocorrelation Function')
grid()
dev.off()
bitmap(file='test7.png')
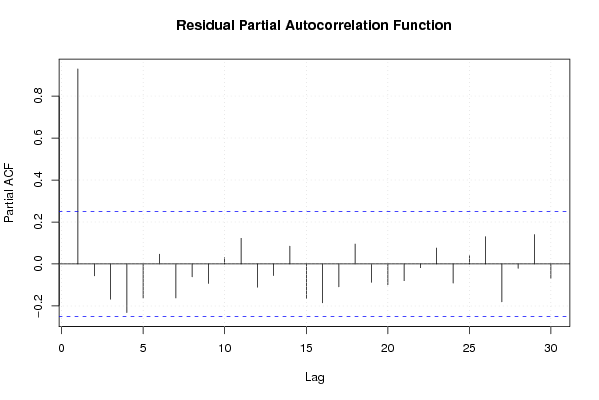
pacf(mysum$resid, lag.max=length(mysum$resid)/2, main='Residual Partial Autocorrelation Function')
grid()
dev.off()
bitmap(file='test8.png')
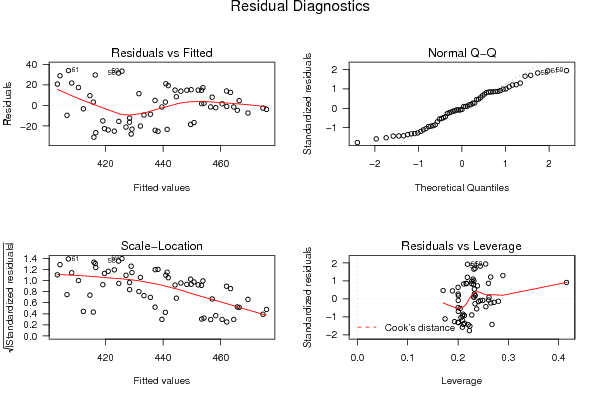
opar <- par(mfrow = c(2,2), oma = c(0, 0, 1.1, 0))
plot(mylm, las = 1, sub='Residual Diagnostics')
par(opar)
dev.off()
if (n > n25) {
bitmap(file='test9.png')
plot(kp3:nmkm3,gqarr[,2], main='Goldfeld-Quandt test',ylab='2-sided p-value',xlab='breakpoint')
grid()
dev.off()
}
load(file='createtable')
a<-table.start()
a<-table.row.start(a)
a<-table.element(a, 'Multiple Linear Regression - Estimated Regression Equation', 1, TRUE)
a<-table.row.end(a)
myeq <- colnames(x)[1]
myeq <- paste(myeq, '[t] = ', sep='')
for (i in 1:k){
if (mysum$coefficients[i,1] > 0) myeq <- paste(myeq, '+', '')
myeq <- paste(myeq, mysum$coefficients[i,1], sep=' ')
if (rownames(mysum$coefficients)[i] != '(Intercept)') {
myeq <- paste(myeq, rownames(mysum$coefficients)[i], sep='')
if (rownames(mysum$coefficients)[i] != 't') myeq <- paste(myeq, '[t]', sep='')
}
}
myeq <- paste(myeq, ' + e[t]')
a<-table.row.start(a)
a<-table.element(a, myeq)
a<-table.row.end(a)
a<-table.end(a)
table.save(a,file='mytable1.tab')
a<-table.start()
a<-table.row.start(a)
a<-table.element(a,hyperlink('ols1.htm','Multiple Linear Regression - Ordinary Least Squares',''), 6, TRUE)
a<-table.row.end(a)
a<-table.row.start(a)
a<-table.element(a,'Variable',header=TRUE)
a<-table.element(a,'Parameter',header=TRUE)
a<-table.element(a,'S.D.',header=TRUE)
a<-table.element(a,'T-STAT
H0: parameter = 0',header=TRUE)
a<-table.element(a,'2-tail p-value',header=TRUE)
a<-table.element(a,'1-tail p-value',header=TRUE)
a<-table.row.end(a)
for (i in 1:k){
a<-table.row.start(a)
a<-table.element(a,rownames(mysum$coefficients)[i],header=TRUE)
a<-table.element(a,mysum$coefficients[i,1])
a<-table.element(a, round(mysum$coefficients[i,2],6))
a<-table.element(a, round(mysum$coefficients[i,3],4))
a<-table.element(a, round(mysum$coefficients[i,4],6))
a<-table.element(a, round(mysum$coefficients[i,4]/2,6))
a<-table.row.end(a)
}
a<-table.end(a)
table.save(a,file='mytable2.tab')
a<-table.start()
a<-table.row.start(a)
a<-table.element(a, 'Multiple Linear Regression - Regression Statistics', 2, TRUE)
a<-table.row.end(a)
a<-table.row.start(a)
a<-table.element(a, 'Multiple R',1,TRUE)
a<-table.element(a, sqrt(mysum$r.squared))
a<-table.row.end(a)
a<-table.row.start(a)
a<-table.element(a, 'R-squared',1,TRUE)
a<-table.element(a, mysum$r.squared)
a<-table.row.end(a)
a<-table.row.start(a)
a<-table.element(a, 'Adjusted R-squared',1,TRUE)
a<-table.element(a, mysum$adj.r.squared)
a<-table.row.end(a)
a<-table.row.start(a)
a<-table.element(a, 'F-TEST (value)',1,TRUE)
a<-table.element(a, mysum$fstatistic[1])
a<-table.row.end(a)
a<-table.row.start(a)
a<-table.element(a, 'F-TEST (DF numerator)',1,TRUE)
a<-table.element(a, mysum$fstatistic[2])
a<-table.row.end(a)
a<-table.row.start(a)
a<-table.element(a, 'F-TEST (DF denominator)',1,TRUE)
a<-table.element(a, mysum$fstatistic[3])
a<-table.row.end(a)
a<-table.row.start(a)
a<-table.element(a, 'p-value',1,TRUE)
a<-table.element(a, 1-pf(mysum$fstatistic[1],mysum$fstatistic[2],mysum$fstatistic[3]))
a<-table.row.end(a)
a<-table.row.start(a)
a<-table.element(a, 'Multiple Linear Regression - Residual Statistics', 2, TRUE)
a<-table.row.end(a)
a<-table.row.start(a)
a<-table.element(a, 'Residual Standard Deviation',1,TRUE)
a<-table.element(a, mysum$sigma)
a<-table.row.end(a)
a<-table.row.start(a)
a<-table.element(a, 'Sum Squared Residuals',1,TRUE)
a<-table.element(a, sum(myerror*myerror))
a<-table.row.end(a)
a<-table.end(a)
table.save(a,file='mytable3.tab')
a<-table.start()
a<-table.row.start(a)
a<-table.element(a, 'Multiple Linear Regression - Actuals, Interpolation, and Residuals', 4, TRUE)
a<-table.row.end(a)
a<-table.row.start(a)
a<-table.element(a, 'Time or Index', 1, TRUE)
a<-table.element(a, 'Actuals', 1, TRUE)
a<-table.element(a, 'Interpolation
Forecast', 1, TRUE)
a<-table.element(a, 'Residuals
Prediction Error', 1, TRUE)
a<-table.row.end(a)
for (i in 1:n) {
a<-table.row.start(a)
a<-table.element(a,i, 1, TRUE)
a<-table.element(a,x[i])
a<-table.element(a,x[i]-mysum$resid[i])
a<-table.element(a,mysum$resid[i])
a<-table.row.end(a)
}
a<-table.end(a)
table.save(a,file='mytable4.tab')
if (n > n25) {
a<-table.start()
a<-table.row.start(a)
a<-table.element(a,'Goldfeld-Quandt test for Heteroskedasticity',4,TRUE)
a<-table.row.end(a)
a<-table.row.start(a)
a<-table.element(a,'p-values',header=TRUE)
a<-table.element(a,'Alternative Hypothesis',3,header=TRUE)
a<-table.row.end(a)
a<-table.row.start(a)
a<-table.element(a,'breakpoint index',header=TRUE)
a<-table.element(a,'greater',header=TRUE)
a<-table.element(a,'2-sided',header=TRUE)
a<-table.element(a,'less',header=TRUE)
a<-table.row.end(a)
for (mypoint in kp3:nmkm3) {
a<-table.row.start(a)
a<-table.element(a,mypoint,header=TRUE)
a<-table.element(a,gqarr[mypoint-kp3+1,1])
a<-table.element(a,gqarr[mypoint-kp3+1,2])
a<-table.element(a,gqarr[mypoint-kp3+1,3])
a<-table.row.end(a)
}
a<-table.end(a)
table.save(a,file='mytable5.tab')
a<-table.start()
a<-table.row.start(a)
a<-table.element(a,'Meta Analysis of Goldfeld-Quandt test for Heteroskedasticity',4,TRUE)
a<-table.row.end(a)
a<-table.row.start(a)
a<-table.element(a,'Description',header=TRUE)
a<-table.element(a,'# significant tests',header=TRUE)
a<-table.element(a,'% significant tests',header=TRUE)
a<-table.element(a,'OK/NOK',header=TRUE)
a<-table.row.end(a)
a<-table.row.start(a)
a<-table.element(a,'1% type I error level',header=TRUE)
a<-table.element(a,numsignificant1)
a<-table.element(a,numsignificant1/numgqtests)
if (numsignificant1/numgqtests < 0.01) dum <- 'OK' else dum <- 'NOK'
a<-table.element(a,dum)
a<-table.row.end(a)
a<-table.row.start(a)
a<-table.element(a,'5% type I error level',header=TRUE)
a<-table.element(a,numsignificant5)
a<-table.element(a,numsignificant5/numgqtests)
if (numsignificant5/numgqtests < 0.05) dum <- 'OK' else dum <- 'NOK'
a<-table.element(a,dum)
a<-table.row.end(a)
a<-table.row.start(a)
a<-table.element(a,'10% type I error level',header=TRUE)
a<-table.element(a,numsignificant10)
a<-table.element(a,numsignificant10/numgqtests)
if (numsignificant10/numgqtests < 0.1) dum <- 'OK' else dum <- 'NOK'
a<-table.element(a,dum)
a<-table.row.end(a)
a<-table.end(a)
table.save(a,file='mytable6.tab')
}