| Multiple Linear Regression - Estimated Regression Equation |
| Y[t] = -354.405794860257 + 29.7764909584763X[t] + 0.290728283519998Y1[t] + 0.417952030129352Y2[t] + 349.124779045002M1[t] + 399.919848770249M2[t] + 18.1139165012463M3[t] + 433.072144216138M4[t] + 677.964093127146M5[t] + 325.673309002917M6[t] + 672.482518326726M7[t] + 384.104420017886M8[t] + 406.540579208735M9[t] + 707.44158962931M10[t] + 52.8413553507744M11[t] + 1.93405432247590t + e[t] |
| Multiple Linear Regression - Ordinary Least Squares | |||||
| Variable | Parameter | S.D. | T-STAT H0: parameter = 0 | 2-tail p-value | 1-tail p-value |
| (Intercept) | -354.405794860257 | 656.464213 | -0.5399 | 0.592137 | 0.296069 |
| X | 29.7764909584763 | 23.707188 | 1.256 | 0.216054 | 0.108027 |
| Y1 | 0.290728283519998 | 0.140916 | 2.0631 | 0.045317 | 0.022659 |
| Y2 | 0.417952030129352 | 0.145559 | 2.8714 | 0.006379 | 0.003189 |
| M1 | 349.124779045002 | 165.378287 | 2.1111 | 0.04076 | 0.02038 |
| M2 | 399.919848770249 | 184.340475 | 2.1695 | 0.035756 | 0.017878 |
| M3 | 18.1139165012463 | 187.011243 | 0.0969 | 0.923298 | 0.461649 |
| M4 | 433.072144216138 | 185.205537 | 2.3383 | 0.024206 | 0.012103 |
| M5 | 677.964093127146 | 213.776534 | 3.1714 | 0.002833 | 0.001417 |
| M6 | 325.673309002917 | 205.220172 | 1.5869 | 0.120026 | 0.060013 |
| M7 | 672.482518326726 | 197.407667 | 3.4066 | 0.00146 | 0.00073 |
| M8 | 384.104420017886 | 224.188549 | 1.7133 | 0.094029 | 0.047015 |
| M9 | 406.540579208735 | 207.312869 | 1.961 | 0.056532 | 0.028266 |
| M10 | 707.44158962931 | 218.701478 | 3.2347 | 0.002375 | 0.001188 |
| M11 | 52.8413553507744 | 180.631129 | 0.2925 | 0.771316 | 0.385658 |
| t | 1.93405432247590 | 2.32745 | 0.831 | 0.410687 | 0.205343 |
| Multiple Linear Regression - Regression Statistics | |
| Multiple R | 0.824472354264483 |
| R-squared | 0.679754662946419 |
| Adjusted R-squared | 0.565381328284426 |
| F-TEST (value) | 5.94329670421251 |
| F-TEST (DF numerator) | 15 |
| F-TEST (DF denominator) | 42 |
| p-value | 2.32630427787761e-06 |
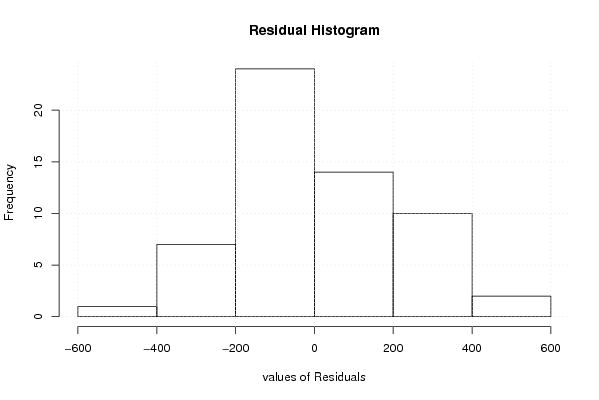
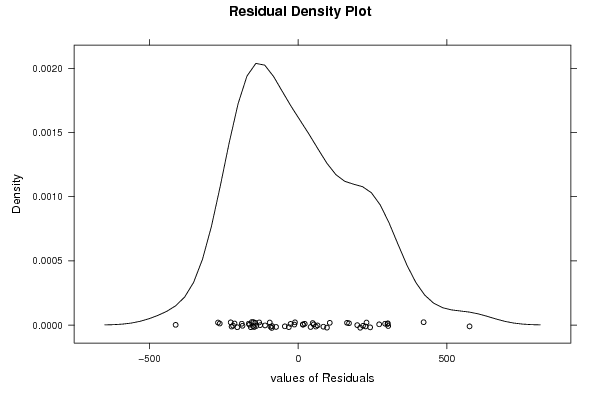
| Multiple Linear Regression - Residual Statistics | |
| Residual Standard Deviation | 231.92820960305 |
| Sum Squared Residuals | 2259209.16520640 |
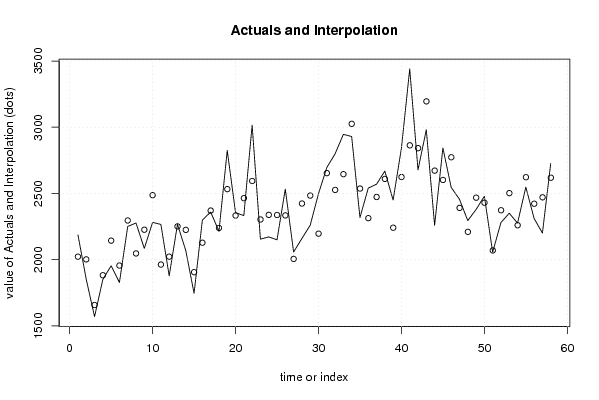
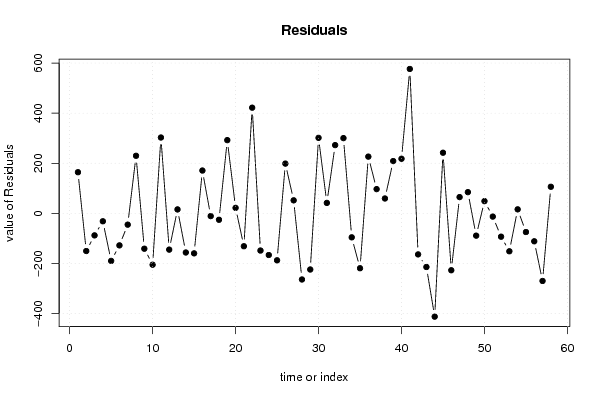
| Multiple Linear Regression - Actuals, Interpolation, and Residuals | |||
| Time or Index | Actuals | Interpolation Forecast | Residuals Prediction Error |
| 1 | 2187 | 2022.76963728308 | 164.230362716923 |
| 2 | 1852 | 2002.43806994740 | -150.438069947396 |
| 3 | 1570 | 1657.97699283292 | -87.9769928329201 |
| 4 | 1851 | 1882.64645978279 | -31.6464597827909 |
| 5 | 1954 | 2143.92467281833 | -189.924672818327 |
| 6 | 1828 | 1955.84572216472 | -127.845722164720 |
| 7 | 2251 | 2296.11803571157 | -45.1180357115703 |
| 8 | 2277 | 2047.23595980354 | 229.764040196457 |
| 9 | 2085 | 2226.18232647463 | -141.182326474627 |
| 10 | 2282 | 2487.04196266105 | -205.041962661050 |
| 11 | 2266 | 1963.26256866182 | 302.737431338177 |
| 12 | 1878 | 2022.79430508701 | -144.794305087011 |
| 13 | 2267 | 2251.38568287081 | 15.6143171291875 |
| 14 | 2069 | 2225.26623055915 | -156.266230559150 |
| 15 | 1746 | 1905.74875575827 | -159.748755758267 |
| 16 | 2299 | 2128.11540567798 | 170.884594322023 |
| 17 | 2360 | 2370.93915300776 | -10.9391530077634 |
| 18 | 2214 | 2239.66783020379 | -25.6678302037859 |
| 19 | 2825 | 2532.75040004802 | 292.249599951978 |
| 20 | 2355 | 2333.14384993501 | 21.8561500649853 |
| 21 | 2333 | 2464.32986421958 | -131.329864219584 |
| 22 | 3016 | 2594.10794352288 | 421.892056477123 |
| 23 | 2155 | 2303.51788410729 | -148.517884107292 |
| 24 | 2172 | 2338.37480217603 | -166.374802176033 |
| 25 | 2150 | 2337.49696751783 | -187.496967517826 |
| 26 | 2533 | 2334.35992101920 | 198.640078980798 |
| 27 | 2058 | 2006.02199636858 | 51.9780036314203 |
| 28 | 2160 | 2424.05042760256 | -264.050427602557 |
| 29 | 2260 | 2484.13760686855 | -224.137606868552 |
| 30 | 2498 | 2196.55186520445 | 301.448134795550 |
| 31 | 2695 | 2653.30601424558 | 41.6939857544177 |
| 32 | 2799 | 2526.58567437929 | 272.414325620709 |
| 33 | 2946 | 2645.66228473909 | 300.337715260908 |
| 34 | 2930 | 3025.76847100549 | -95.7684710054936 |
| 35 | 2318 | 2537.08495439264 | -219.084954392643 |
| 36 | 2540 | 2313.47530775143 | 226.524692248574 |
| 37 | 2570 | 2473.28917762118 | 96.7108223788196 |
| 38 | 2669 | 2609.65960628813 | 59.3403937118668 |
| 39 | 2450 | 2241.33189835549 | 208.668101644509 |
| 40 | 2842 | 2624.02134090139 | 217.978659098606 |
| 41 | 3440 | 2863.50484571791 | 576.495154282087 |
| 42 | 2678 | 2841.90787798428 | -163.907877984282 |
| 43 | 2981 | 3195.2303108389 | -214.230310838900 |
| 44 | 2260 | 2672.44219160883 | -412.442191608833 |
| 45 | 2844 | 2601.92618145004 | 242.073818549958 |
| 46 | 2546 | 2773.20315004551 | -227.203150045510 |
| 47 | 2456 | 2391.13459283824 | 64.865407161758 |
| 48 | 2295 | 2210.35558498553 | 84.6444150144698 |
| 49 | 2379 | 2468.05853470710 | -89.0585347071042 |
| 50 | 2479 | 2430.27617218612 | 48.7238278138816 |
| 51 | 2057 | 2069.92035668474 | -12.9203566847428 |
| 52 | 2280 | 2373.16636603528 | -93.1663660352822 |
| 53 | 2351 | 2502.49372158744 | -151.493721587444 |
| 54 | 2276 | 2260.02670444276 | 15.9732955572386 |
| 55 | 2548 | 2622.59523915593 | -74.5952391559254 |
| 56 | 2311 | 2422.59232427332 | -111.592324273318 |
| 57 | 2201 | 2470.89934311665 | -269.899343116654 |
| 58 | 2725 | 2618.87847276507 | 106.121527234931 |
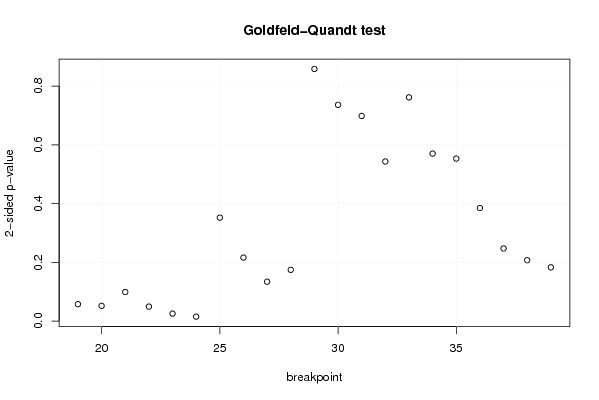
| Goldfeld-Quandt test for Heteroskedasticity | |||
| p-values | Alternative Hypothesis | ||
| breakpoint index | greater | 2-sided | less |
| 19 | 0.0288054233547557 | 0.0576108467095114 | 0.971194576645244 |
| 20 | 0.0259396296345399 | 0.0518792592690798 | 0.97406037036546 |
| 21 | 0.049423175173336 | 0.098846350346672 | 0.950576824826664 |
| 22 | 0.024667628869918 | 0.049335257739836 | 0.975332371130082 |
| 23 | 0.0126697804682836 | 0.0253395609365672 | 0.987330219531716 |
| 24 | 0.00753926751212804 | 0.0150785350242561 | 0.992460732487872 |
| 25 | 0.176084655598167 | 0.352169311196333 | 0.823915344401833 |
| 26 | 0.108074653596999 | 0.216149307193997 | 0.891925346403001 |
| 27 | 0.0670796891691306 | 0.134159378338261 | 0.93292031083087 |
| 28 | 0.0872551949980472 | 0.174510389996094 | 0.912744805001953 |
| 29 | 0.429210506070552 | 0.858421012141104 | 0.570789493929448 |
| 30 | 0.368034566840438 | 0.736069133680875 | 0.631965433159562 |
| 31 | 0.349266744511663 | 0.698533489023326 | 0.650733255488337 |
| 32 | 0.271655285113476 | 0.543310570226952 | 0.728344714886524 |
| 33 | 0.380826456613756 | 0.761652913227511 | 0.619173543386244 |
| 34 | 0.285140417896361 | 0.570280835792722 | 0.714859582103639 |
| 35 | 0.27662058223366 | 0.55324116446732 | 0.72337941776634 |
| 36 | 0.192462744525136 | 0.384925489050272 | 0.807537255474864 |
| 37 | 0.123598085817568 | 0.247196171635136 | 0.876401914182432 |
| 38 | 0.103621127666641 | 0.207242255333281 | 0.89637887233336 |
| 39 | 0.0915090611975366 | 0.183018122395073 | 0.908490938802463 |
| Meta Analysis of Goldfeld-Quandt test for Heteroskedasticity | |||
| Description | # significant tests | % significant tests | OK/NOK |
| 1% type I error level | 0 | 0 | OK |
| 5% type I error level | 3 | 0.142857142857143 | NOK |
| 10% type I error level | 6 | 0.285714285714286 | NOK |