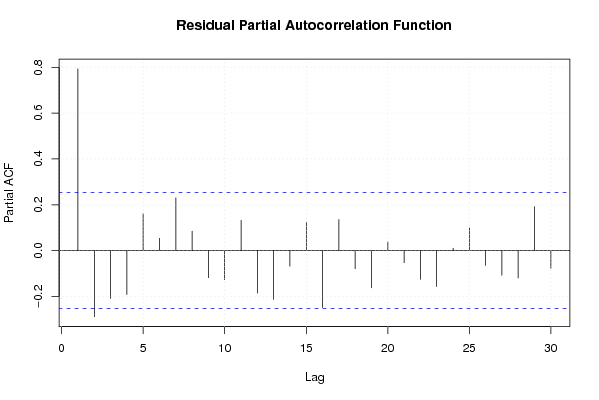
| Multiple Linear Regression - Estimated Regression Equation |
| Y[t] = + 158.174107787313 + 3.15903440532521X[t] + 7.17135863608437M1[t] + 18.9423684069826M2[t] + 26.7225368914909M3[t] + 31.8935466623894M4[t] + 38.1508183628733M5[t] + 41.8900212527067M6[t] + 50.8017480017109M7[t] + 48.4730063891785M8[t] + 1.00503949795491M9[t] -10.0552603790734M10[t] -14.9796712513701M11[t] + 0.106093445077124t + e[t] |
| Multiple Linear Regression - Ordinary Least Squares | |||||
| Variable | Parameter | S.D. | T-STAT H0: parameter = 0 | 2-tail p-value | 1-tail p-value |
| (Intercept) | 158.174107787313 | 20.36803 | 7.7658 | 0 | 0 |
| X | 3.15903440532521 | 0.13742 | 22.9882 | 0 | 0 |
| M1 | 7.17135863608437 | 5.228004 | 1.3717 | 0.176804 | 0.088402 |
| M2 | 18.9423684069826 | 5.317214 | 3.5625 | 0.000868 | 0.000434 |
| M3 | 26.7225368914909 | 5.367904 | 4.9782 | 9e-06 | 5e-06 |
| M4 | 31.8935466623894 | 5.487856 | 5.8117 | 1e-06 | 0 |
| M5 | 38.1508183628733 | 5.741441 | 6.6448 | 0 | 0 |
| M6 | 41.8900212527067 | 5.893795 | 7.1075 | 0 | 0 |
| M7 | 50.8017480017109 | 6.34908 | 8.0014 | 0 | 0 |
| M8 | 48.4730063891785 | 6.187157 | 7.8345 | 0 | 0 |
| M9 | 1.00503949795491 | 5.069341 | 0.1983 | 0.843716 | 0.421858 |
| M10 | -10.0552603790734 | 5.274256 | -1.9065 | 0.062846 | 0.031423 |
| M11 | -14.9796712513701 | 5.199309 | -2.8811 | 0.006002 | 0.003001 |
| t | 0.106093445077124 | 0.095191 | 1.1145 | 0.270842 | 0.135421 |
| Multiple Linear Regression - Regression Statistics | |
| Multiple R | 0.985469174259445 |
| R-squared | 0.971149493415593 |
| Adjusted R-squared | 0.96299608938087 |
| F-TEST (value) | 119.109698143213 |
| F-TEST (DF numerator) | 13 |
| F-TEST (DF denominator) | 46 |
| p-value | 0 |
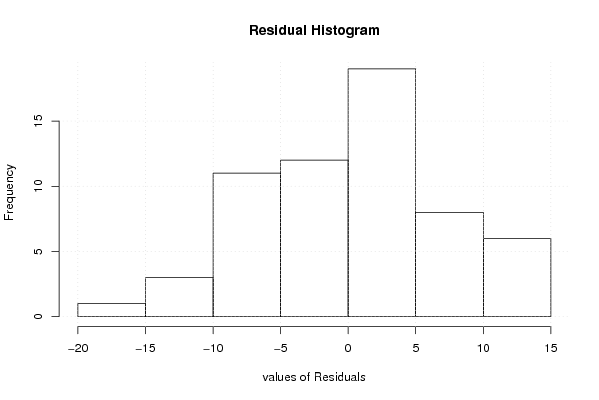
| Multiple Linear Regression - Residual Statistics | |
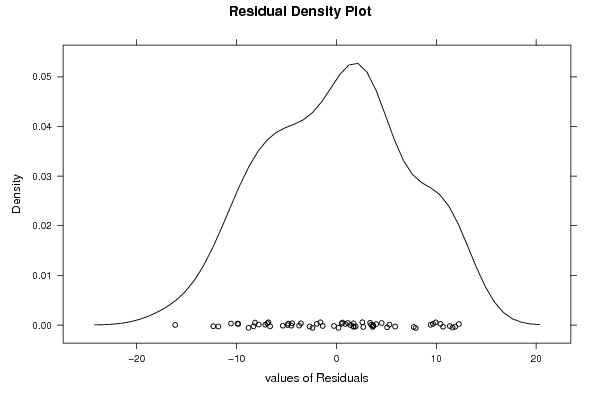
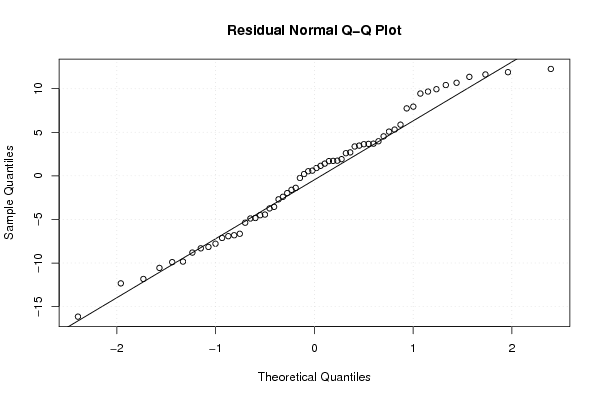
| Residual Standard Deviation | 7.92410001262523 |
| Sum Squared Residuals | 2888.40260646401 |
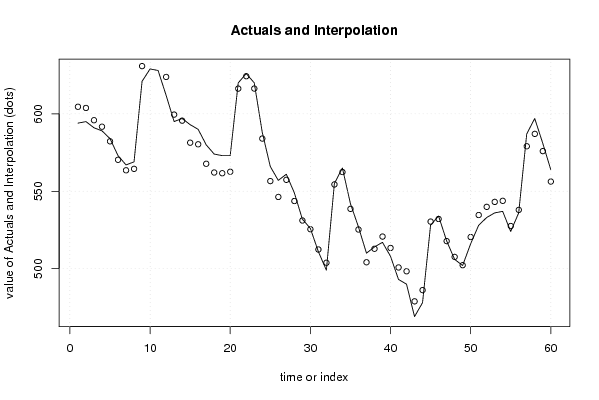
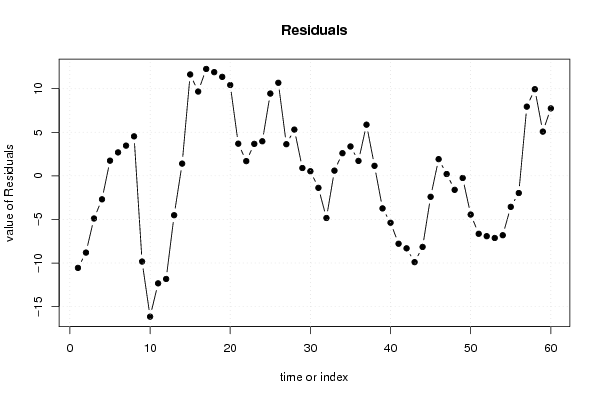
| Multiple Linear Regression - Actuals, Interpolation, and Residuals | |||
| Time or Index | Actuals | Interpolation Forecast | Residuals Prediction Error |
| 1 | 594 | 604.557342208677 | -10.5573422086767 |
| 2 | 595 | 603.798307803352 | -8.79830780335244 |
| 3 | 591 | 595.889397706312 | -4.88939770631167 |
| 4 | 589 | 591.689397706312 | -2.68939770631171 |
| 5 | 584 | 582.257590825247 | 1.74240917475338 |
| 6 | 573 | 570.307715133531 | 2.69228486646883 |
| 7 | 567 | 563.530363300986 | 3.46963669901351 |
| 8 | 569 | 564.466749538856 | 4.53325046114361 |
| 9 | 621 | 630.830114684417 | -9.83011468441741 |
| 10 | 629 | 645.148183495068 | -16.1481834950678 |
| 11 | 628 | 640.329866067848 | -12.3298660678483 |
| 12 | 612 | 623.825286711043 | -11.8252867110434 |
| 13 | 595 | 599.512394738953 | -4.51239473895285 |
| 14 | 597 | 595.594325928302 | 1.40567407169782 |
| 15 | 593 | 581.367347020611 | 11.6326529793889 |
| 16 | 590 | 580.326381425936 | 9.67361857406367 |
| 17 | 580 | 567.735540139546 | 12.2644598604539 |
| 18 | 574 | 562.103733258481 | 11.8962667415190 |
| 19 | 573 | 561.644450236587 | 11.3555497634133 |
| 20 | 573 | 562.580836474457 | 10.4191635255433 |
| 21 | 620 | 616.308063998717 | 3.69193600128316 |
| 22 | 626 | 624.308063998717 | 1.69193600128316 |
| 23 | 620 | 616.330712166172 | 3.66928783382787 |
| 24 | 588 | 584.030960782741 | 3.96903921725878 |
| 25 | 566 | 556.559034405325 | 9.44096559467457 |
| 26 | 557 | 546.322896784024 | 10.6771032159756 |
| 27 | 561 | 557.368193118935 | 3.63180688106504 |
| 28 | 549 | 543.691089902959 | 5.30891009704066 |
| 29 | 532 | 531.100248616569 | 0.899751383430905 |
| 30 | 526 | 525.468441735504 | 0.531558264495951 |
| 31 | 511 | 512.373021092309 | -1.37302109230892 |
| 32 | 499 | 503.832304114203 | -4.83230411420321 |
| 33 | 555 | 554.400497233138 | 0.599502766861832 |
| 34 | 565 | 562.400497233138 | 2.59950276686183 |
| 35 | 542 | 538.627973373967 | 3.37202662603257 |
| 36 | 527 | 525.282428422488 | 1.71757157751225 |
| 37 | 510 | 504.128570855722 | 5.87142914427761 |
| 38 | 514 | 512.846639666373 | 1.15336033362744 |
| 39 | 517 | 520.732901595958 | -3.73290159595796 |
| 40 | 508 | 513.373867190633 | -5.37386719063274 |
| 41 | 493 | 500.783025904242 | -7.7830259042425 |
| 42 | 490 | 498.310253428503 | -8.31025342850267 |
| 43 | 469 | 478.896763974657 | -9.89676397465712 |
| 44 | 478 | 486.151219023177 | -8.15121902317745 |
| 45 | 528 | 530.401343331462 | -2.40134333146199 |
| 46 | 534 | 532.083274520812 | 1.91672547918841 |
| 47 | 518 | 517.787853877616 | 0.212146122383543 |
| 48 | 506 | 507.601343331462 | -1.60134333146200 |
| 49 | 502 | 502.242657791323 | -0.242657791322671 |
| 50 | 516 | 520.437829817948 | -4.43782981794846 |
| 51 | 528 | 534.642160558184 | -6.64216055818427 |
| 52 | 533 | 539.91926377416 | -6.91926377415988 |
| 53 | 536 | 543.123594514396 | -7.12359451439568 |
| 54 | 537 | 543.809856443981 | -6.80985644398105 |
| 55 | 524 | 527.555401395461 | -3.55540139546071 |
| 56 | 536 | 537.968890849306 | -1.96889084930627 |
| 57 | 587 | 579.059980752266 | 7.9400192477344 |
| 58 | 597 | 587.059980752266 | 9.9400192477344 |
| 59 | 581 | 575.923594514396 | 5.07640548560431 |
| 60 | 564 | 556.259980752266 | 7.7400192477344 |
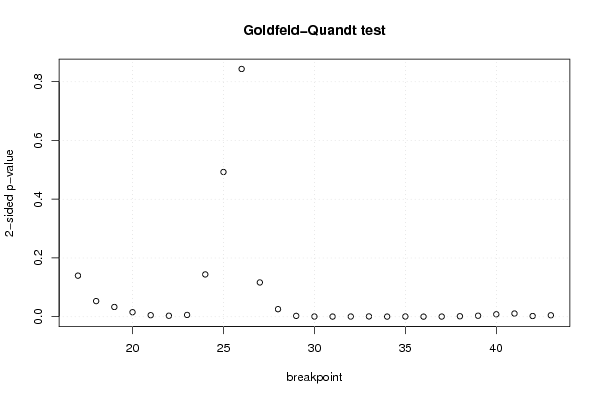
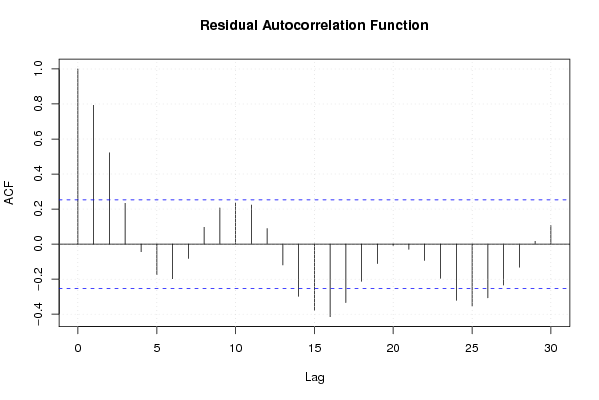
| Goldfeld-Quandt test for Heteroskedasticity | |||
| p-values | Alternative Hypothesis | ||
| breakpoint index | greater | 2-sided | less |
| 17 | 0.0698410505817522 | 0.139682101163504 | 0.930158949418248 |
| 18 | 0.0265773223806266 | 0.0531546447612532 | 0.973422677619373 |
| 19 | 0.0165351675698308 | 0.0330703351396616 | 0.983464832430169 |
| 20 | 0.00764504467241015 | 0.0152900893448203 | 0.99235495532759 |
| 21 | 0.00254174829197577 | 0.00508349658395155 | 0.997458251708024 |
| 22 | 0.00160537419240822 | 0.00321074838481643 | 0.998394625807592 |
| 23 | 0.00298609251568892 | 0.00597218503137784 | 0.99701390748431 |
| 24 | 0.0719522019474392 | 0.143904403894878 | 0.92804779805256 |
| 25 | 0.246309832164153 | 0.492619664328306 | 0.753690167835847 |
| 26 | 0.42173714941043 | 0.84347429882086 | 0.57826285058957 |
| 27 | 0.941688627046338 | 0.116622745907323 | 0.0583113729536615 |
| 28 | 0.98715970816847 | 0.0256805836630611 | 0.0128402918315306 |
| 29 | 0.99859558743232 | 0.00280882513536134 | 0.00140441256768067 |
| 30 | 0.9997309433418 | 0.000538113316398872 | 0.000269056658199436 |
| 31 | 0.999810505750171 | 0.000378988499657203 | 0.000189494249828602 |
| 32 | 0.999726450706752 | 0.000547098586495609 | 0.000273549293247805 |
| 33 | 0.999541199908133 | 0.000917600183734092 | 0.000458800091867046 |
| 34 | 0.999820172554044 | 0.000359654891911693 | 0.000179827445955846 |
| 35 | 0.999624317743806 | 0.000751364512388064 | 0.000375682256194032 |
| 36 | 0.999933457250053 | 0.000133085499893650 | 6.65427499468252e-05 |
| 37 | 0.999770523296114 | 0.000458953407771695 | 0.000229476703885848 |
| 38 | 0.9992428658988 | 0.00151426820239966 | 0.000757134101199828 |
| 39 | 0.998365695675077 | 0.00326860864984644 | 0.00163430432492322 |
| 40 | 0.995918938959885 | 0.0081621220802294 | 0.0040810610401147 |
| 41 | 0.994641982920189 | 0.0107160341596223 | 0.00535801707981113 |
| 42 | 0.99884169392775 | 0.00231661214450080 | 0.00115830607225040 |
| 43 | 0.997614461056328 | 0.00477107788734414 | 0.00238553894367207 |
| Meta Analysis of Goldfeld-Quandt test for Heteroskedasticity | |||
| Description | # significant tests | % significant tests | OK/NOK |
| 1% type I error level | 17 | 0.62962962962963 | NOK |
| 5% type I error level | 21 | 0.777777777777778 | NOK |
| 10% type I error level | 22 | 0.814814814814815 | NOK |