| Multiple Linear Regression - Estimated Regression Equation |
| Y[t] = + 3519.20884433017 -133.248614219740X[t] + 139.001639814284M1[t] -102.846618326212M2[t] + 178.070681575751M3[t] + 54.1918478919903M4[t] + 58.254634682221M5[t] + 434.105083146815M6[t] -0.527524565871434M7[t] -107.043783873772M8[t] -95.1437206735603M9[t] + 121.860871361363M10[t] -213.409675181739M11[t] -3.75486919097563t + e[t] |
| Multiple Linear Regression - Ordinary Least Squares | |||||
| Variable | Parameter | S.D. | T-STAT H0: parameter = 0 | 2-tail p-value | 1-tail p-value |
| (Intercept) | 3519.20884433017 | 557.462363 | 6.3129 | 0 | 0 |
| X | -133.248614219740 | 72.790718 | -1.8306 | 0.072789 | 0.036395 |
| M1 | 139.001639814284 | 165.753363 | 0.8386 | 0.405457 | 0.202729 |
| M2 | -102.846618326212 | 174.824432 | -0.5883 | 0.55884 | 0.27942 |
| M3 | 178.070681575751 | 174.152211 | 1.0225 | 0.311189 | 0.155594 |
| M4 | 54.1918478919903 | 169.465562 | 0.3198 | 0.750392 | 0.375196 |
| M5 | 58.254634682221 | 166.308104 | 0.3503 | 0.727516 | 0.363758 |
| M6 | 434.105083146815 | 165.58332 | 2.6217 | 0.011396 | 0.005698 |
| M7 | -0.527524565871434 | 165.694531 | -0.0032 | 0.997472 | 0.498736 |
| M8 | -107.043783873772 | 175.542562 | -0.6098 | 0.544608 | 0.272304 |
| M9 | -95.1437206735603 | 177.874743 | -0.5349 | 0.594962 | 0.297481 |
| M10 | 121.860871361363 | 175.276724 | 0.6952 | 0.489937 | 0.244968 |
| M11 | -213.409675181739 | 173.103362 | -1.2328 | 0.223074 | 0.111537 |
| t | -3.75486919097563 | 2.423851 | -1.5491 | 0.127301 | 0.06365 |
| Multiple Linear Regression - Regression Statistics | |
| Multiple R | 0.66356672214392 |
| R-squared | 0.440320794736827 |
| Adjusted R-squared | 0.303040989672275 |
| F-TEST (value) | 3.20746955118256 |
| F-TEST (DF numerator) | 13 |
| F-TEST (DF denominator) | 53 |
| p-value | 0.00132221729725535 |
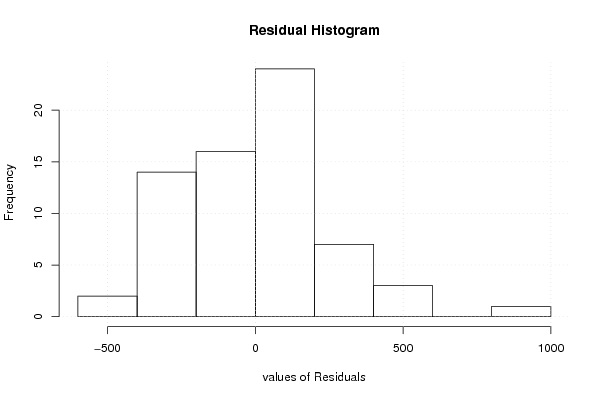
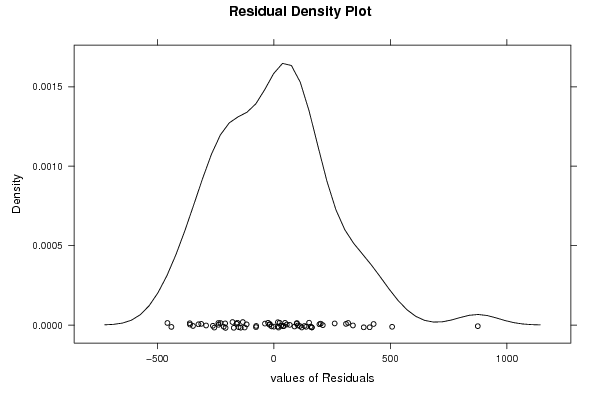
| Multiple Linear Regression - Residual Statistics | |
| Residual Standard Deviation | 273.356717095901 |
| Sum Squared Residuals | 3960366.42341676 |
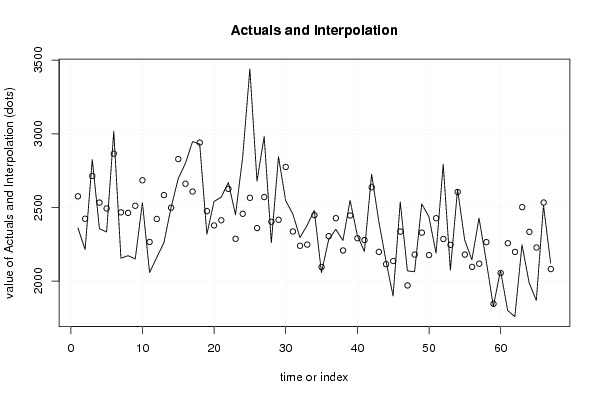
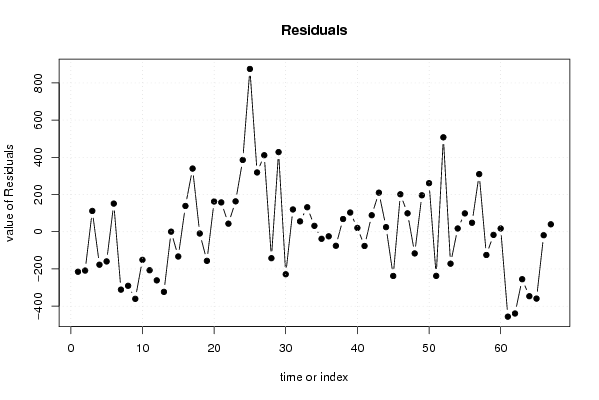
| Multiple Linear Regression - Actuals, Interpolation, and Residuals | |||
| Time or Index | Actuals | Interpolation Forecast | Residuals Prediction Error |
| 1 | 2360 | 2575.14183977359 | -215.141839773588 |
| 2 | 2214 | 2422.81274239593 | -208.812742395935 |
| 3 | 2825 | 2713.30003452890 | 111.699965471104 |
| 4 | 2355 | 2532.36688596626 | -177.366885966264 |
| 5 | 2333 | 2492.70021929960 | -159.700219299598 |
| 6 | 3016 | 2864.79579857322 | 151.204201426783 |
| 7 | 2155 | 2466.38290593548 | -311.382905935476 |
| 8 | 2172 | 2462.71066881239 | -290.710668812391 |
| 9 | 2150 | 2510.83044708755 | -360.830447087549 |
| 10 | 2533 | 2684.10558566558 | -151.105585665575 |
| 11 | 2058 | 2265.13100139965 | -207.131001399654 |
| 12 | 2160 | 2421.48636170252 | -261.486361702521 |
| 13 | 2260 | 2583.38285516978 | -323.382855169777 |
| 14 | 2498 | 2497.67806490199 | 0.321935098006225 |
| 15 | 2695 | 2828.13994130088 | -133.139941300876 |
| 16 | 2799 | 2660.53165416022 | 138.468345839782 |
| 17 | 2947 | 2607.54012607158 | 339.459873928422 |
| 18 | 2930 | 2939.66112107927 | -9.66112107927486 |
| 19 | 2318 | 2474.62392133166 | -156.623921331664 |
| 20 | 2540 | 2377.67765425476 | 162.322345745238 |
| 21 | 2570 | 2412.47257110795 | 157.527428892054 |
| 22 | 2669 | 2625.72229395189 | 43.2777060481061 |
| 23 | 2450 | 2286.69687821782 | 163.303121782184 |
| 24 | 2842 | 2456.37709994266 | 385.622900057342 |
| 25 | 3440 | 2564.97414772202 | 875.025852277982 |
| 26 | 2678 | 2359.34560465647 | 318.654395343532 |
| 27 | 2981 | 2569.88372825759 | 411.116271742414 |
| 28 | 2260 | 2402.27544111693 | -142.275441116927 |
| 29 | 2844 | 2415.90822013816 | 428.091779861843 |
| 30 | 2546 | 2774.6789379898 | -228.678937989802 |
| 31 | 2456 | 2336.29146108614 | 119.708538913861 |
| 32 | 2295 | 2239.34519400924 | 55.6548059907635 |
| 33 | 2379 | 2247.49038801847 | 131.509611981527 |
| 34 | 2479 | 2447.41524944045 | 31.5847505595531 |
| 35 | 2057 | 2095.06497228440 | -38.0649722843948 |
| 36 | 2280 | 2304.71977827516 | -24.7197782751585 |
| 37 | 2351 | 2426.64168747649 | -75.641687476493 |
| 38 | 2276 | 2207.68828298897 | 68.3117170110307 |
| 39 | 2548 | 2444.87612943403 | 103.123870565966 |
| 40 | 2311 | 2290.59270371535 | 20.4072962846498 |
| 41 | 2201 | 2277.57575989263 | -76.5757598926314 |
| 42 | 2725 | 2636.34647774428 | 88.6535222557235 |
| 43 | 2408 | 2197.95900084061 | 210.040999159386 |
| 44 | 2139 | 2114.33759518569 | 24.6624048143146 |
| 45 | 1898 | 2135.80765061690 | -237.807650616896 |
| 46 | 2537 | 2335.73251203887 | 201.267487961130 |
| 47 | 2069 | 1970.05737346084 | 98.9426265391564 |
| 48 | 2063 | 2179.71217945161 | -116.712179451607 |
| 49 | 2524 | 2328.28381149689 | 195.716188503111 |
| 50 | 2437 | 2175.95471411924 | 261.045285880764 |
| 51 | 2189 | 2426.46742198627 | -237.467421986275 |
| 52 | 2793 | 2285.50885768956 | 507.491142310435 |
| 53 | 2074 | 2245.8421910229 | -171.842191022898 |
| 54 | 2622 | 2604.61290887454 | 17.3870911254571 |
| 55 | 2278 | 2179.55029339285 | 98.4497066071456 |
| 56 | 2144 | 2095.92888773793 | 48.0711122620743 |
| 57 | 2427 | 2117.39894316914 | 309.601056830864 |
| 58 | 2139 | 2264.02435890321 | -125.024358903214 |
| 59 | 1828 | 1845.04977463729 | -17.0497746372923 |
| 60 | 2072 | 2054.70458062806 | 17.2954193719441 |
| 61 | 1800 | 2256.57565836123 | -456.575658361234 |
| 62 | 1758 | 2197.52059093740 | -439.520590937398 |
| 63 | 2246 | 2501.33274449233 | -255.332744492333 |
| 64 | 1987 | 2333.72445735168 | -346.724457351675 |
| 65 | 1868 | 2227.43348357514 | -359.433483575138 |
| 66 | 2514 | 2532.90475573889 | -18.9047557388873 |
| 67 | 2121 | 2081.19241741325 | 39.8075825867489 |
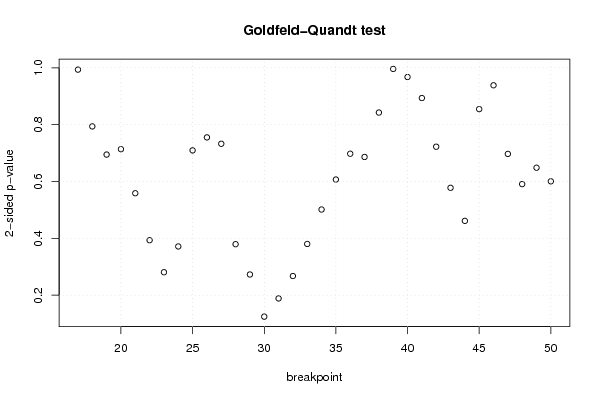
| Goldfeld-Quandt test for Heteroskedasticity | |||
| p-values | Alternative Hypothesis | ||
| breakpoint index | greater | 2-sided | less |
| 17 | 0.496805399670399 | 0.993610799340798 | 0.503194600329601 |
| 18 | 0.396938280151417 | 0.793876560302835 | 0.603061719848583 |
| 19 | 0.347406952016174 | 0.694813904032348 | 0.652593047983826 |
| 20 | 0.356898439012097 | 0.713796878024193 | 0.643101560987903 |
| 21 | 0.279395816323647 | 0.558791632647294 | 0.720604183676353 |
| 22 | 0.196764398023303 | 0.393528796046605 | 0.803235601976697 |
| 23 | 0.140470297772478 | 0.280940595544956 | 0.859529702227522 |
| 24 | 0.185806726685232 | 0.371613453370464 | 0.814193273314768 |
| 25 | 0.64523224804515 | 0.709535503909699 | 0.354767751954849 |
| 26 | 0.622388023510538 | 0.755223952978924 | 0.377611976489462 |
| 27 | 0.63359433692049 | 0.73281132615902 | 0.36640566307951 |
| 28 | 0.810211883362749 | 0.379576233274502 | 0.189788116637251 |
| 29 | 0.863500868806761 | 0.272998262386479 | 0.136499131193239 |
| 30 | 0.93765800036458 | 0.124683999270841 | 0.0623419996354203 |
| 31 | 0.905578628222724 | 0.188842743554552 | 0.0944213717772758 |
| 32 | 0.866206190139715 | 0.26758761972057 | 0.133793809860285 |
| 33 | 0.809807202523997 | 0.380385594952006 | 0.190192797476003 |
| 34 | 0.749229959342771 | 0.501540081314457 | 0.250770040657229 |
| 35 | 0.696488556831307 | 0.607022886337387 | 0.303511443168693 |
| 36 | 0.651114852137796 | 0.697770295724408 | 0.348885147862204 |
| 37 | 0.656796720443134 | 0.686406559113732 | 0.343203279556866 |
| 38 | 0.578705350755326 | 0.842589298489347 | 0.421294649244674 |
| 39 | 0.497987866616541 | 0.995975733233081 | 0.502012133383459 |
| 40 | 0.483815505691916 | 0.967631011383833 | 0.516184494308084 |
| 41 | 0.446840617124146 | 0.893681234248292 | 0.553159382875854 |
| 42 | 0.361213236702167 | 0.722426473404334 | 0.638786763297833 |
| 43 | 0.288954383756259 | 0.577908767512519 | 0.71104561624374 |
| 44 | 0.230811508699243 | 0.461623017398486 | 0.769188491300757 |
| 45 | 0.572664771527221 | 0.854670456945558 | 0.427335228472779 |
| 46 | 0.469254170338386 | 0.938508340676772 | 0.530745829661614 |
| 47 | 0.348538669483704 | 0.697077338967407 | 0.651461330516296 |
| 48 | 0.295471601088233 | 0.590943202176465 | 0.704528398911767 |
| 49 | 0.324296862045532 | 0.648593724091065 | 0.675703137954468 |
| 50 | 0.300360990531469 | 0.600721981062939 | 0.69963900946853 |
| Meta Analysis of Goldfeld-Quandt test for Heteroskedasticity | |||
| Description | # significant tests | % significant tests | OK/NOK |
| 1% type I error level | 0 | 0 | OK |
| 5% type I error level | 0 | 0 | OK |
| 10% type I error level | 0 | 0 | OK |