| Multiple Linear Regression - Estimated Regression Equation |
| TWIB[t] = + 17275.6362570304 + 1316.09095825163GI[t] + 0.993868125182958TWIB1[t] -0.0712656523643038TWIB2[t] + 0.0674558849413127TWIB3[t] -0.0287714131544064TWIB4[t] -3746.49879045247M1[t] + 7599.43785050854M2[t] + 58721.4905633282M3[t] + 16139.1979301117M4[t] + 2816.99152249312M5[t] -7256.21688681164M6[t] -7886.08593225942M7[t] + 11261.2367889179M8[t] + 8262.97224709365M9[t] + 2729.07025670023M10[t] -2820.30522071984M11[t] -171.699244602508t + e[t] |
| Multiple Linear Regression - Ordinary Least Squares | |||||
| Variable | Parameter | S.D. | T-STAT H0: parameter = 0 | 2-tail p-value | 1-tail p-value |
| (Intercept) | 17275.6362570304 | 17561.365367 | 0.9837 | 0.329985 | 0.164992 |
| GI | 1316.09095825163 | 1186.514877 | 1.1092 | 0.272647 | 0.136324 |
| TWIB1 | 0.993868125182958 | 0.147446 | 6.7406 | 0 | 0 |
| TWIB2 | -0.0712656523643038 | 0.203243 | -0.3506 | 0.727329 | 0.363665 |
| TWIB3 | 0.0674558849413127 | 0.204108 | 0.3305 | 0.742409 | 0.371205 |
| TWIB4 | -0.0287714131544064 | 0.163704 | -0.1758 | 0.861198 | 0.430599 |
| M1 | -3746.49879045247 | 4270.554276 | -0.8773 | 0.384527 | 0.192264 |
| M2 | 7599.43785050854 | 4474.853782 | 1.6983 | 0.095676 | 0.047838 |
| M3 | 58721.4905633282 | 4549.386707 | 12.9076 | 0 | 0 |
| M4 | 16139.1979301117 | 10133.028737 | 1.5927 | 0.117523 | 0.058762 |
| M5 | 2816.99152249312 | 10768.99041 | 0.2616 | 0.794717 | 0.397359 |
| M6 | -7256.21688681164 | 10088.815973 | -0.7192 | 0.475345 | 0.237673 |
| M7 | -7886.08593225942 | 4241.612296 | -1.8592 | 0.068886 | 0.034443 |
| M8 | 11261.2367889179 | 4638.97371 | 2.4275 | 0.018845 | 0.009423 |
| M9 | 8262.97224709365 | 5705.528505 | 1.4482 | 0.153792 | 0.076896 |
| M10 | 2729.07025670023 | 5403.998736 | 0.505 | 0.615771 | 0.307885 |
| M11 | -2820.30522071984 | 4349.957979 | -0.6484 | 0.519724 | 0.259862 |
| t | -171.699244602508 | 77.763277 | -2.208 | 0.031861 | 0.015931 |
| Multiple Linear Regression - Regression Statistics | |
| Multiple R | 0.99031942858933 |
| R-squared | 0.980732570641498 |
| Adjusted R-squared | 0.974181644659608 |
| F-TEST (value) | 149.708998903765 |
| F-TEST (DF numerator) | 17 |
| F-TEST (DF denominator) | 50 |
| p-value | 0 |
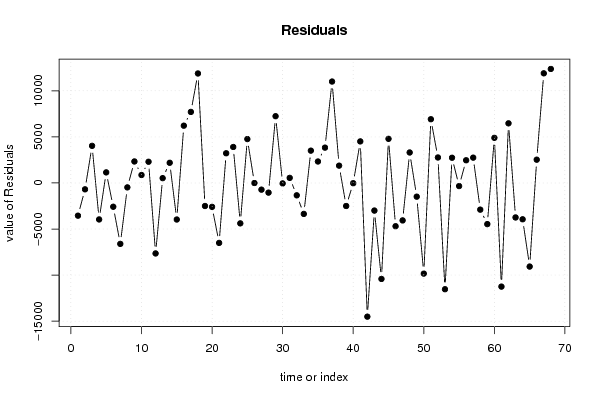
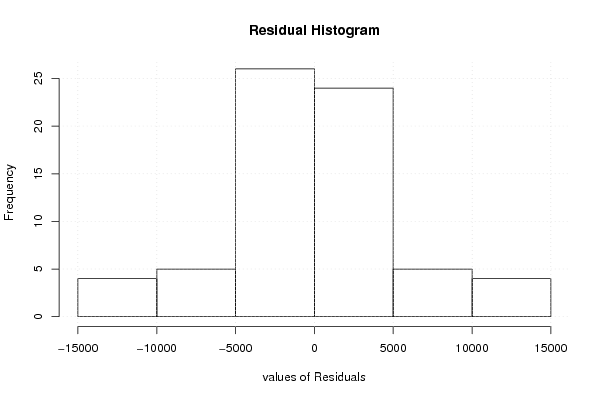
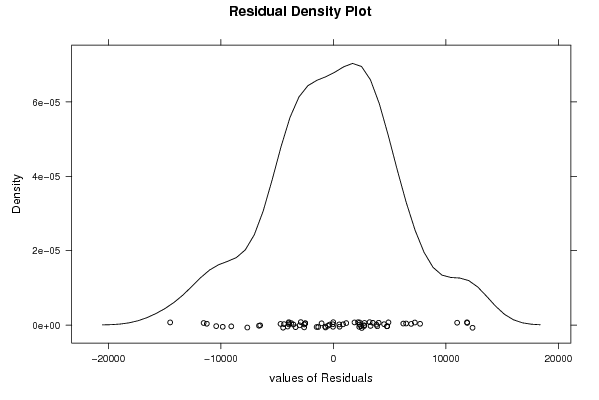
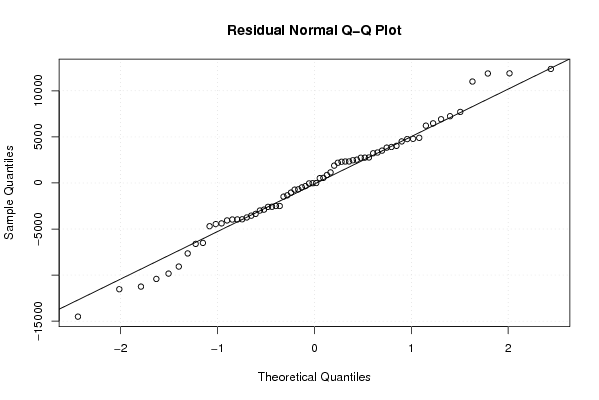
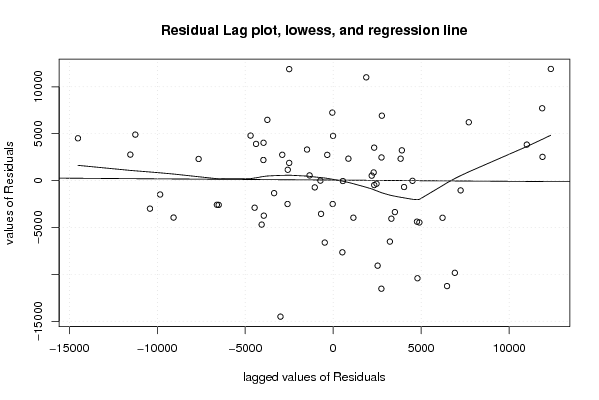
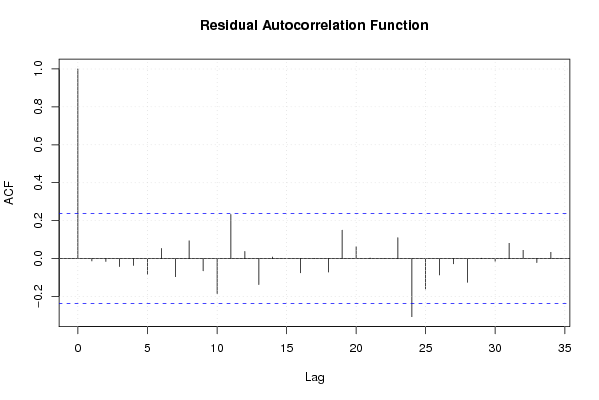
| Multiple Linear Regression - Residual Statistics | |
| Residual Standard Deviation | 6547.42229412788 |
| Sum Squared Residuals | 2143436934.88214 |
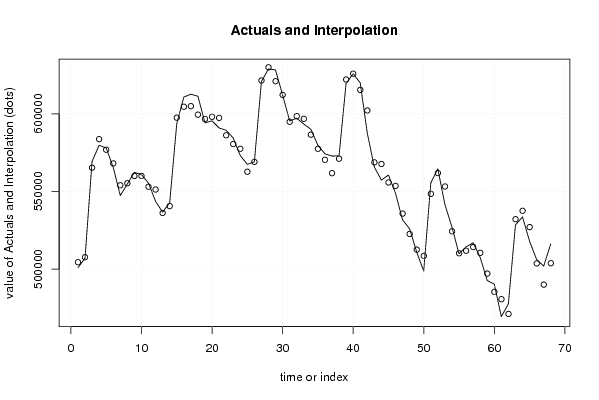
| Multiple Linear Regression - Actuals, Interpolation, and Residuals | |||
| Time or Index | Actuals | Interpolation Forecast | Residuals Prediction Error |
| 1 | 500857 | 504407.745017719 | -3550.74501771933 |
| 2 | 506971 | 507662.863167248 | -691.863167248181 |
| 3 | 569323 | 565296.70127828 | 4026.29872172049 |
| 4 | 579714 | 583673.595229676 | -3959.5952296759 |
| 5 | 577992 | 576845.391273155 | 1146.60872684491 |
| 6 | 565464 | 568047.013135975 | -2583.01313597482 |
| 7 | 547344 | 553955.572470251 | -6611.57247025056 |
| 8 | 554788 | 555268.389727549 | -480.389727548675 |
| 9 | 562325 | 559992.570932732 | 2332.42906726787 |
| 10 | 560854 | 559990.572582427 | 863.427417573398 |
| 11 | 555332 | 553030.650048601 | 2301.34995139921 |
| 12 | 543599 | 551248.234096493 | -7649.23409649282 |
| 13 | 536662 | 536141.259820804 | 520.740179196085 |
| 14 | 542722 | 540532.197996587 | 2189.80200341266 |
| 15 | 593530 | 597498.787075112 | -3968.78707511180 |
| 16 | 610763 | 604547.401469138 | 6215.59853086158 |
| 17 | 612613 | 604905.111717016 | 7707.88828298418 |
| 18 | 611324 | 599444.946616662 | 11879.0533833384 |
| 19 | 594167 | 596667.87197037 | -2500.87197037077 |
| 20 | 595454 | 598049.31888168 | -2595.31888168041 |
| 21 | 590865 | 597372.599515779 | -6507.59951577861 |
| 22 | 589379 | 586157.382484993 | 3221.61751500652 |
| 23 | 584428 | 580524.950146184 | 3903.04985381575 |
| 24 | 573100 | 577485.795545908 | -4385.79554590806 |
| 25 | 567456 | 562693.688203579 | 4762.31179642101 |
| 26 | 569028 | 569037.829636641 | -9.82963664104096 |
| 27 | 620735 | 621462.683237327 | -727.683237327405 |
| 28 | 628884 | 629931.802456431 | -1047.80245643126 |
| 29 | 628232 | 620988.812480671 | 7243.18751932896 |
| 30 | 612117 | 612168.217214259 | -51.2172142585296 |
| 31 | 595404 | 594853.771126114 | 550.228873886237 |
| 32 | 597141 | 598483.710419055 | -1342.71041905507 |
| 33 | 593408 | 596768.038502108 | -3360.03850210763 |
| 34 | 590072 | 586564.800235606 | 3507.19976439398 |
| 35 | 579799 | 577470.979957666 | 2328.02004233444 |
| 36 | 574205 | 570371.968520231 | 3833.03147976879 |
| 37 | 572775 | 561771.773284433 | 11003.2267155672 |
| 38 | 572942 | 571063.228257736 | 1878.77174226378 |
| 39 | 619567 | 622068.078996888 | -2501.07899688827 |
| 40 | 625809 | 625837.381557325 | -28.3815573246587 |
| 41 | 619916 | 615408.457050431 | 4507.54294956895 |
| 42 | 587625 | 602133.77923798 | -14508.7792379797 |
| 43 | 565742 | 568738.776302509 | -2996.77630250886 |
| 44 | 557274 | 567689.714085332 | -10415.7140853318 |
| 45 | 560576 | 555786.122338448 | 4789.87766155205 |
| 46 | 548854 | 553550.28086485 | -4696.28086485043 |
| 47 | 531673 | 535738.935004051 | -4065.9350040508 |
| 48 | 525919 | 522613.644357082 | 3305.35564291816 |
| 49 | 511038 | 512525.768638526 | -1487.76863852633 |
| 50 | 498662 | 508498.615973561 | -9836.6159735607 |
| 51 | 555362 | 548447.151280625 | 6914.84871937448 |
| 52 | 564591 | 561825.987310169 | 2765.01268983071 |
| 53 | 541657 | 553188.650559148 | -11531.6505591479 |
| 54 | 527070 | 524331.529781122 | 2738.47021887835 |
| 55 | 509846 | 510184.46123992 | -338.461239919696 |
| 56 | 514258 | 511795.123945436 | 2462.87605456408 |
| 57 | 516922 | 514176.668710934 | 2745.33128906632 |
| 58 | 507561 | 510456.963832123 | -2895.96383212348 |
| 59 | 492622 | 497088.484843499 | -4466.48484349860 |
| 60 | 490243 | 485346.357480286 | 4896.64251971393 |
| 61 | 469357 | 480604.765034939 | -11247.7650349387 |
| 62 | 477580 | 471110.264968227 | 6469.73503177348 |
| 63 | 528379 | 532122.598131767 | -3743.5981317675 |
| 64 | 533590 | 537534.83197726 | -3944.83197726046 |
| 65 | 517945 | 527018.576919579 | -9073.57691957914 |
| 66 | 506174 | 503648.514014004 | 2525.48598599633 |
| 67 | 501866 | 489968.546890836 | 11897.4531091636 |
| 68 | 516141 | 503769.742940948 | 12371.2570590519 |
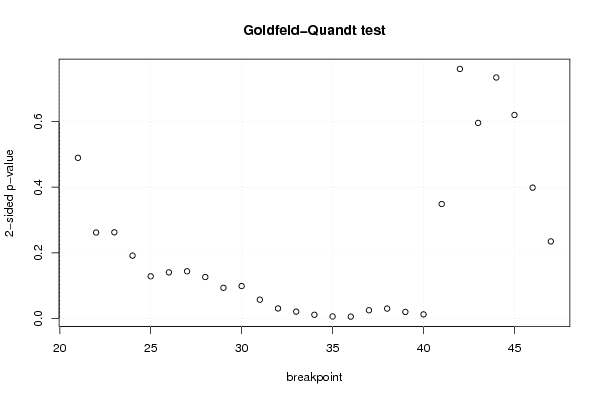
| Goldfeld-Quandt test for Heteroskedasticity | |||
| p-values | Alternative Hypothesis | ||
| breakpoint index | greater | 2-sided | less |
| 21 | 0.244755101856145 | 0.48951020371229 | 0.755244898143855 |
| 22 | 0.131062324440033 | 0.262124648880067 | 0.868937675559966 |
| 23 | 0.131429522329580 | 0.262859044659161 | 0.86857047767042 |
| 24 | 0.0959278348596336 | 0.191855669719267 | 0.904072165140366 |
| 25 | 0.0644993318449881 | 0.128998663689976 | 0.935500668155012 |
| 26 | 0.0704632139261235 | 0.140926427852247 | 0.929536786073876 |
| 27 | 0.0721121292654934 | 0.144224258530987 | 0.927887870734507 |
| 28 | 0.0633604626136546 | 0.126720925227309 | 0.936639537386345 |
| 29 | 0.0469818879513698 | 0.0939637759027396 | 0.95301811204863 |
| 30 | 0.0496422749715974 | 0.0992845499431948 | 0.950357725028403 |
| 31 | 0.0289026372518688 | 0.0578052745037376 | 0.971097362748131 |
| 32 | 0.0156041633738551 | 0.0312083267477102 | 0.984395836626145 |
| 33 | 0.0107307255446393 | 0.0214614510892786 | 0.98926927445536 |
| 34 | 0.00597005126666958 | 0.0119401025333392 | 0.99402994873333 |
| 35 | 0.00342244969225003 | 0.00684489938450006 | 0.99657755030775 |
| 36 | 0.00310376382352101 | 0.00620752764704201 | 0.996896236176479 |
| 37 | 0.0128347198687290 | 0.0256694397374581 | 0.987165280131271 |
| 38 | 0.0153706438994184 | 0.0307412877988369 | 0.984629356100582 |
| 39 | 0.0102845303507961 | 0.0205690607015921 | 0.989715469649204 |
| 40 | 0.00655635205502375 | 0.0131127041100475 | 0.993443647944976 |
| 41 | 0.17445130612217 | 0.34890261224434 | 0.82554869387783 |
| 42 | 0.379965149056181 | 0.759930298112363 | 0.620034850943819 |
| 43 | 0.297880621384943 | 0.595761242769885 | 0.702119378615057 |
| 44 | 0.366985552014130 | 0.733971104028261 | 0.63301444798587 |
| 45 | 0.309924112901617 | 0.619848225803234 | 0.690075887098383 |
| 46 | 0.199407648793982 | 0.398815297587965 | 0.800592351206018 |
| 47 | 0.117564038001995 | 0.23512807600399 | 0.882435961998005 |
| Meta Analysis of Goldfeld-Quandt test for Heteroskedasticity | |||
| Description | # significant tests | % significant tests | OK/NOK |
| 1% type I error level | 2 | 0.0740740740740741 | NOK |
| 5% type I error level | 9 | 0.333333333333333 | NOK |
| 10% type I error level | 12 | 0.444444444444444 | NOK |