Free Statistics

of Irreproducible Research!

Author's title

Author*The author of this computation has been verified*
R Software Modulerwasp_multipleregression.wasp
Title produced by softwareMultiple Regression
Date of computationFri, 20 Nov 2009 12:09:34 -0700
Cite this page as followsStatistical Computations at FreeStatistics.org, Office for Research Development and Education, URL https://freestatistics.org/blog/index.php?v=date/2009/Nov/20/t1258744295w60tct8u3te8z41.htm/, Retrieved Thu, 25 Apr 2024 21:36:38 +0000
Statistical Computations at FreeStatistics.org, Office for Research Development and Education, URL https://freestatistics.org/blog/index.php?pk=58429, Retrieved Thu, 25 Apr 2024 21:36:38 +0000
QR Codes:

Original text written by user:
IsPrivate?No (this computation is public)
User-defined keywords
Estimated Impact131
Family? (F = Feedback message, R = changed R code, M = changed R Module, P = changed Parameters, D = changed Data)
-     [Multiple Regression] [Q1 The Seatbeltlaw] [2007-11-14 19:27:43] [8cd6641b921d30ebe00b648d1481bba0]
- RMPD  [Multiple Regression] [Seatbelt] [2009-11-12 13:54:52] [b98453cac15ba1066b407e146608df68]
-   PD      [Multiple Regression] [JJ Workshop 7, Mu...] [2009-11-20 19:09:34] [e31f2fa83f4a5291b9a51009566cf69b] [Current]
Feedback Forum

Post a new message
Dataseries X:
95.1	93.8
97	93.8
112.7	107.6
102.9	101
97.4	95.4
111.4	96.5
87.4	89.2
96.8	87.1
114.1	110.5
110.3	110.8
103.9	104.2
101.6	88.9
94.6	89.8
95.9	90
104.7	93.9
102.8	91.3
98.1	87.8
113.9	99.7
80.9	73.5
95.7	79.2
113.2	96.9
105.9	95.2
108.8	95.6
102.3	89.7
99	92.8
100.7	88
115.5	101.1
100.7	92.7
109.9	95.8
114.6	103.8
85.4	81.8
100.5	87.1
114.8	105.9
116.5	108.1
112.9	102.6
102	93.7
106	103.5
105.3	100.6
118.8	113.3
106.1	102.4
109.3	102.1
117.2	106.9
92.5	87.3
104.2	93.1
112.5	109.1
122.4	120.3
113.3	104.9
100	92.6
110.7	109.8
112.8	111.4
109.8	117.9
117.3	121.6
109.1	117.8
115.9	124.2
96	106.8
99.8	102.7
116.8	116.8
115.7	113.6
99.4	96.1
94.3	85


Summary of computational transaction
Raw Inputview raw input (R code)
Raw Outputview raw output of R engine
Computing time3 seconds
R Server'Gwilym Jenkins' @ 72.249.127.135

\begin{tabular}{lllllllll}
\hline
Summary of computational transaction \tabularnewline
Raw Input & view raw input (R code)  \tabularnewline
Raw Output & view raw output of R engine  \tabularnewline
Computing time & 3 seconds \tabularnewline
R Server & 'Gwilym Jenkins' @ 72.249.127.135 \tabularnewline
\hline
\end{tabular}
%Source: https://freestatistics.org/blog/index.php?pk=58429&T=0

[TABLE]
[ROW][C]Summary of computational transaction[/C][/ROW]
[ROW][C]Raw Input[/C][C]view raw input (R code) [/C][/ROW]
[ROW][C]Raw Output[/C][C]view raw output of R engine [/C][/ROW]
[ROW][C]Computing time[/C][C]3 seconds[/C][/ROW]
[ROW][C]R Server[/C][C]'Gwilym Jenkins' @ 72.249.127.135[/C][/ROW]
[/TABLE]
Source: https://freestatistics.org/blog/index.php?pk=58429&T=0

Globally Unique Identifier (entire table): ba.freestatistics.org/blog/index.php?pk=58429&T=0

As an alternative you can also use a QR Code:  

The GUIDs for individual cells are displayed in the table below:

Summary of computational transaction
Raw Inputview raw input (R code)
Raw Outputview raw output of R engine
Computing time3 seconds
R Server'Gwilym Jenkins' @ 72.249.127.135


Multiple Linear Regression - Estimated Regression Equation
TIA[t] = + 61.8575669338312 + 0.424343554858512IAidM[t] -2.33777469667370M1[t] -0.577049301940704M2[t] + 5.13951514947417M3[t] + 0.904259181572388M4[t] + 0.561433162386583M5[t] + 7.66866066909776M6[t] -10.6409835660198M7[t] -0.580591902319806M8[t] + 6.66122411022697M9[t] + 5.794379453676M10[t] + 3.07952396301393M11[t] + e[t]

\begin{tabular}{lllllllll}
\hline
Multiple Linear Regression - Estimated Regression Equation \tabularnewline
TIA[t] =  +  61.8575669338312 +  0.424343554858512IAidM[t] -2.33777469667370M1[t] -0.577049301940704M2[t] +  5.13951514947417M3[t] +  0.904259181572388M4[t] +  0.561433162386583M5[t] +  7.66866066909776M6[t] -10.6409835660198M7[t] -0.580591902319806M8[t] +  6.66122411022697M9[t] +  5.794379453676M10[t] +  3.07952396301393M11[t]  + e[t] \tabularnewline
\hline
\end{tabular}
%Source: https://freestatistics.org/blog/index.php?pk=58429&T=1

[TABLE]
[ROW][C]Multiple Linear Regression - Estimated Regression Equation[/C][/ROW]
[ROW][C]TIA[t] =  +  61.8575669338312 +  0.424343554858512IAidM[t] -2.33777469667370M1[t] -0.577049301940704M2[t] +  5.13951514947417M3[t] +  0.904259181572388M4[t] +  0.561433162386583M5[t] +  7.66866066909776M6[t] -10.6409835660198M7[t] -0.580591902319806M8[t] +  6.66122411022697M9[t] +  5.794379453676M10[t] +  3.07952396301393M11[t]  + e[t][/C][/ROW]
[/TABLE]
Source: https://freestatistics.org/blog/index.php?pk=58429&T=1

Globally Unique Identifier (entire table): ba.freestatistics.org/blog/index.php?pk=58429&T=1

As an alternative you can also use a QR Code:  

The GUIDs for individual cells are displayed in the table below:

Multiple Linear Regression - Estimated Regression Equation
TIA[t] = + 61.8575669338312 + 0.424343554858512IAidM[t] -2.33777469667370M1[t] -0.577049301940704M2[t] + 5.13951514947417M3[t] + 0.904259181572388M4[t] + 0.561433162386583M5[t] + 7.66866066909776M6[t] -10.6409835660198M7[t] -0.580591902319806M8[t] + 6.66122411022697M9[t] + 5.794379453676M10[t] + 3.07952396301393M11[t] + e[t]


Multiple Linear Regression - Ordinary Least Squares
VariableParameterS.D.T-STATH0: parameter = 02-tail p-value1-tail p-value
(Intercept)61.85756693383125.49052311.266200
IAidM0.4243435548585120.0581097.302600
M1-2.337774696673702.414311-0.96830.3378520.168926
M2-0.5770493019407042.402117-0.24020.81120.4056
M35.139515149474172.5623612.00580.0506560.025328
M40.9042591815723882.4671240.36650.7156190.35781
M50.5614331623865832.4370550.23040.8188010.409401
M67.668660669097762.5505863.00660.0042310.002116
M7-10.64098356601982.373224-4.48384.7e-052.4e-05
M8-0.5805919023198062.369602-0.2450.807510.403755
M96.661224110226972.5868932.5750.0132320.006616
M105.7943794536762.6295922.20350.0324930.016247
M113.079523963013932.4498031.2570.2149470.107473

\begin{tabular}{lllllllll}
\hline
Multiple Linear Regression - Ordinary Least Squares \tabularnewline
Variable & Parameter & S.D. & T-STATH0: parameter = 0 & 2-tail p-value & 1-tail p-value \tabularnewline
(Intercept) & 61.8575669338312 & 5.490523 & 11.2662 & 0 & 0 \tabularnewline
IAidM & 0.424343554858512 & 0.058109 & 7.3026 & 0 & 0 \tabularnewline
M1 & -2.33777469667370 & 2.414311 & -0.9683 & 0.337852 & 0.168926 \tabularnewline
M2 & -0.577049301940704 & 2.402117 & -0.2402 & 0.8112 & 0.4056 \tabularnewline
M3 & 5.13951514947417 & 2.562361 & 2.0058 & 0.050656 & 0.025328 \tabularnewline
M4 & 0.904259181572388 & 2.467124 & 0.3665 & 0.715619 & 0.35781 \tabularnewline
M5 & 0.561433162386583 & 2.437055 & 0.2304 & 0.818801 & 0.409401 \tabularnewline
M6 & 7.66866066909776 & 2.550586 & 3.0066 & 0.004231 & 0.002116 \tabularnewline
M7 & -10.6409835660198 & 2.373224 & -4.4838 & 4.7e-05 & 2.4e-05 \tabularnewline
M8 & -0.580591902319806 & 2.369602 & -0.245 & 0.80751 & 0.403755 \tabularnewline
M9 & 6.66122411022697 & 2.586893 & 2.575 & 0.013232 & 0.006616 \tabularnewline
M10 & 5.794379453676 & 2.629592 & 2.2035 & 0.032493 & 0.016247 \tabularnewline
M11 & 3.07952396301393 & 2.449803 & 1.257 & 0.214947 & 0.107473 \tabularnewline
\hline
\end{tabular}
%Source: https://freestatistics.org/blog/index.php?pk=58429&T=2

[TABLE]
[ROW][C]Multiple Linear Regression - Ordinary Least Squares[/C][/ROW]
[ROW][C]Variable[/C][C]Parameter[/C][C]S.D.[/C][C]T-STATH0: parameter = 0[/C][C]2-tail p-value[/C][C]1-tail p-value[/C][/ROW]
[ROW][C](Intercept)[/C][C]61.8575669338312[/C][C]5.490523[/C][C]11.2662[/C][C]0[/C][C]0[/C][/ROW]
[ROW][C]IAidM[/C][C]0.424343554858512[/C][C]0.058109[/C][C]7.3026[/C][C]0[/C][C]0[/C][/ROW]
[ROW][C]M1[/C][C]-2.33777469667370[/C][C]2.414311[/C][C]-0.9683[/C][C]0.337852[/C][C]0.168926[/C][/ROW]
[ROW][C]M2[/C][C]-0.577049301940704[/C][C]2.402117[/C][C]-0.2402[/C][C]0.8112[/C][C]0.4056[/C][/ROW]
[ROW][C]M3[/C][C]5.13951514947417[/C][C]2.562361[/C][C]2.0058[/C][C]0.050656[/C][C]0.025328[/C][/ROW]
[ROW][C]M4[/C][C]0.904259181572388[/C][C]2.467124[/C][C]0.3665[/C][C]0.715619[/C][C]0.35781[/C][/ROW]
[ROW][C]M5[/C][C]0.561433162386583[/C][C]2.437055[/C][C]0.2304[/C][C]0.818801[/C][C]0.409401[/C][/ROW]
[ROW][C]M6[/C][C]7.66866066909776[/C][C]2.550586[/C][C]3.0066[/C][C]0.004231[/C][C]0.002116[/C][/ROW]
[ROW][C]M7[/C][C]-10.6409835660198[/C][C]2.373224[/C][C]-4.4838[/C][C]4.7e-05[/C][C]2.4e-05[/C][/ROW]
[ROW][C]M8[/C][C]-0.580591902319806[/C][C]2.369602[/C][C]-0.245[/C][C]0.80751[/C][C]0.403755[/C][/ROW]
[ROW][C]M9[/C][C]6.66122411022697[/C][C]2.586893[/C][C]2.575[/C][C]0.013232[/C][C]0.006616[/C][/ROW]
[ROW][C]M10[/C][C]5.794379453676[/C][C]2.629592[/C][C]2.2035[/C][C]0.032493[/C][C]0.016247[/C][/ROW]
[ROW][C]M11[/C][C]3.07952396301393[/C][C]2.449803[/C][C]1.257[/C][C]0.214947[/C][C]0.107473[/C][/ROW]
[/TABLE]
Source: https://freestatistics.org/blog/index.php?pk=58429&T=2

Globally Unique Identifier (entire table): ba.freestatistics.org/blog/index.php?pk=58429&T=2

As an alternative you can also use a QR Code:  

The GUIDs for individual cells are displayed in the table below:

Multiple Linear Regression - Ordinary Least Squares
VariableParameterS.D.T-STATH0: parameter = 02-tail p-value1-tail p-value
(Intercept)61.85756693383125.49052311.266200
IAidM0.4243435548585120.0581097.302600
M1-2.337774696673702.414311-0.96830.3378520.168926
M2-0.5770493019407042.402117-0.24020.81120.4056
M35.139515149474172.5623612.00580.0506560.025328
M40.9042591815723882.4671240.36650.7156190.35781
M50.5614331623865832.4370550.23040.8188010.409401
M67.668660669097762.5505863.00660.0042310.002116
M7-10.64098356601982.373224-4.48384.7e-052.4e-05
M8-0.5805919023198062.369602-0.2450.807510.403755
M96.661224110226972.5868932.5750.0132320.006616
M105.7943794536762.6295922.20350.0324930.016247
M113.079523963013932.4498031.2570.2149470.107473


Multiple Linear Regression - Regression Statistics
Multiple R0.928405747616052
R-squared0.86193723220652
Adjusted R-squared0.826687163833717
F-TEST (value)24.4520726340359
F-TEST (DF numerator)12
F-TEST (DF denominator)47
p-value3.33066907387547e-16
Multiple Linear Regression - Residual Statistics
Residual Standard Deviation3.74664781678294
Sum Squared Residuals659.756383561207

\begin{tabular}{lllllllll}
\hline
Multiple Linear Regression - Regression Statistics \tabularnewline
Multiple R & 0.928405747616052 \tabularnewline
R-squared & 0.86193723220652 \tabularnewline
Adjusted R-squared & 0.826687163833717 \tabularnewline
F-TEST (value) & 24.4520726340359 \tabularnewline
F-TEST (DF numerator) & 12 \tabularnewline
F-TEST (DF denominator) & 47 \tabularnewline
p-value & 3.33066907387547e-16 \tabularnewline
Multiple Linear Regression - Residual Statistics \tabularnewline
Residual Standard Deviation & 3.74664781678294 \tabularnewline
Sum Squared Residuals & 659.756383561207 \tabularnewline
\hline
\end{tabular}
%Source: https://freestatistics.org/blog/index.php?pk=58429&T=3

[TABLE]
[ROW][C]Multiple Linear Regression - Regression Statistics[/C][/ROW]
[ROW][C]Multiple R[/C][C]0.928405747616052[/C][/ROW]
[ROW][C]R-squared[/C][C]0.86193723220652[/C][/ROW]
[ROW][C]Adjusted R-squared[/C][C]0.826687163833717[/C][/ROW]
[ROW][C]F-TEST (value)[/C][C]24.4520726340359[/C][/ROW]
[ROW][C]F-TEST (DF numerator)[/C][C]12[/C][/ROW]
[ROW][C]F-TEST (DF denominator)[/C][C]47[/C][/ROW]
[ROW][C]p-value[/C][C]3.33066907387547e-16[/C][/ROW]
[ROW][C]Multiple Linear Regression - Residual Statistics[/C][/ROW]
[ROW][C]Residual Standard Deviation[/C][C]3.74664781678294[/C][/ROW]
[ROW][C]Sum Squared Residuals[/C][C]659.756383561207[/C][/ROW]
[/TABLE]
Source: https://freestatistics.org/blog/index.php?pk=58429&T=3

Globally Unique Identifier (entire table): ba.freestatistics.org/blog/index.php?pk=58429&T=3

As an alternative you can also use a QR Code:  

The GUIDs for individual cells are displayed in the table below:

Multiple Linear Regression - Regression Statistics
Multiple R0.928405747616052
R-squared0.86193723220652
Adjusted R-squared0.826687163833717
F-TEST (value)24.4520726340359
F-TEST (DF numerator)12
F-TEST (DF denominator)47
p-value3.33066907387547e-16
Multiple Linear Regression - Residual Statistics
Residual Standard Deviation3.74664781678294
Sum Squared Residuals659.756383561207


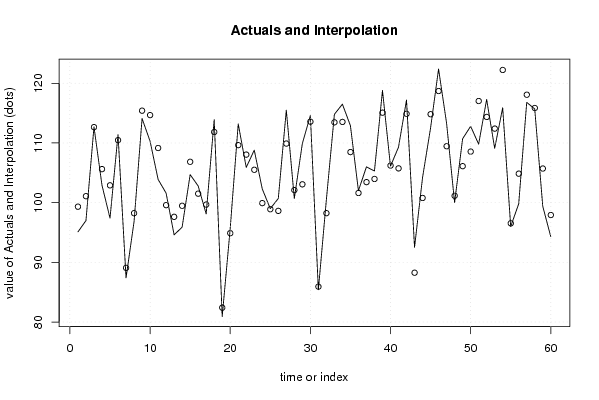
Multiple Linear Regression - Actuals, Interpolation, and Residuals
Time or IndexActualsInterpolationForecastResidualsPrediction Error
195.199.3232176828856-4.22321768288557
297101.083943077619-4.08394307761878
3112.7112.6564485860810.0435514139188484
4102.9105.620525156113-2.72052515611318
597.4102.901375229720-5.50137522971972
6111.4110.4753806467750.924619353224741
787.489.0680284611906-1.6680284611906
896.898.2372986596877-1.43729865968767
9114.1115.408753855924-1.30875385592365
10110.3114.669212265830-4.36921226583022
11103.9109.153689313102-5.25368931310196
12101.699.58170896075282.01829103924719
1394.697.6258434634518-3.02584346345177
1495.999.4714375691565-3.57143756915646
15104.7106.842941884520-2.14294188451953
16102.8101.5043926739861.29560732601438
1798.199.676364212795-1.57636421279503
18113.9111.8332800223222.06671997767750
1980.982.405834649912-1.50583464991196
2095.794.88498457630540.815015423694568
21113.2109.6376815098483.56231849015212
22105.9108.049452810037-2.14945281003743
23108.8105.5043347413193.29566525868124
24102.399.92118380463962.37881619536038
259998.89887412802730.101125871972705
26100.798.62275045943942.07724954056056
27115.5109.8982154795015.60178452049918
28100.7102.098473650788-1.39847365078754
29109.9103.0711126516636.82888734833688
30114.6113.5730885972421.02691140275759
3185.485.9278861552376-0.527886155237602
32100.598.23729865968772.26270134031232
33114.8113.4567735035741.34322649642551
34116.5113.5234846677122.97651533228777
35112.9108.4747396253284.42526037467166
36102101.6185580240740.381441975926336
37106103.4393501650132.56064983498662
38105.3103.9694792506571.33052074934331
39118.8115.0752068487753.72479315122533
40106.1106.214606132915-0.114606132915115
41109.3105.7444770472723.55552295272825
42117.2114.8885536173042.31144638269621
4392.588.26177570695944.23822429304057
44104.2100.7833599888393.41664001116125
45112.5114.814672879122-2.31467287912172
46122.4118.7004760369863.69952396301392
47113.3109.4507298015033.84927019849707
48100101.151780113729-1.15178011372930
49110.7106.1127145606224.587285439378
50112.8108.5523896431294.24761035687137
51109.8117.027187201124-7.22718720112383
52117.3114.3620023861992.93799761380146
53109.1112.406670858550-3.30667085855040
54115.9122.229697116356-6.32969711635605
559696.5364750267004-0.536475026700412
5699.8104.857058115480-5.05705811548047
57116.8118.082118251532-1.28211825153227
58115.7115.857374219434-0.157374219434048
5999.4105.716506518748-6.31650651874801
6094.397.9267690968046-3.62676909680461

\begin{tabular}{lllllllll}
\hline
Multiple Linear Regression - Actuals, Interpolation, and Residuals \tabularnewline
Time or Index & Actuals & InterpolationForecast & ResidualsPrediction Error \tabularnewline
1 & 95.1 & 99.3232176828856 & -4.22321768288557 \tabularnewline
2 & 97 & 101.083943077619 & -4.08394307761878 \tabularnewline
3 & 112.7 & 112.656448586081 & 0.0435514139188484 \tabularnewline
4 & 102.9 & 105.620525156113 & -2.72052515611318 \tabularnewline
5 & 97.4 & 102.901375229720 & -5.50137522971972 \tabularnewline
6 & 111.4 & 110.475380646775 & 0.924619353224741 \tabularnewline
7 & 87.4 & 89.0680284611906 & -1.6680284611906 \tabularnewline
8 & 96.8 & 98.2372986596877 & -1.43729865968767 \tabularnewline
9 & 114.1 & 115.408753855924 & -1.30875385592365 \tabularnewline
10 & 110.3 & 114.669212265830 & -4.36921226583022 \tabularnewline
11 & 103.9 & 109.153689313102 & -5.25368931310196 \tabularnewline
12 & 101.6 & 99.5817089607528 & 2.01829103924719 \tabularnewline
13 & 94.6 & 97.6258434634518 & -3.02584346345177 \tabularnewline
14 & 95.9 & 99.4714375691565 & -3.57143756915646 \tabularnewline
15 & 104.7 & 106.842941884520 & -2.14294188451953 \tabularnewline
16 & 102.8 & 101.504392673986 & 1.29560732601438 \tabularnewline
17 & 98.1 & 99.676364212795 & -1.57636421279503 \tabularnewline
18 & 113.9 & 111.833280022322 & 2.06671997767750 \tabularnewline
19 & 80.9 & 82.405834649912 & -1.50583464991196 \tabularnewline
20 & 95.7 & 94.8849845763054 & 0.815015423694568 \tabularnewline
21 & 113.2 & 109.637681509848 & 3.56231849015212 \tabularnewline
22 & 105.9 & 108.049452810037 & -2.14945281003743 \tabularnewline
23 & 108.8 & 105.504334741319 & 3.29566525868124 \tabularnewline
24 & 102.3 & 99.9211838046396 & 2.37881619536038 \tabularnewline
25 & 99 & 98.8988741280273 & 0.101125871972705 \tabularnewline
26 & 100.7 & 98.6227504594394 & 2.07724954056056 \tabularnewline
27 & 115.5 & 109.898215479501 & 5.60178452049918 \tabularnewline
28 & 100.7 & 102.098473650788 & -1.39847365078754 \tabularnewline
29 & 109.9 & 103.071112651663 & 6.82888734833688 \tabularnewline
30 & 114.6 & 113.573088597242 & 1.02691140275759 \tabularnewline
31 & 85.4 & 85.9278861552376 & -0.527886155237602 \tabularnewline
32 & 100.5 & 98.2372986596877 & 2.26270134031232 \tabularnewline
33 & 114.8 & 113.456773503574 & 1.34322649642551 \tabularnewline
34 & 116.5 & 113.523484667712 & 2.97651533228777 \tabularnewline
35 & 112.9 & 108.474739625328 & 4.42526037467166 \tabularnewline
36 & 102 & 101.618558024074 & 0.381441975926336 \tabularnewline
37 & 106 & 103.439350165013 & 2.56064983498662 \tabularnewline
38 & 105.3 & 103.969479250657 & 1.33052074934331 \tabularnewline
39 & 118.8 & 115.075206848775 & 3.72479315122533 \tabularnewline
40 & 106.1 & 106.214606132915 & -0.114606132915115 \tabularnewline
41 & 109.3 & 105.744477047272 & 3.55552295272825 \tabularnewline
42 & 117.2 & 114.888553617304 & 2.31144638269621 \tabularnewline
43 & 92.5 & 88.2617757069594 & 4.23822429304057 \tabularnewline
44 & 104.2 & 100.783359988839 & 3.41664001116125 \tabularnewline
45 & 112.5 & 114.814672879122 & -2.31467287912172 \tabularnewline
46 & 122.4 & 118.700476036986 & 3.69952396301392 \tabularnewline
47 & 113.3 & 109.450729801503 & 3.84927019849707 \tabularnewline
48 & 100 & 101.151780113729 & -1.15178011372930 \tabularnewline
49 & 110.7 & 106.112714560622 & 4.587285439378 \tabularnewline
50 & 112.8 & 108.552389643129 & 4.24761035687137 \tabularnewline
51 & 109.8 & 117.027187201124 & -7.22718720112383 \tabularnewline
52 & 117.3 & 114.362002386199 & 2.93799761380146 \tabularnewline
53 & 109.1 & 112.406670858550 & -3.30667085855040 \tabularnewline
54 & 115.9 & 122.229697116356 & -6.32969711635605 \tabularnewline
55 & 96 & 96.5364750267004 & -0.536475026700412 \tabularnewline
56 & 99.8 & 104.857058115480 & -5.05705811548047 \tabularnewline
57 & 116.8 & 118.082118251532 & -1.28211825153227 \tabularnewline
58 & 115.7 & 115.857374219434 & -0.157374219434048 \tabularnewline
59 & 99.4 & 105.716506518748 & -6.31650651874801 \tabularnewline
60 & 94.3 & 97.9267690968046 & -3.62676909680461 \tabularnewline
\hline
\end{tabular}
%Source: https://freestatistics.org/blog/index.php?pk=58429&T=4

[TABLE]
[ROW][C]Multiple Linear Regression - Actuals, Interpolation, and Residuals[/C][/ROW]
[ROW][C]Time or Index[/C][C]Actuals[/C][C]InterpolationForecast[/C][C]ResidualsPrediction Error[/C][/ROW]
[ROW][C]1[/C][C]95.1[/C][C]99.3232176828856[/C][C]-4.22321768288557[/C][/ROW]
[ROW][C]2[/C][C]97[/C][C]101.083943077619[/C][C]-4.08394307761878[/C][/ROW]
[ROW][C]3[/C][C]112.7[/C][C]112.656448586081[/C][C]0.0435514139188484[/C][/ROW]
[ROW][C]4[/C][C]102.9[/C][C]105.620525156113[/C][C]-2.72052515611318[/C][/ROW]
[ROW][C]5[/C][C]97.4[/C][C]102.901375229720[/C][C]-5.50137522971972[/C][/ROW]
[ROW][C]6[/C][C]111.4[/C][C]110.475380646775[/C][C]0.924619353224741[/C][/ROW]
[ROW][C]7[/C][C]87.4[/C][C]89.0680284611906[/C][C]-1.6680284611906[/C][/ROW]
[ROW][C]8[/C][C]96.8[/C][C]98.2372986596877[/C][C]-1.43729865968767[/C][/ROW]
[ROW][C]9[/C][C]114.1[/C][C]115.408753855924[/C][C]-1.30875385592365[/C][/ROW]
[ROW][C]10[/C][C]110.3[/C][C]114.669212265830[/C][C]-4.36921226583022[/C][/ROW]
[ROW][C]11[/C][C]103.9[/C][C]109.153689313102[/C][C]-5.25368931310196[/C][/ROW]
[ROW][C]12[/C][C]101.6[/C][C]99.5817089607528[/C][C]2.01829103924719[/C][/ROW]
[ROW][C]13[/C][C]94.6[/C][C]97.6258434634518[/C][C]-3.02584346345177[/C][/ROW]
[ROW][C]14[/C][C]95.9[/C][C]99.4714375691565[/C][C]-3.57143756915646[/C][/ROW]
[ROW][C]15[/C][C]104.7[/C][C]106.842941884520[/C][C]-2.14294188451953[/C][/ROW]
[ROW][C]16[/C][C]102.8[/C][C]101.504392673986[/C][C]1.29560732601438[/C][/ROW]
[ROW][C]17[/C][C]98.1[/C][C]99.676364212795[/C][C]-1.57636421279503[/C][/ROW]
[ROW][C]18[/C][C]113.9[/C][C]111.833280022322[/C][C]2.06671997767750[/C][/ROW]
[ROW][C]19[/C][C]80.9[/C][C]82.405834649912[/C][C]-1.50583464991196[/C][/ROW]
[ROW][C]20[/C][C]95.7[/C][C]94.8849845763054[/C][C]0.815015423694568[/C][/ROW]
[ROW][C]21[/C][C]113.2[/C][C]109.637681509848[/C][C]3.56231849015212[/C][/ROW]
[ROW][C]22[/C][C]105.9[/C][C]108.049452810037[/C][C]-2.14945281003743[/C][/ROW]
[ROW][C]23[/C][C]108.8[/C][C]105.504334741319[/C][C]3.29566525868124[/C][/ROW]
[ROW][C]24[/C][C]102.3[/C][C]99.9211838046396[/C][C]2.37881619536038[/C][/ROW]
[ROW][C]25[/C][C]99[/C][C]98.8988741280273[/C][C]0.101125871972705[/C][/ROW]
[ROW][C]26[/C][C]100.7[/C][C]98.6227504594394[/C][C]2.07724954056056[/C][/ROW]
[ROW][C]27[/C][C]115.5[/C][C]109.898215479501[/C][C]5.60178452049918[/C][/ROW]
[ROW][C]28[/C][C]100.7[/C][C]102.098473650788[/C][C]-1.39847365078754[/C][/ROW]
[ROW][C]29[/C][C]109.9[/C][C]103.071112651663[/C][C]6.82888734833688[/C][/ROW]
[ROW][C]30[/C][C]114.6[/C][C]113.573088597242[/C][C]1.02691140275759[/C][/ROW]
[ROW][C]31[/C][C]85.4[/C][C]85.9278861552376[/C][C]-0.527886155237602[/C][/ROW]
[ROW][C]32[/C][C]100.5[/C][C]98.2372986596877[/C][C]2.26270134031232[/C][/ROW]
[ROW][C]33[/C][C]114.8[/C][C]113.456773503574[/C][C]1.34322649642551[/C][/ROW]
[ROW][C]34[/C][C]116.5[/C][C]113.523484667712[/C][C]2.97651533228777[/C][/ROW]
[ROW][C]35[/C][C]112.9[/C][C]108.474739625328[/C][C]4.42526037467166[/C][/ROW]
[ROW][C]36[/C][C]102[/C][C]101.618558024074[/C][C]0.381441975926336[/C][/ROW]
[ROW][C]37[/C][C]106[/C][C]103.439350165013[/C][C]2.56064983498662[/C][/ROW]
[ROW][C]38[/C][C]105.3[/C][C]103.969479250657[/C][C]1.33052074934331[/C][/ROW]
[ROW][C]39[/C][C]118.8[/C][C]115.075206848775[/C][C]3.72479315122533[/C][/ROW]
[ROW][C]40[/C][C]106.1[/C][C]106.214606132915[/C][C]-0.114606132915115[/C][/ROW]
[ROW][C]41[/C][C]109.3[/C][C]105.744477047272[/C][C]3.55552295272825[/C][/ROW]
[ROW][C]42[/C][C]117.2[/C][C]114.888553617304[/C][C]2.31144638269621[/C][/ROW]
[ROW][C]43[/C][C]92.5[/C][C]88.2617757069594[/C][C]4.23822429304057[/C][/ROW]
[ROW][C]44[/C][C]104.2[/C][C]100.783359988839[/C][C]3.41664001116125[/C][/ROW]
[ROW][C]45[/C][C]112.5[/C][C]114.814672879122[/C][C]-2.31467287912172[/C][/ROW]
[ROW][C]46[/C][C]122.4[/C][C]118.700476036986[/C][C]3.69952396301392[/C][/ROW]
[ROW][C]47[/C][C]113.3[/C][C]109.450729801503[/C][C]3.84927019849707[/C][/ROW]
[ROW][C]48[/C][C]100[/C][C]101.151780113729[/C][C]-1.15178011372930[/C][/ROW]
[ROW][C]49[/C][C]110.7[/C][C]106.112714560622[/C][C]4.587285439378[/C][/ROW]
[ROW][C]50[/C][C]112.8[/C][C]108.552389643129[/C][C]4.24761035687137[/C][/ROW]
[ROW][C]51[/C][C]109.8[/C][C]117.027187201124[/C][C]-7.22718720112383[/C][/ROW]
[ROW][C]52[/C][C]117.3[/C][C]114.362002386199[/C][C]2.93799761380146[/C][/ROW]
[ROW][C]53[/C][C]109.1[/C][C]112.406670858550[/C][C]-3.30667085855040[/C][/ROW]
[ROW][C]54[/C][C]115.9[/C][C]122.229697116356[/C][C]-6.32969711635605[/C][/ROW]
[ROW][C]55[/C][C]96[/C][C]96.5364750267004[/C][C]-0.536475026700412[/C][/ROW]
[ROW][C]56[/C][C]99.8[/C][C]104.857058115480[/C][C]-5.05705811548047[/C][/ROW]
[ROW][C]57[/C][C]116.8[/C][C]118.082118251532[/C][C]-1.28211825153227[/C][/ROW]
[ROW][C]58[/C][C]115.7[/C][C]115.857374219434[/C][C]-0.157374219434048[/C][/ROW]
[ROW][C]59[/C][C]99.4[/C][C]105.716506518748[/C][C]-6.31650651874801[/C][/ROW]
[ROW][C]60[/C][C]94.3[/C][C]97.9267690968046[/C][C]-3.62676909680461[/C][/ROW]
[/TABLE]
Source: https://freestatistics.org/blog/index.php?pk=58429&T=4

Globally Unique Identifier (entire table): ba.freestatistics.org/blog/index.php?pk=58429&T=4

As an alternative you can also use a QR Code:  

The GUIDs for individual cells are displayed in the table below:

Multiple Linear Regression - Actuals, Interpolation, and Residuals
Time or IndexActualsInterpolationForecastResidualsPrediction Error
195.199.3232176828856-4.22321768288557
297101.083943077619-4.08394307761878
3112.7112.6564485860810.0435514139188484
4102.9105.620525156113-2.72052515611318
597.4102.901375229720-5.50137522971972
6111.4110.4753806467750.924619353224741
787.489.0680284611906-1.6680284611906
896.898.2372986596877-1.43729865968767
9114.1115.408753855924-1.30875385592365
10110.3114.669212265830-4.36921226583022
11103.9109.153689313102-5.25368931310196
12101.699.58170896075282.01829103924719
1394.697.6258434634518-3.02584346345177
1495.999.4714375691565-3.57143756915646
15104.7106.842941884520-2.14294188451953
16102.8101.5043926739861.29560732601438
1798.199.676364212795-1.57636421279503
18113.9111.8332800223222.06671997767750
1980.982.405834649912-1.50583464991196
2095.794.88498457630540.815015423694568
21113.2109.6376815098483.56231849015212
22105.9108.049452810037-2.14945281003743
23108.8105.5043347413193.29566525868124
24102.399.92118380463962.37881619536038
259998.89887412802730.101125871972705
26100.798.62275045943942.07724954056056
27115.5109.8982154795015.60178452049918
28100.7102.098473650788-1.39847365078754
29109.9103.0711126516636.82888734833688
30114.6113.5730885972421.02691140275759
3185.485.9278861552376-0.527886155237602
32100.598.23729865968772.26270134031232
33114.8113.4567735035741.34322649642551
34116.5113.5234846677122.97651533228777
35112.9108.4747396253284.42526037467166
36102101.6185580240740.381441975926336
37106103.4393501650132.56064983498662
38105.3103.9694792506571.33052074934331
39118.8115.0752068487753.72479315122533
40106.1106.214606132915-0.114606132915115
41109.3105.7444770472723.55552295272825
42117.2114.8885536173042.31144638269621
4392.588.26177570695944.23822429304057
44104.2100.7833599888393.41664001116125
45112.5114.814672879122-2.31467287912172
46122.4118.7004760369863.69952396301392
47113.3109.4507298015033.84927019849707
48100101.151780113729-1.15178011372930
49110.7106.1127145606224.587285439378
50112.8108.5523896431294.24761035687137
51109.8117.027187201124-7.22718720112383
52117.3114.3620023861992.93799761380146
53109.1112.406670858550-3.30667085855040
54115.9122.229697116356-6.32969711635605
559696.5364750267004-0.536475026700412
5699.8104.857058115480-5.05705811548047
57116.8118.082118251532-1.28211825153227
58115.7115.857374219434-0.157374219434048
5999.4105.716506518748-6.31650651874801
6094.397.9267690968046-3.62676909680461


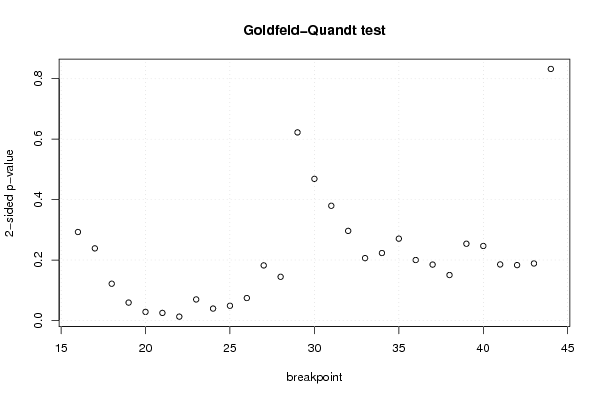
Goldfeld-Quandt test for Heteroskedasticity
p-valuesAlternative Hypothesis
breakpoint indexgreater2-sidedless
160.1463369565914920.2926739131829850.853663043408508
170.1192666332784960.2385332665569920.880733366721504
180.06075430781074210.1215086156214840.939245692189258
190.02953618305967290.05907236611934570.970463816940327
200.01413387933176690.02826775866353380.985866120668233
210.01246804337741520.02493608675483050.987531956622585
220.00627641382674060.01255282765348120.99372358617326
230.03477077563954060.06954155127908110.96522922436046
240.01964980962159410.03929961924318810.980350190378406
250.02430257821252540.04860515642505070.975697421787475
260.03704775492666760.07409550985333520.962952245073332
270.09108022306255460.1821604461251090.908919776937445
280.07223164700107670.1444632940021530.927768352998923
290.3111380899284580.6222761798569170.688861910071542
300.2342837720502700.4685675441005410.76571622794973
310.1897451090904940.3794902181809870.810254890909506
320.1481829096336260.2963658192672520.851817090366374
330.1031051098880410.2062102197760820.89689489011196
340.1115560834751860.2231121669503720.888443916524814
350.1353068281287300.2706136562574610.86469317187127
360.09995335018073730.1999067003614750.900046649819263
370.09241846950014480.1848369390002900.907581530499855
380.07513932997979950.1502786599595990.9248606700202
390.1269128165998850.253825633199770.873087183400115
400.1232338467458310.2464676934916610.87676615325417
410.0926802489858680.1853604979717360.907319751014132
420.091600877312450.18320175462490.90839912268755
430.09427461679221120.1885492335844220.905725383207789
440.5838643168576280.8322713662847430.416135683142372

\begin{tabular}{lllllllll}
\hline
Goldfeld-Quandt test for Heteroskedasticity \tabularnewline
p-values & Alternative Hypothesis \tabularnewline
breakpoint index & greater & 2-sided & less \tabularnewline
16 & 0.146336956591492 & 0.292673913182985 & 0.853663043408508 \tabularnewline
17 & 0.119266633278496 & 0.238533266556992 & 0.880733366721504 \tabularnewline
18 & 0.0607543078107421 & 0.121508615621484 & 0.939245692189258 \tabularnewline
19 & 0.0295361830596729 & 0.0590723661193457 & 0.970463816940327 \tabularnewline
20 & 0.0141338793317669 & 0.0282677586635338 & 0.985866120668233 \tabularnewline
21 & 0.0124680433774152 & 0.0249360867548305 & 0.987531956622585 \tabularnewline
22 & 0.0062764138267406 & 0.0125528276534812 & 0.99372358617326 \tabularnewline
23 & 0.0347707756395406 & 0.0695415512790811 & 0.96522922436046 \tabularnewline
24 & 0.0196498096215941 & 0.0392996192431881 & 0.980350190378406 \tabularnewline
25 & 0.0243025782125254 & 0.0486051564250507 & 0.975697421787475 \tabularnewline
26 & 0.0370477549266676 & 0.0740955098533352 & 0.962952245073332 \tabularnewline
27 & 0.0910802230625546 & 0.182160446125109 & 0.908919776937445 \tabularnewline
28 & 0.0722316470010767 & 0.144463294002153 & 0.927768352998923 \tabularnewline
29 & 0.311138089928458 & 0.622276179856917 & 0.688861910071542 \tabularnewline
30 & 0.234283772050270 & 0.468567544100541 & 0.76571622794973 \tabularnewline
31 & 0.189745109090494 & 0.379490218180987 & 0.810254890909506 \tabularnewline
32 & 0.148182909633626 & 0.296365819267252 & 0.851817090366374 \tabularnewline
33 & 0.103105109888041 & 0.206210219776082 & 0.89689489011196 \tabularnewline
34 & 0.111556083475186 & 0.223112166950372 & 0.888443916524814 \tabularnewline
35 & 0.135306828128730 & 0.270613656257461 & 0.86469317187127 \tabularnewline
36 & 0.0999533501807373 & 0.199906700361475 & 0.900046649819263 \tabularnewline
37 & 0.0924184695001448 & 0.184836939000290 & 0.907581530499855 \tabularnewline
38 & 0.0751393299797995 & 0.150278659959599 & 0.9248606700202 \tabularnewline
39 & 0.126912816599885 & 0.25382563319977 & 0.873087183400115 \tabularnewline
40 & 0.123233846745831 & 0.246467693491661 & 0.87676615325417 \tabularnewline
41 & 0.092680248985868 & 0.185360497971736 & 0.907319751014132 \tabularnewline
42 & 0.09160087731245 & 0.1832017546249 & 0.90839912268755 \tabularnewline
43 & 0.0942746167922112 & 0.188549233584422 & 0.905725383207789 \tabularnewline
44 & 0.583864316857628 & 0.832271366284743 & 0.416135683142372 \tabularnewline
\hline
\end{tabular}
%Source: https://freestatistics.org/blog/index.php?pk=58429&T=5

[TABLE]
[ROW][C]Goldfeld-Quandt test for Heteroskedasticity[/C][/ROW]
[ROW][C]p-values[/C][C]Alternative Hypothesis[/C][/ROW]
[ROW][C]breakpoint index[/C][C]greater[/C][C]2-sided[/C][C]less[/C][/ROW]
[ROW][C]16[/C][C]0.146336956591492[/C][C]0.292673913182985[/C][C]0.853663043408508[/C][/ROW]
[ROW][C]17[/C][C]0.119266633278496[/C][C]0.238533266556992[/C][C]0.880733366721504[/C][/ROW]
[ROW][C]18[/C][C]0.0607543078107421[/C][C]0.121508615621484[/C][C]0.939245692189258[/C][/ROW]
[ROW][C]19[/C][C]0.0295361830596729[/C][C]0.0590723661193457[/C][C]0.970463816940327[/C][/ROW]
[ROW][C]20[/C][C]0.0141338793317669[/C][C]0.0282677586635338[/C][C]0.985866120668233[/C][/ROW]
[ROW][C]21[/C][C]0.0124680433774152[/C][C]0.0249360867548305[/C][C]0.987531956622585[/C][/ROW]
[ROW][C]22[/C][C]0.0062764138267406[/C][C]0.0125528276534812[/C][C]0.99372358617326[/C][/ROW]
[ROW][C]23[/C][C]0.0347707756395406[/C][C]0.0695415512790811[/C][C]0.96522922436046[/C][/ROW]
[ROW][C]24[/C][C]0.0196498096215941[/C][C]0.0392996192431881[/C][C]0.980350190378406[/C][/ROW]
[ROW][C]25[/C][C]0.0243025782125254[/C][C]0.0486051564250507[/C][C]0.975697421787475[/C][/ROW]
[ROW][C]26[/C][C]0.0370477549266676[/C][C]0.0740955098533352[/C][C]0.962952245073332[/C][/ROW]
[ROW][C]27[/C][C]0.0910802230625546[/C][C]0.182160446125109[/C][C]0.908919776937445[/C][/ROW]
[ROW][C]28[/C][C]0.0722316470010767[/C][C]0.144463294002153[/C][C]0.927768352998923[/C][/ROW]
[ROW][C]29[/C][C]0.311138089928458[/C][C]0.622276179856917[/C][C]0.688861910071542[/C][/ROW]
[ROW][C]30[/C][C]0.234283772050270[/C][C]0.468567544100541[/C][C]0.76571622794973[/C][/ROW]
[ROW][C]31[/C][C]0.189745109090494[/C][C]0.379490218180987[/C][C]0.810254890909506[/C][/ROW]
[ROW][C]32[/C][C]0.148182909633626[/C][C]0.296365819267252[/C][C]0.851817090366374[/C][/ROW]
[ROW][C]33[/C][C]0.103105109888041[/C][C]0.206210219776082[/C][C]0.89689489011196[/C][/ROW]
[ROW][C]34[/C][C]0.111556083475186[/C][C]0.223112166950372[/C][C]0.888443916524814[/C][/ROW]
[ROW][C]35[/C][C]0.135306828128730[/C][C]0.270613656257461[/C][C]0.86469317187127[/C][/ROW]
[ROW][C]36[/C][C]0.0999533501807373[/C][C]0.199906700361475[/C][C]0.900046649819263[/C][/ROW]
[ROW][C]37[/C][C]0.0924184695001448[/C][C]0.184836939000290[/C][C]0.907581530499855[/C][/ROW]
[ROW][C]38[/C][C]0.0751393299797995[/C][C]0.150278659959599[/C][C]0.9248606700202[/C][/ROW]
[ROW][C]39[/C][C]0.126912816599885[/C][C]0.25382563319977[/C][C]0.873087183400115[/C][/ROW]
[ROW][C]40[/C][C]0.123233846745831[/C][C]0.246467693491661[/C][C]0.87676615325417[/C][/ROW]
[ROW][C]41[/C][C]0.092680248985868[/C][C]0.185360497971736[/C][C]0.907319751014132[/C][/ROW]
[ROW][C]42[/C][C]0.09160087731245[/C][C]0.1832017546249[/C][C]0.90839912268755[/C][/ROW]
[ROW][C]43[/C][C]0.0942746167922112[/C][C]0.188549233584422[/C][C]0.905725383207789[/C][/ROW]
[ROW][C]44[/C][C]0.583864316857628[/C][C]0.832271366284743[/C][C]0.416135683142372[/C][/ROW]
[/TABLE]
Source: https://freestatistics.org/blog/index.php?pk=58429&T=5

Globally Unique Identifier (entire table): ba.freestatistics.org/blog/index.php?pk=58429&T=5

As an alternative you can also use a QR Code:  

The GUIDs for individual cells are displayed in the table below:

Goldfeld-Quandt test for Heteroskedasticity
p-valuesAlternative Hypothesis
breakpoint indexgreater2-sidedless
160.1463369565914920.2926739131829850.853663043408508
170.1192666332784960.2385332665569920.880733366721504
180.06075430781074210.1215086156214840.939245692189258
190.02953618305967290.05907236611934570.970463816940327
200.01413387933176690.02826775866353380.985866120668233
210.01246804337741520.02493608675483050.987531956622585
220.00627641382674060.01255282765348120.99372358617326
230.03477077563954060.06954155127908110.96522922436046
240.01964980962159410.03929961924318810.980350190378406
250.02430257821252540.04860515642505070.975697421787475
260.03704775492666760.07409550985333520.962952245073332
270.09108022306255460.1821604461251090.908919776937445
280.07223164700107670.1444632940021530.927768352998923
290.3111380899284580.6222761798569170.688861910071542
300.2342837720502700.4685675441005410.76571622794973
310.1897451090904940.3794902181809870.810254890909506
320.1481829096336260.2963658192672520.851817090366374
330.1031051098880410.2062102197760820.89689489011196
340.1115560834751860.2231121669503720.888443916524814
350.1353068281287300.2706136562574610.86469317187127
360.09995335018073730.1999067003614750.900046649819263
370.09241846950014480.1848369390002900.907581530499855
380.07513932997979950.1502786599595990.9248606700202
390.1269128165998850.253825633199770.873087183400115
400.1232338467458310.2464676934916610.87676615325417
410.0926802489858680.1853604979717360.907319751014132
420.091600877312450.18320175462490.90839912268755
430.09427461679221120.1885492335844220.905725383207789
440.5838643168576280.8322713662847430.416135683142372


Meta Analysis of Goldfeld-Quandt test for Heteroskedasticity
Description# significant tests% significant testsOK/NOK
1% type I error level00OK
5% type I error level50.172413793103448NOK
10% type I error level80.275862068965517NOK

\begin{tabular}{lllllllll}
\hline
Meta Analysis of Goldfeld-Quandt test for Heteroskedasticity \tabularnewline
Description & # significant tests & % significant tests & OK/NOK \tabularnewline
1% type I error level & 0 & 0 & OK \tabularnewline
5% type I error level & 5 & 0.172413793103448 & NOK \tabularnewline
10% type I error level & 8 & 0.275862068965517 & NOK \tabularnewline
\hline
\end{tabular}
%Source: https://freestatistics.org/blog/index.php?pk=58429&T=6

[TABLE]
[ROW][C]Meta Analysis of Goldfeld-Quandt test for Heteroskedasticity[/C][/ROW]
[ROW][C]Description[/C][C]# significant tests[/C][C]% significant tests[/C][C]OK/NOK[/C][/ROW]
[ROW][C]1% type I error level[/C][C]0[/C][C]0[/C][C]OK[/C][/ROW]
[ROW][C]5% type I error level[/C][C]5[/C][C]0.172413793103448[/C][C]NOK[/C][/ROW]
[ROW][C]10% type I error level[/C][C]8[/C][C]0.275862068965517[/C][C]NOK[/C][/ROW]
[/TABLE]
Source: https://freestatistics.org/blog/index.php?pk=58429&T=6

Globally Unique Identifier (entire table): ba.freestatistics.org/blog/index.php?pk=58429&T=6

As an alternative you can also use a QR Code:  

The GUIDs for individual cells are displayed in the table below:

Meta Analysis of Goldfeld-Quandt test for Heteroskedasticity
Description# significant tests% significant testsOK/NOK
1% type I error level00OK
5% type I error level50.172413793103448NOK
10% type I error level80.275862068965517NOK


Parameters (Session):
par1 = 1 ; par2 = Include Monthly Dummies ; par3 = No Linear Trend ;
Parameters (R input):
par1 = 1 ; par2 = Include Monthly Dummies ; par3 = No Linear Trend ;
R code (references can be found in the software module):
library(lattice)
library(lmtest)
n25 <- 25 #minimum number of obs. for Goldfeld-Quandt test
par1 <- as.numeric(par1)
x <- t(y)
k <- length(x[1,])
n <- length(x[,1])
x1 <- cbind(x[,par1], x[,1:k!=par1])
mycolnames <- c(colnames(x)[par1], colnames(x)[1:k!=par1])
colnames(x1) <- mycolnames #colnames(x)[par1]
x <- x1
if (par3 == 'First Differences'){
x2 <- array(0, dim=c(n-1,k), dimnames=list(1:(n-1), paste('(1-B)',colnames(x),sep='')))
for (i in 1:n-1) {
for (j in 1:k) {
x2[i,j] <- x[i+1,j] - x[i,j]
}
}
x <- x2
}
if (par2 == 'Include Monthly Dummies'){
x2 <- array(0, dim=c(n,11), dimnames=list(1:n, paste('M', seq(1:11), sep ='')))
for (i in 1:11){
x2[seq(i,n,12),i] <- 1
}
x <- cbind(x, x2)
}
if (par2 == 'Include Quarterly Dummies'){
x2 <- array(0, dim=c(n,3), dimnames=list(1:n, paste('Q', seq(1:3), sep ='')))
for (i in 1:3){
x2[seq(i,n,4),i] <- 1
}
x <- cbind(x, x2)
}
k <- length(x[1,])
if (par3 == 'Linear Trend'){
x <- cbind(x, c(1:n))
colnames(x)[k+1] <- 't'
}
x
k <- length(x[1,])
df <- as.data.frame(x)
(mylm <- lm(df))
(mysum <- summary(mylm))
if (n > n25) {
kp3 <- k + 3
nmkm3 <- n - k - 3
gqarr <- array(NA, dim=c(nmkm3-kp3+1,3))
numgqtests <- 0
numsignificant1 <- 0
numsignificant5 <- 0
numsignificant10 <- 0
for (mypoint in kp3:nmkm3) {
j <- 0
numgqtests <- numgqtests + 1
for (myalt in c('greater', 'two.sided', 'less')) {
j <- j + 1
gqarr[mypoint-kp3+1,j] <- gqtest(mylm, point=mypoint, alternative=myalt)$p.value
}
if (gqarr[mypoint-kp3+1,2] < 0.01) numsignificant1 <- numsignificant1 + 1
if (gqarr[mypoint-kp3+1,2] < 0.05) numsignificant5 <- numsignificant5 + 1
if (gqarr[mypoint-kp3+1,2] < 0.10) numsignificant10 <- numsignificant10 + 1
}
gqarr
}
bitmap(file='test0.png')
plot(x[,1], type='l', main='Actuals and Interpolation', ylab='value of Actuals and Interpolation (dots)', xlab='time or index')
points(x[,1]-mysum$resid)
grid()
dev.off()
bitmap(file='test1.png')
plot(mysum$resid, type='b', pch=19, main='Residuals', ylab='value of Residuals', xlab='time or index')
grid()
dev.off()
bitmap(file='test2.png')
hist(mysum$resid, main='Residual Histogram', xlab='values of Residuals')
grid()
dev.off()
bitmap(file='test3.png')
densityplot(~mysum$resid,col='black',main='Residual Density Plot', xlab='values of Residuals')
dev.off()
bitmap(file='test4.png')
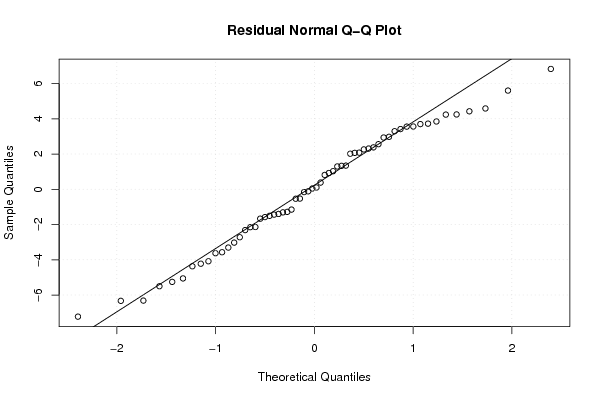
qqnorm(mysum$resid, main='Residual Normal Q-Q Plot')
qqline(mysum$resid)
grid()
dev.off()
(myerror <- as.ts(mysum$resid))
bitmap(file='test5.png')
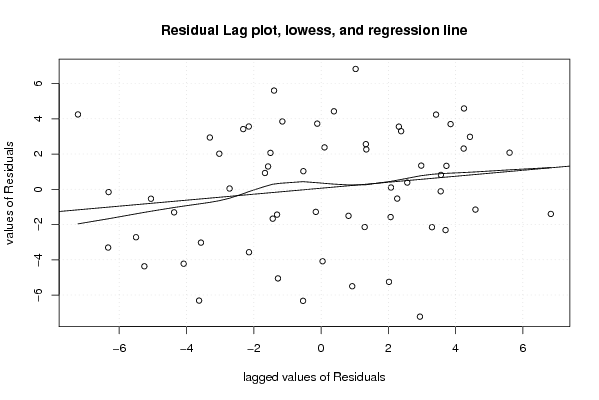
dum <- cbind(lag(myerror,k=1),myerror)
dum
dum1 <- dum[2:length(myerror),]
dum1
z <- as.data.frame(dum1)
z
plot(z,main=paste('Residual Lag plot, lowess, and regression line'), ylab='values of Residuals', xlab='lagged values of Residuals')
lines(lowess(z))
abline(lm(z))
grid()
dev.off()
bitmap(file='test6.png')
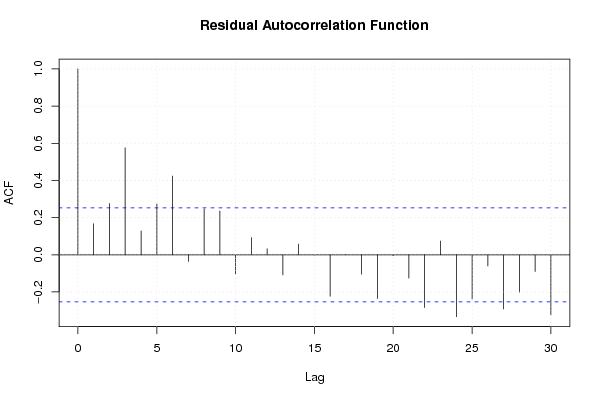
acf(mysum$resid, lag.max=length(mysum$resid)/2, main='Residual Autocorrelation Function')
grid()
dev.off()
bitmap(file='test7.png')
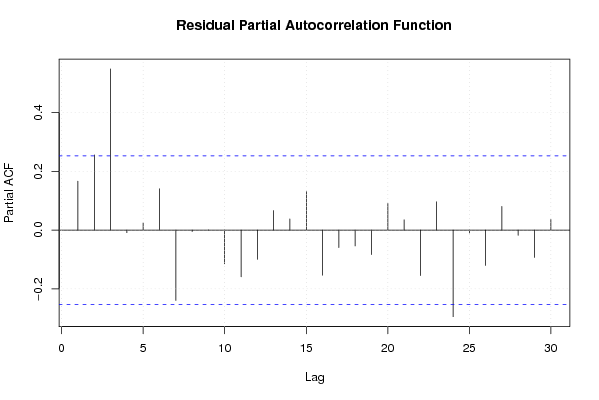
pacf(mysum$resid, lag.max=length(mysum$resid)/2, main='Residual Partial Autocorrelation Function')
grid()
dev.off()
bitmap(file='test8.png')
opar <- par(mfrow = c(2,2), oma = c(0, 0, 1.1, 0))
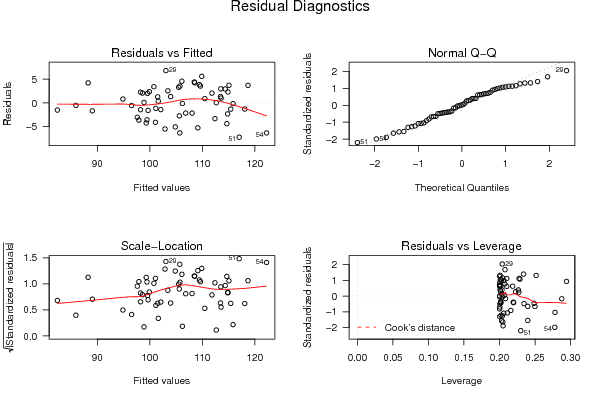
plot(mylm, las = 1, sub='Residual Diagnostics')
par(opar)
dev.off()
if (n > n25) {
bitmap(file='test9.png')
plot(kp3:nmkm3,gqarr[,2], main='Goldfeld-Quandt test',ylab='2-sided p-value',xlab='breakpoint')
grid()
dev.off()
}
load(file='createtable')
a<-table.start()
a<-table.row.start(a)
a<-table.element(a, 'Multiple Linear Regression - Estimated Regression Equation', 1, TRUE)
a<-table.row.end(a)
myeq <- colnames(x)[1]
myeq <- paste(myeq, '[t] = ', sep='')
for (i in 1:k){
if (mysum$coefficients[i,1] > 0) myeq <- paste(myeq, '+', '')
myeq <- paste(myeq, mysum$coefficients[i,1], sep=' ')
if (rownames(mysum$coefficients)[i] != '(Intercept)') {
myeq <- paste(myeq, rownames(mysum$coefficients)[i], sep='')
if (rownames(mysum$coefficients)[i] != 't') myeq <- paste(myeq, '[t]', sep='')
}
}
myeq <- paste(myeq, ' + e[t]')
a<-table.row.start(a)
a<-table.element(a, myeq)
a<-table.row.end(a)
a<-table.end(a)
table.save(a,file='mytable1.tab')
a<-table.start()
a<-table.row.start(a)
a<-table.element(a,hyperlink('ols1.htm','Multiple Linear Regression - Ordinary Least Squares',''), 6, TRUE)
a<-table.row.end(a)
a<-table.row.start(a)
a<-table.element(a,'Variable',header=TRUE)
a<-table.element(a,'Parameter',header=TRUE)
a<-table.element(a,'S.D.',header=TRUE)
a<-table.element(a,'T-STAT
H0: parameter = 0',header=TRUE)
a<-table.element(a,'2-tail p-value',header=TRUE)
a<-table.element(a,'1-tail p-value',header=TRUE)
a<-table.row.end(a)
for (i in 1:k){
a<-table.row.start(a)
a<-table.element(a,rownames(mysum$coefficients)[i],header=TRUE)
a<-table.element(a,mysum$coefficients[i,1])
a<-table.element(a, round(mysum$coefficients[i,2],6))
a<-table.element(a, round(mysum$coefficients[i,3],4))
a<-table.element(a, round(mysum$coefficients[i,4],6))
a<-table.element(a, round(mysum$coefficients[i,4]/2,6))
a<-table.row.end(a)
}
a<-table.end(a)
table.save(a,file='mytable2.tab')
a<-table.start()
a<-table.row.start(a)
a<-table.element(a, 'Multiple Linear Regression - Regression Statistics', 2, TRUE)
a<-table.row.end(a)
a<-table.row.start(a)
a<-table.element(a, 'Multiple R',1,TRUE)
a<-table.element(a, sqrt(mysum$r.squared))
a<-table.row.end(a)
a<-table.row.start(a)
a<-table.element(a, 'R-squared',1,TRUE)
a<-table.element(a, mysum$r.squared)
a<-table.row.end(a)
a<-table.row.start(a)
a<-table.element(a, 'Adjusted R-squared',1,TRUE)
a<-table.element(a, mysum$adj.r.squared)
a<-table.row.end(a)
a<-table.row.start(a)
a<-table.element(a, 'F-TEST (value)',1,TRUE)
a<-table.element(a, mysum$fstatistic[1])
a<-table.row.end(a)
a<-table.row.start(a)
a<-table.element(a, 'F-TEST (DF numerator)',1,TRUE)
a<-table.element(a, mysum$fstatistic[2])
a<-table.row.end(a)
a<-table.row.start(a)
a<-table.element(a, 'F-TEST (DF denominator)',1,TRUE)
a<-table.element(a, mysum$fstatistic[3])
a<-table.row.end(a)
a<-table.row.start(a)
a<-table.element(a, 'p-value',1,TRUE)
a<-table.element(a, 1-pf(mysum$fstatistic[1],mysum$fstatistic[2],mysum$fstatistic[3]))
a<-table.row.end(a)
a<-table.row.start(a)
a<-table.element(a, 'Multiple Linear Regression - Residual Statistics', 2, TRUE)
a<-table.row.end(a)
a<-table.row.start(a)
a<-table.element(a, 'Residual Standard Deviation',1,TRUE)
a<-table.element(a, mysum$sigma)
a<-table.row.end(a)
a<-table.row.start(a)
a<-table.element(a, 'Sum Squared Residuals',1,TRUE)
a<-table.element(a, sum(myerror*myerror))
a<-table.row.end(a)
a<-table.end(a)
table.save(a,file='mytable3.tab')
a<-table.start()
a<-table.row.start(a)
a<-table.element(a, 'Multiple Linear Regression - Actuals, Interpolation, and Residuals', 4, TRUE)
a<-table.row.end(a)
a<-table.row.start(a)
a<-table.element(a, 'Time or Index', 1, TRUE)
a<-table.element(a, 'Actuals', 1, TRUE)
a<-table.element(a, 'Interpolation
Forecast', 1, TRUE)
a<-table.element(a, 'Residuals
Prediction Error', 1, TRUE)
a<-table.row.end(a)
for (i in 1:n) {
a<-table.row.start(a)
a<-table.element(a,i, 1, TRUE)
a<-table.element(a,x[i])
a<-table.element(a,x[i]-mysum$resid[i])
a<-table.element(a,mysum$resid[i])
a<-table.row.end(a)
}
a<-table.end(a)
table.save(a,file='mytable4.tab')
if (n > n25) {
a<-table.start()
a<-table.row.start(a)
a<-table.element(a,'Goldfeld-Quandt test for Heteroskedasticity',4,TRUE)
a<-table.row.end(a)
a<-table.row.start(a)
a<-table.element(a,'p-values',header=TRUE)
a<-table.element(a,'Alternative Hypothesis',3,header=TRUE)
a<-table.row.end(a)
a<-table.row.start(a)
a<-table.element(a,'breakpoint index',header=TRUE)
a<-table.element(a,'greater',header=TRUE)
a<-table.element(a,'2-sided',header=TRUE)
a<-table.element(a,'less',header=TRUE)
a<-table.row.end(a)
for (mypoint in kp3:nmkm3) {
a<-table.row.start(a)
a<-table.element(a,mypoint,header=TRUE)
a<-table.element(a,gqarr[mypoint-kp3+1,1])
a<-table.element(a,gqarr[mypoint-kp3+1,2])
a<-table.element(a,gqarr[mypoint-kp3+1,3])
a<-table.row.end(a)
}
a<-table.end(a)
table.save(a,file='mytable5.tab')
a<-table.start()
a<-table.row.start(a)
a<-table.element(a,'Meta Analysis of Goldfeld-Quandt test for Heteroskedasticity',4,TRUE)
a<-table.row.end(a)
a<-table.row.start(a)
a<-table.element(a,'Description',header=TRUE)
a<-table.element(a,'# significant tests',header=TRUE)
a<-table.element(a,'% significant tests',header=TRUE)
a<-table.element(a,'OK/NOK',header=TRUE)
a<-table.row.end(a)
a<-table.row.start(a)
a<-table.element(a,'1% type I error level',header=TRUE)
a<-table.element(a,numsignificant1)
a<-table.element(a,numsignificant1/numgqtests)
if (numsignificant1/numgqtests < 0.01) dum <- 'OK' else dum <- 'NOK'
a<-table.element(a,dum)
a<-table.row.end(a)
a<-table.row.start(a)
a<-table.element(a,'5% type I error level',header=TRUE)
a<-table.element(a,numsignificant5)
a<-table.element(a,numsignificant5/numgqtests)
if (numsignificant5/numgqtests < 0.05) dum <- 'OK' else dum <- 'NOK'
a<-table.element(a,dum)
a<-table.row.end(a)
a<-table.row.start(a)
a<-table.element(a,'10% type I error level',header=TRUE)
a<-table.element(a,numsignificant10)
a<-table.element(a,numsignificant10/numgqtests)
if (numsignificant10/numgqtests < 0.1) dum <- 'OK' else dum <- 'NOK'
a<-table.element(a,dum)
a<-table.row.end(a)
a<-table.end(a)
table.save(a,file='mytable6.tab')
}