| Multiple Linear Regression - Estimated Regression Equation |
| TIA[t] = + 61.8575669338312 + 0.424343554858512IAidM[t] -2.33777469667370M1[t] -0.577049301940704M2[t] + 5.13951514947417M3[t] + 0.904259181572388M4[t] + 0.561433162386583M5[t] + 7.66866066909776M6[t] -10.6409835660198M7[t] -0.580591902319806M8[t] + 6.66122411022697M9[t] + 5.794379453676M10[t] + 3.07952396301393M11[t] + e[t] |
| Multiple Linear Regression - Ordinary Least Squares | |||||
| Variable | Parameter | S.D. | T-STAT H0: parameter = 0 | 2-tail p-value | 1-tail p-value |
| (Intercept) | 61.8575669338312 | 5.490523 | 11.2662 | 0 | 0 |
| IAidM | 0.424343554858512 | 0.058109 | 7.3026 | 0 | 0 |
| M1 | -2.33777469667370 | 2.414311 | -0.9683 | 0.337852 | 0.168926 |
| M2 | -0.577049301940704 | 2.402117 | -0.2402 | 0.8112 | 0.4056 |
| M3 | 5.13951514947417 | 2.562361 | 2.0058 | 0.050656 | 0.025328 |
| M4 | 0.904259181572388 | 2.467124 | 0.3665 | 0.715619 | 0.35781 |
| M5 | 0.561433162386583 | 2.437055 | 0.2304 | 0.818801 | 0.409401 |
| M6 | 7.66866066909776 | 2.550586 | 3.0066 | 0.004231 | 0.002116 |
| M7 | -10.6409835660198 | 2.373224 | -4.4838 | 4.7e-05 | 2.4e-05 |
| M8 | -0.580591902319806 | 2.369602 | -0.245 | 0.80751 | 0.403755 |
| M9 | 6.66122411022697 | 2.586893 | 2.575 | 0.013232 | 0.006616 |
| M10 | 5.794379453676 | 2.629592 | 2.2035 | 0.032493 | 0.016247 |
| M11 | 3.07952396301393 | 2.449803 | 1.257 | 0.214947 | 0.107473 |
| Multiple Linear Regression - Regression Statistics | |
| Multiple R | 0.928405747616052 |
| R-squared | 0.86193723220652 |
| Adjusted R-squared | 0.826687163833717 |
| F-TEST (value) | 24.4520726340359 |
| F-TEST (DF numerator) | 12 |
| F-TEST (DF denominator) | 47 |
| p-value | 3.33066907387547e-16 |
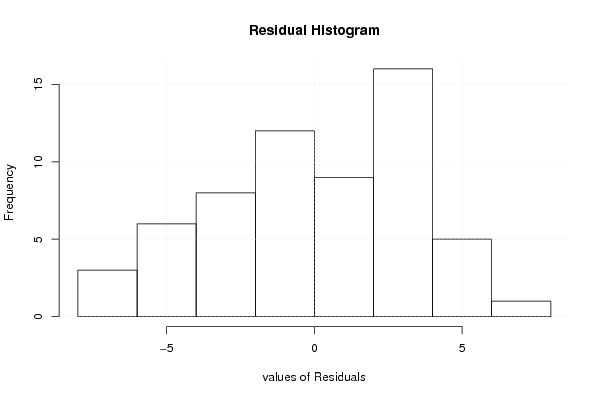
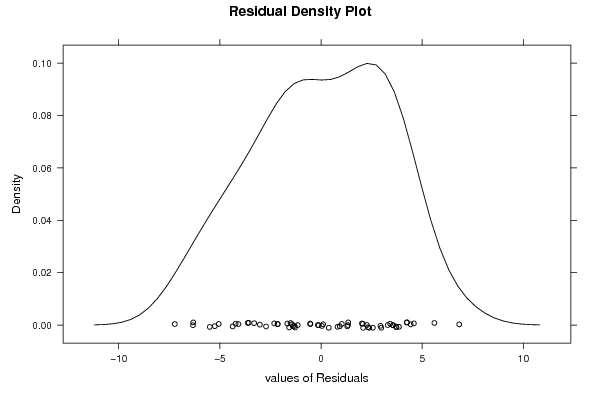
| Multiple Linear Regression - Residual Statistics | |
| Residual Standard Deviation | 3.74664781678294 |
| Sum Squared Residuals | 659.756383561207 |
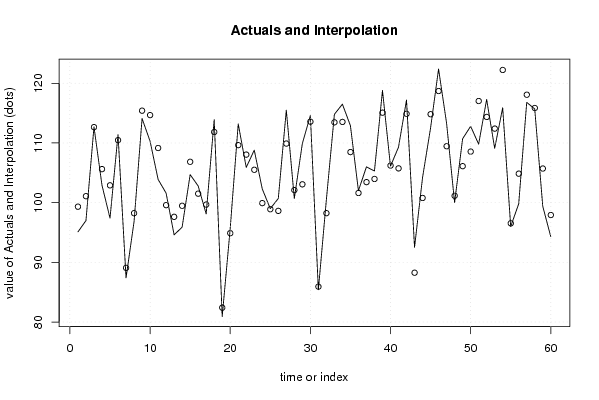
| Multiple Linear Regression - Actuals, Interpolation, and Residuals | |||
| Time or Index | Actuals | Interpolation Forecast | Residuals Prediction Error |
| 1 | 95.1 | 99.3232176828856 | -4.22321768288557 |
| 2 | 97 | 101.083943077619 | -4.08394307761878 |
| 3 | 112.7 | 112.656448586081 | 0.0435514139188484 |
| 4 | 102.9 | 105.620525156113 | -2.72052515611318 |
| 5 | 97.4 | 102.901375229720 | -5.50137522971972 |
| 6 | 111.4 | 110.475380646775 | 0.924619353224741 |
| 7 | 87.4 | 89.0680284611906 | -1.6680284611906 |
| 8 | 96.8 | 98.2372986596877 | -1.43729865968767 |
| 9 | 114.1 | 115.408753855924 | -1.30875385592365 |
| 10 | 110.3 | 114.669212265830 | -4.36921226583022 |
| 11 | 103.9 | 109.153689313102 | -5.25368931310196 |
| 12 | 101.6 | 99.5817089607528 | 2.01829103924719 |
| 13 | 94.6 | 97.6258434634518 | -3.02584346345177 |
| 14 | 95.9 | 99.4714375691565 | -3.57143756915646 |
| 15 | 104.7 | 106.842941884520 | -2.14294188451953 |
| 16 | 102.8 | 101.504392673986 | 1.29560732601438 |
| 17 | 98.1 | 99.676364212795 | -1.57636421279503 |
| 18 | 113.9 | 111.833280022322 | 2.06671997767750 |
| 19 | 80.9 | 82.405834649912 | -1.50583464991196 |
| 20 | 95.7 | 94.8849845763054 | 0.815015423694568 |
| 21 | 113.2 | 109.637681509848 | 3.56231849015212 |
| 22 | 105.9 | 108.049452810037 | -2.14945281003743 |
| 23 | 108.8 | 105.504334741319 | 3.29566525868124 |
| 24 | 102.3 | 99.9211838046396 | 2.37881619536038 |
| 25 | 99 | 98.8988741280273 | 0.101125871972705 |
| 26 | 100.7 | 98.6227504594394 | 2.07724954056056 |
| 27 | 115.5 | 109.898215479501 | 5.60178452049918 |
| 28 | 100.7 | 102.098473650788 | -1.39847365078754 |
| 29 | 109.9 | 103.071112651663 | 6.82888734833688 |
| 30 | 114.6 | 113.573088597242 | 1.02691140275759 |
| 31 | 85.4 | 85.9278861552376 | -0.527886155237602 |
| 32 | 100.5 | 98.2372986596877 | 2.26270134031232 |
| 33 | 114.8 | 113.456773503574 | 1.34322649642551 |
| 34 | 116.5 | 113.523484667712 | 2.97651533228777 |
| 35 | 112.9 | 108.474739625328 | 4.42526037467166 |
| 36 | 102 | 101.618558024074 | 0.381441975926336 |
| 37 | 106 | 103.439350165013 | 2.56064983498662 |
| 38 | 105.3 | 103.969479250657 | 1.33052074934331 |
| 39 | 118.8 | 115.075206848775 | 3.72479315122533 |
| 40 | 106.1 | 106.214606132915 | -0.114606132915115 |
| 41 | 109.3 | 105.744477047272 | 3.55552295272825 |
| 42 | 117.2 | 114.888553617304 | 2.31144638269621 |
| 43 | 92.5 | 88.2617757069594 | 4.23822429304057 |
| 44 | 104.2 | 100.783359988839 | 3.41664001116125 |
| 45 | 112.5 | 114.814672879122 | -2.31467287912172 |
| 46 | 122.4 | 118.700476036986 | 3.69952396301392 |
| 47 | 113.3 | 109.450729801503 | 3.84927019849707 |
| 48 | 100 | 101.151780113729 | -1.15178011372930 |
| 49 | 110.7 | 106.112714560622 | 4.587285439378 |
| 50 | 112.8 | 108.552389643129 | 4.24761035687137 |
| 51 | 109.8 | 117.027187201124 | -7.22718720112383 |
| 52 | 117.3 | 114.362002386199 | 2.93799761380146 |
| 53 | 109.1 | 112.406670858550 | -3.30667085855040 |
| 54 | 115.9 | 122.229697116356 | -6.32969711635605 |
| 55 | 96 | 96.5364750267004 | -0.536475026700412 |
| 56 | 99.8 | 104.857058115480 | -5.05705811548047 |
| 57 | 116.8 | 118.082118251532 | -1.28211825153227 |
| 58 | 115.7 | 115.857374219434 | -0.157374219434048 |
| 59 | 99.4 | 105.716506518748 | -6.31650651874801 |
| 60 | 94.3 | 97.9267690968046 | -3.62676909680461 |
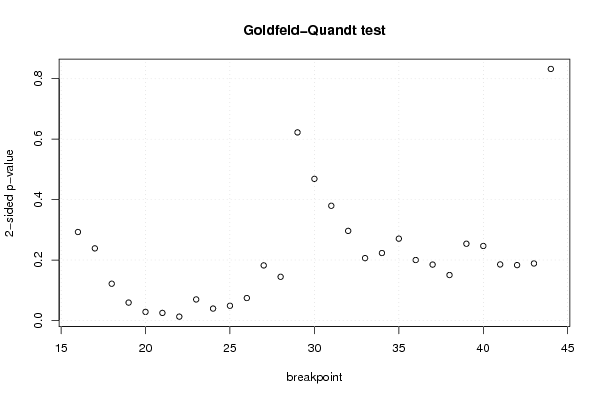
| Goldfeld-Quandt test for Heteroskedasticity | |||
| p-values | Alternative Hypothesis | ||
| breakpoint index | greater | 2-sided | less |
| 16 | 0.146336956591492 | 0.292673913182985 | 0.853663043408508 |
| 17 | 0.119266633278496 | 0.238533266556992 | 0.880733366721504 |
| 18 | 0.0607543078107421 | 0.121508615621484 | 0.939245692189258 |
| 19 | 0.0295361830596729 | 0.0590723661193457 | 0.970463816940327 |
| 20 | 0.0141338793317669 | 0.0282677586635338 | 0.985866120668233 |
| 21 | 0.0124680433774152 | 0.0249360867548305 | 0.987531956622585 |
| 22 | 0.0062764138267406 | 0.0125528276534812 | 0.99372358617326 |
| 23 | 0.0347707756395406 | 0.0695415512790811 | 0.96522922436046 |
| 24 | 0.0196498096215941 | 0.0392996192431881 | 0.980350190378406 |
| 25 | 0.0243025782125254 | 0.0486051564250507 | 0.975697421787475 |
| 26 | 0.0370477549266676 | 0.0740955098533352 | 0.962952245073332 |
| 27 | 0.0910802230625546 | 0.182160446125109 | 0.908919776937445 |
| 28 | 0.0722316470010767 | 0.144463294002153 | 0.927768352998923 |
| 29 | 0.311138089928458 | 0.622276179856917 | 0.688861910071542 |
| 30 | 0.234283772050270 | 0.468567544100541 | 0.76571622794973 |
| 31 | 0.189745109090494 | 0.379490218180987 | 0.810254890909506 |
| 32 | 0.148182909633626 | 0.296365819267252 | 0.851817090366374 |
| 33 | 0.103105109888041 | 0.206210219776082 | 0.89689489011196 |
| 34 | 0.111556083475186 | 0.223112166950372 | 0.888443916524814 |
| 35 | 0.135306828128730 | 0.270613656257461 | 0.86469317187127 |
| 36 | 0.0999533501807373 | 0.199906700361475 | 0.900046649819263 |
| 37 | 0.0924184695001448 | 0.184836939000290 | 0.907581530499855 |
| 38 | 0.0751393299797995 | 0.150278659959599 | 0.9248606700202 |
| 39 | 0.126912816599885 | 0.25382563319977 | 0.873087183400115 |
| 40 | 0.123233846745831 | 0.246467693491661 | 0.87676615325417 |
| 41 | 0.092680248985868 | 0.185360497971736 | 0.907319751014132 |
| 42 | 0.09160087731245 | 0.1832017546249 | 0.90839912268755 |
| 43 | 0.0942746167922112 | 0.188549233584422 | 0.905725383207789 |
| 44 | 0.583864316857628 | 0.832271366284743 | 0.416135683142372 |
| Meta Analysis of Goldfeld-Quandt test for Heteroskedasticity | |||
| Description | # significant tests | % significant tests | OK/NOK |
| 1% type I error level | 0 | 0 | OK |
| 5% type I error level | 5 | 0.172413793103448 | NOK |
| 10% type I error level | 8 | 0.275862068965517 | NOK |