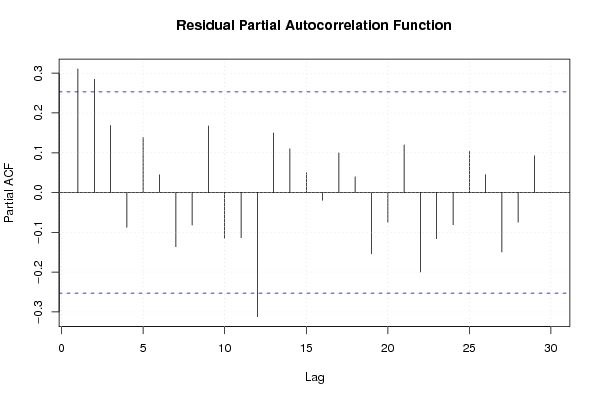
| Multiple Linear Regression - Estimated Regression Equation |
| Y[t] = + 252.997616013072 -17.3371732026144X[t] + 12.3202303921566M1[t] -2.30092156862746M2[t] + 5.73164379084967M3[t] + 36.4988480392157M4[t] + 0.193256535947739M5[t] -11.2332565359477M6[t] + 11.2462826797386M7[t] + 5.85884803921567M8[t] + 13.2911830065359M9[t] + 77.7374656862745M10[t] + 0.846513071895421M11[t] + e[t] |
| Multiple Linear Regression - Ordinary Least Squares | |||||
| Variable | Parameter | S.D. | T-STAT H0: parameter = 0 | 2-tail p-value | 1-tail p-value |
| (Intercept) | 252.997616013072 | 27.860625 | 9.0808 | 0 | 0 |
| X | -17.3371732026144 | 3.333326 | -5.2012 | 4e-06 | 2e-06 |
| M1 | 12.3202303921566 | 10.432619 | 1.1809 | 0.243571 | 0.121785 |
| M2 | -2.30092156862746 | 10.461335 | -0.2199 | 0.826866 | 0.413433 |
| M3 | 5.73164379084967 | 10.533311 | 0.5441 | 0.588914 | 0.294457 |
| M4 | 36.4988480392157 | 10.478527 | 3.4832 | 0.001082 | 0.000541 |
| M5 | 0.193256535947739 | 10.430914 | 0.0185 | 0.985297 | 0.492648 |
| M6 | -11.2332565359477 | 10.430914 | -1.0769 | 0.287013 | 0.143506 |
| M7 | 11.2462826797386 | 10.436026 | 1.0776 | 0.286694 | 0.143347 |
| M8 | 5.85884803921567 | 10.478527 | 0.5591 | 0.578728 | 0.289364 |
| M9 | 13.2911830065359 | 10.596413 | 1.2543 | 0.215932 | 0.107966 |
| M10 | 77.7374656862745 | 10.660183 | 7.2923 | 0 | 0 |
| M11 | 0.846513071895421 | 10.431554 | 0.0811 | 0.935668 | 0.467834 |
| Multiple Linear Regression - Regression Statistics | |
| Multiple R | 0.885262235683724 |
| R-squared | 0.783689225927746 |
| Adjusted R-squared | 0.728460943185894 |
| F-TEST (value) | 14.18999807745 |
| F-TEST (DF numerator) | 12 |
| F-TEST (DF denominator) | 47 |
| p-value | 8.0138118363493e-12 |
| Multiple Linear Regression - Residual Statistics | |
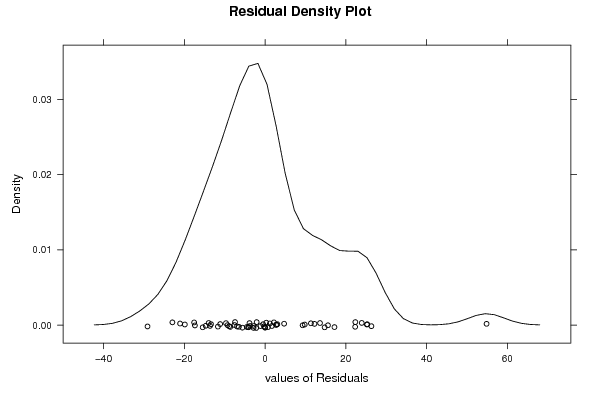
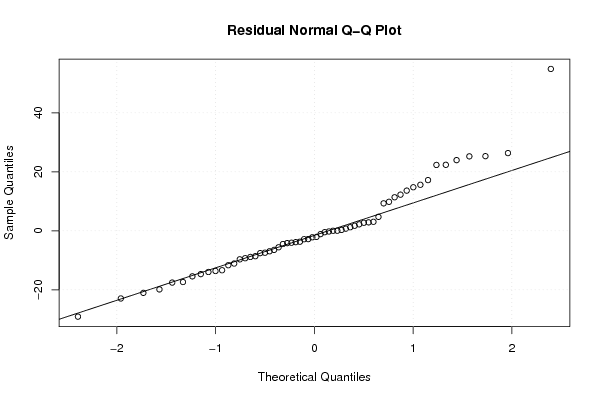
| Residual Standard Deviation | 16.4923870073344 |
| Sum Squared Residuals | 12783.9449723856 |
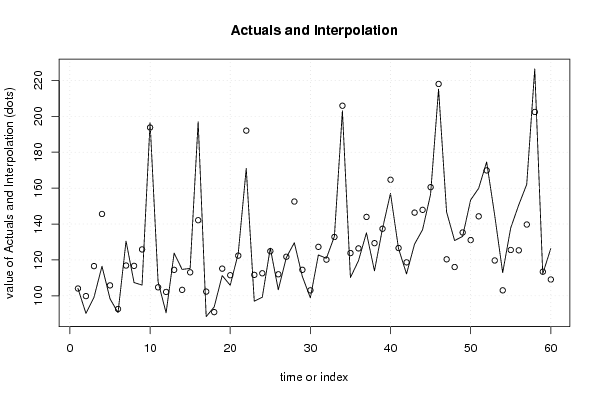
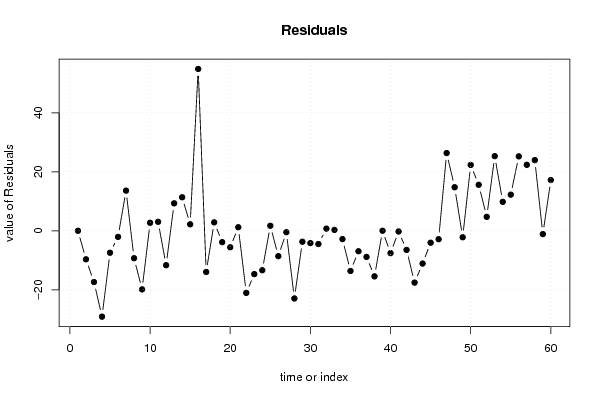
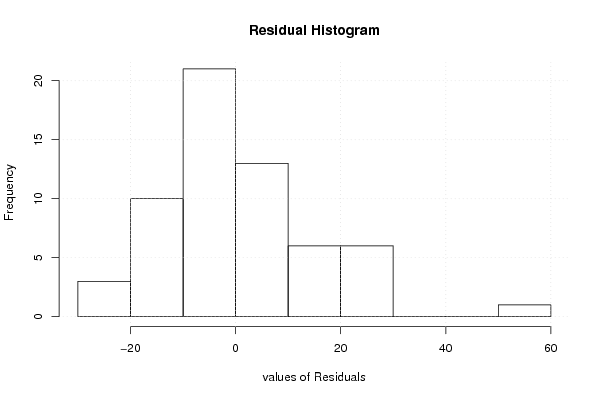
| Multiple Linear Regression - Actuals, Interpolation, and Residuals | |||
| Time or Index | Actuals | Interpolation Forecast | Residuals Prediction Error |
| 1 | 104.1 | 104.082135620916 | 0.0178643790841724 |
| 2 | 90.2 | 99.8632875816993 | -9.6632875816993 |
| 3 | 99.2 | 116.564439542484 | -17.3644395424836 |
| 4 | 116.5 | 145.597926470588 | -29.0979264705882 |
| 5 | 98.4 | 105.824900326797 | -7.42490032679736 |
| 6 | 90.6 | 92.6646699346405 | -2.06466993464051 |
| 7 | 130.5 | 116.877926470588 | 13.6220735294117 |
| 8 | 107.4 | 116.691643790850 | -9.29164379084967 |
| 9 | 106 | 125.857696078431 | -19.8576960784313 |
| 10 | 196.5 | 193.771413398693 | 2.72858660130724 |
| 11 | 107.8 | 104.744439542484 | 3.05556045751636 |
| 12 | 90.5 | 102.164209150327 | -11.6642091503267 |
| 13 | 123.8 | 114.484439542483 | 9.31556045751657 |
| 14 | 114.7 | 103.330722222222 | 11.3692777777778 |
| 15 | 115.3 | 113.097004901961 | 2.20299509803925 |
| 16 | 197 | 142.130491830065 | 54.8695081699347 |
| 17 | 88.4 | 102.357465686274 | -13.9574656862745 |
| 18 | 93.8 | 90.930952614379 | 2.86904738562093 |
| 19 | 111.3 | 115.144209150327 | -3.84420915032678 |
| 20 | 105.9 | 111.490491830065 | -5.59049183006532 |
| 21 | 123.6 | 122.390261437908 | 1.20973856209155 |
| 22 | 171 | 192.037696078431 | -21.0376960784314 |
| 23 | 97 | 111.679308823529 | -14.6793088235294 |
| 24 | 99.2 | 112.566513071895 | -13.3665130718954 |
| 25 | 126.6 | 124.886743464052 | 1.71325653594792 |
| 26 | 103.4 | 111.999308823529 | -8.59930882352942 |
| 27 | 121.3 | 121.765591503268 | -0.465591503267971 |
| 28 | 129.6 | 152.532795751634 | -22.932795751634 |
| 29 | 110.8 | 114.493486928105 | -3.69348692810458 |
| 30 | 98.9 | 103.066973856209 | -4.16697385620915 |
| 31 | 122.8 | 127.280230392157 | -4.48023039215686 |
| 32 | 120.9 | 120.159078431373 | 0.740921568627468 |
| 33 | 133.1 | 132.792565359477 | 0.307434640522879 |
| 34 | 203.1 | 205.907434640523 | -2.80743464052288 |
| 35 | 110.2 | 123.815330065359 | -13.6153300653595 |
| 36 | 119.5 | 126.436251633987 | -6.93625163398695 |
| 37 | 135.1 | 143.957633986928 | -8.85763398692795 |
| 38 | 113.9 | 129.336482026144 | -15.4364820261438 |
| 39 | 137.4 | 137.369047385621 | 0.0309526143790445 |
| 40 | 157.1 | 164.668816993464 | -7.5688169934641 |
| 41 | 126.4 | 126.629508169935 | -0.229508169934665 |
| 42 | 112.2 | 118.670429738562 | -6.47042973856214 |
| 43 | 128.8 | 146.351120915033 | -17.5511209150327 |
| 44 | 136.8 | 147.898555555556 | -11.0985555555556 |
| 45 | 156.5 | 160.532042483660 | -4.03204248366019 |
| 46 | 215.2 | 218.043455882353 | -2.843455882353 |
| 47 | 146.7 | 120.347895424837 | 26.3521045751634 |
| 48 | 130.8 | 116.033947712418 | 14.7660522875817 |
| 49 | 133.1 | 135.289047385621 | -2.18904738562073 |
| 50 | 153.4 | 131.070199346405 | 22.3298006535947 |
| 51 | 159.9 | 144.303916666667 | 15.5960833333333 |
| 52 | 174.6 | 169.869968954248 | 4.73003104575157 |
| 53 | 145 | 119.694638888889 | 25.3053611111111 |
| 54 | 112.9 | 103.066973856209 | 9.83302614379085 |
| 55 | 137.8 | 125.546513071895 | 12.2534869281046 |
| 56 | 150.6 | 125.360230392157 | 25.2397696078431 |
| 57 | 162.1 | 139.727434640523 | 22.3725653594771 |
| 58 | 226.4 | 202.44 | 23.96 |
| 59 | 112.3 | 113.413026143791 | -1.11302614379084 |
| 60 | 126.3 | 109.099078431373 | 17.2009215686275 |
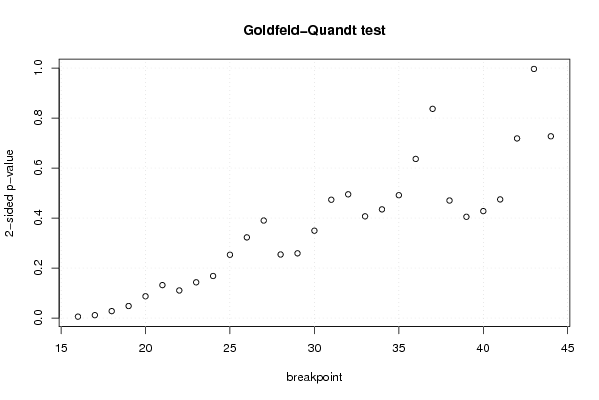
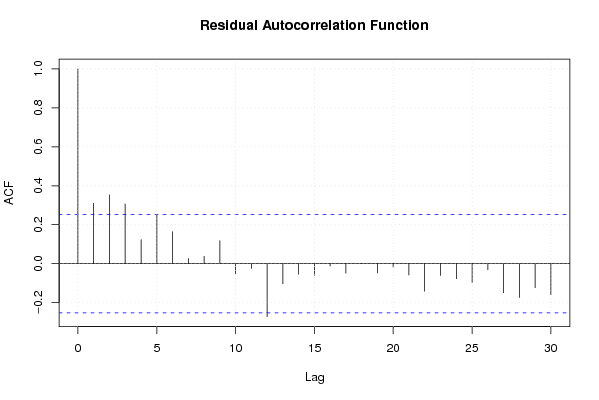
| Goldfeld-Quandt test for Heteroskedasticity | |||
| p-values | Alternative Hypothesis | ||
| breakpoint index | greater | 2-sided | less |
| 16 | 0.997111299902697 | 0.00577740019460591 | 0.00288870009730295 |
| 17 | 0.994138767030392 | 0.0117224659392167 | 0.00586123296960834 |
| 18 | 0.986034733680414 | 0.0279305326391714 | 0.0139652663195857 |
| 19 | 0.975875913536722 | 0.048248172926556 | 0.024124086463278 |
| 20 | 0.9563364532605 | 0.0873270934790017 | 0.0436635467395008 |
| 21 | 0.934048788846949 | 0.131902422306102 | 0.065951211153051 |
| 22 | 0.94473687179816 | 0.110526256403680 | 0.0552631282018399 |
| 23 | 0.928426604208134 | 0.143146791583732 | 0.0715733957918659 |
| 24 | 0.915804004861958 | 0.168391990276083 | 0.0841959951380417 |
| 25 | 0.873332777454705 | 0.25333444509059 | 0.126667222545295 |
| 26 | 0.838577843076429 | 0.322844313847143 | 0.161422156923571 |
| 27 | 0.804882689970042 | 0.390234620059916 | 0.195117310029958 |
| 28 | 0.872784835203834 | 0.254430329592332 | 0.127215164796166 |
| 29 | 0.870452516000265 | 0.259094967999471 | 0.129547483999735 |
| 30 | 0.825205572330224 | 0.349588855339551 | 0.174794427669776 |
| 31 | 0.763280101571442 | 0.473439796857115 | 0.236719898428558 |
| 32 | 0.75242222302368 | 0.495155553952639 | 0.247577776976319 |
| 33 | 0.796466231085201 | 0.407067537829597 | 0.203533768914799 |
| 34 | 0.78254655439361 | 0.434906891212781 | 0.217453445606391 |
| 35 | 0.754224149642098 | 0.491551700715805 | 0.245775850357902 |
| 36 | 0.68167522565987 | 0.63664954868026 | 0.31832477434013 |
| 37 | 0.581480695094537 | 0.837038609810926 | 0.418519304905463 |
| 38 | 0.764844137575393 | 0.470311724849214 | 0.235155862424607 |
| 39 | 0.797420132710172 | 0.405159734579656 | 0.202579867289828 |
| 40 | 0.786029100648242 | 0.427941798703516 | 0.213970899351758 |
| 41 | 0.762635393421114 | 0.474729213157772 | 0.237364606578886 |
| 42 | 0.640651487647036 | 0.718697024705929 | 0.359348512352964 |
| 43 | 0.498288262274247 | 0.996576524548494 | 0.501711737725753 |
| 44 | 0.363611094356632 | 0.727222188713263 | 0.636388905643368 |
| Meta Analysis of Goldfeld-Quandt test for Heteroskedasticity | |||
| Description | # significant tests | % significant tests | OK/NOK |
| 1% type I error level | 1 | 0.0344827586206897 | NOK |
| 5% type I error level | 4 | 0.137931034482759 | NOK |
| 10% type I error level | 5 | 0.172413793103448 | NOK |