| Multiple Linear Regression - Estimated Regression Equation |
| Y[t] = + 114.594644234140 -3.37758499824748X[t] + 19.3930884157026M1[t] + 8.24068261479143M2[t] + 18.3460353137049M3[t] + 46.4397669120224M4[t] + 5.50636041009466M5[t] -7.19766649141254M6[t] + 16.2378930073607M7[t] + 12.9232457062741M8[t] + 23.2659433052927M9[t] + 88.3890545040308M10[t] + 2.12402690150718M11[t] + 0.719130301437084t + e[t] |
| Multiple Linear Regression - Ordinary Least Squares | |||||
| Variable | Parameter | S.D. | T-STAT H0: parameter = 0 | 2-tail p-value | 1-tail p-value |
| (Intercept) | 114.594644234140 | 37.364412 | 3.0669 | 0.003616 | 0.001808 |
| X | -3.37758499824748 | 4.051767 | -0.8336 | 0.40881 | 0.204405 |
| M1 | 19.3930884157026 | 8.787307 | 2.2069 | 0.032347 | 0.016174 |
| M2 | 8.24068261479143 | 8.965368 | 0.9192 | 0.362802 | 0.181401 |
| M3 | 18.3460353137049 | 9.142056 | 2.0068 | 0.050672 | 0.025336 |
| M4 | 46.4397669120224 | 8.948323 | 5.1898 | 5e-06 | 2e-06 |
| M5 | 5.50636041009466 | 8.729952 | 0.6307 | 0.53133 | 0.265665 |
| M6 | -7.19766649141254 | 8.699136 | -0.8274 | 0.412282 | 0.206141 |
| M7 | 16.2378930073607 | 8.725626 | 1.8609 | 0.069151 | 0.034575 |
| M8 | 12.9232457062741 | 8.824547 | 1.4645 | 0.149868 | 0.074934 |
| M9 | 23.2659433052927 | 9.045111 | 2.5722 | 0.013399 | 0.0067 |
| M10 | 88.3890545040308 | 9.131021 | 9.6801 | 0 | 0 |
| M11 | 2.12402690150718 | 8.661705 | 0.2452 | 0.807376 | 0.403688 |
| t | 0.719130301437084 | 0.152503 | 4.7155 | 2.3e-05 | 1.1e-05 |
| Multiple Linear Regression - Regression Statistics | |
| Multiple R | 0.924217732216523 |
| R-squared | 0.854178416543453 |
| Adjusted R-squared | 0.812967969044863 |
| F-TEST (value) | 20.7272298261913 |
| F-TEST (DF numerator) | 13 |
| F-TEST (DF denominator) | 46 |
| p-value | 5.55111512312578e-15 |
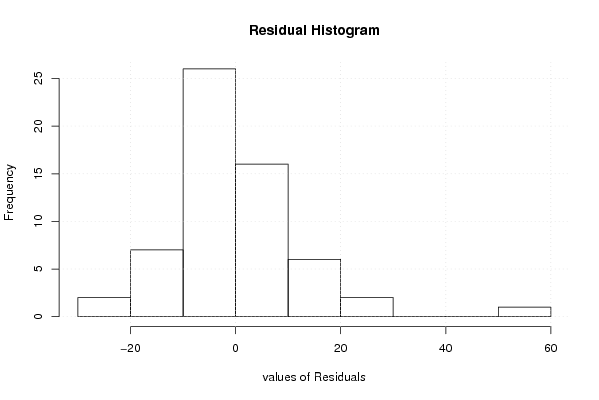
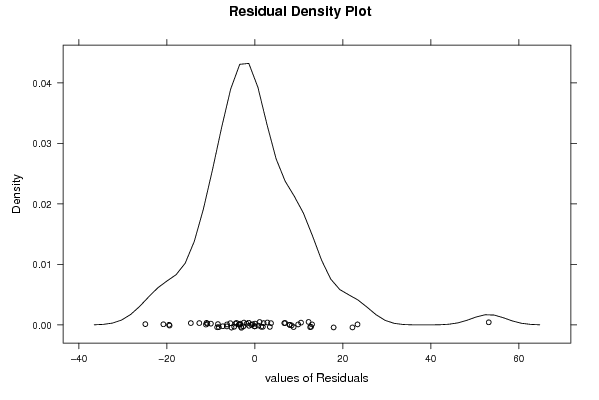
| Multiple Linear Regression - Residual Statistics | |
| Residual Standard Deviation | 13.6875386859959 |
| Sum Squared Residuals | 8618.04090290921 |
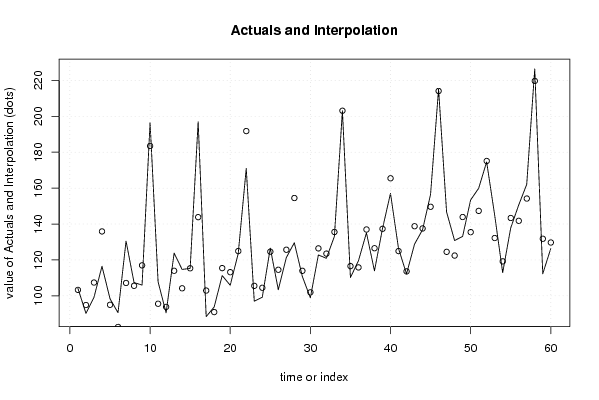
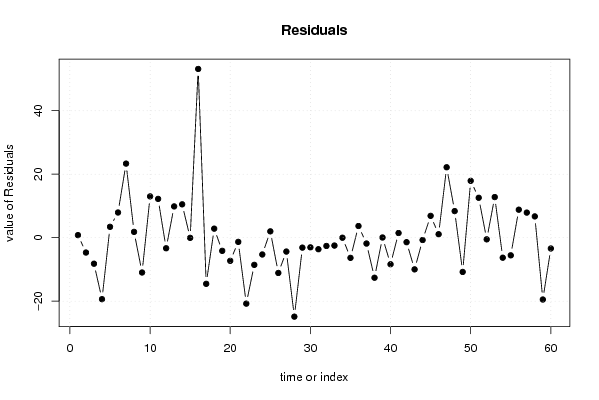
| Multiple Linear Regression - Actuals, Interpolation, and Residuals | |||
| Time or Index | Actuals | Interpolation Forecast | Residuals Prediction Error |
| 1 | 104.1 | 103.295322467578 | 0.804677532421608 |
| 2 | 90.2 | 94.8885979670522 | -4.68859796705217 |
| 3 | 99.2 | 107.401873466526 | -8.2018734665264 |
| 4 | 116.5 | 135.876976866456 | -19.3769768664563 |
| 5 | 98.4 | 94.9871836663162 | 3.41281633368384 |
| 6 | 90.6 | 82.6645285664213 | 7.9354714335787 |
| 7 | 130.5 | 107.156976866456 | 23.3430231335436 |
| 8 | 107.4 | 105.574735366281 | 1.82526463371890 |
| 9 | 106 | 116.974321766562 | -10.9743217665615 |
| 10 | 196.5 | 183.492080266386 | 13.0079197336138 |
| 11 | 107.8 | 95.5818734665264 | 12.2181265334735 |
| 12 | 90.5 | 93.8392183666316 | -3.33921836663156 |
| 13 | 123.8 | 113.951437083771 | 9.84856291622866 |
| 14 | 114.7 | 104.193678583947 | 10.5063214160533 |
| 15 | 115.3 | 115.355920084122 | -0.0559200841219734 |
| 16 | 197 | 143.831023484052 | 53.1689765159481 |
| 17 | 88.4 | 102.941230283912 | -14.5412302839116 |
| 18 | 93.8 | 90.9563336838416 | 2.84366631615844 |
| 19 | 111.3 | 115.448781983877 | -4.14878198387660 |
| 20 | 105.9 | 113.191023484052 | -7.29102348405185 |
| 21 | 123.6 | 124.928368384157 | -1.32836838415701 |
| 22 | 171 | 191.783885383807 | -20.7838853838065 |
| 23 | 97 | 105.562471083070 | -8.56247108307045 |
| 24 | 99.2 | 104.495332982825 | -5.2953329828251 |
| 25 | 126.6 | 124.607551699965 | 1.99244830003516 |
| 26 | 103.4 | 114.512034700315 | -11.1120347003155 |
| 27 | 121.3 | 125.674276200491 | -4.37427620049072 |
| 28 | 129.6 | 154.487138100245 | -24.8871381002454 |
| 29 | 110.8 | 113.935103399930 | -3.1351033999299 |
| 30 | 98.9 | 101.950206799860 | -3.0502067998598 |
| 31 | 122.8 | 126.442655099895 | -3.64265509989485 |
| 32 | 120.9 | 123.509379600421 | -2.60937960042059 |
| 33 | 133.1 | 135.584483000351 | -2.48448300035051 |
| 34 | 203.1 | 203.115516999649 | -0.0155169996494948 |
| 35 | 110.2 | 116.556344199089 | -6.35634419908867 |
| 36 | 119.5 | 115.826964598668 | 3.67303540133192 |
| 37 | 135.1 | 136.952458815282 | -1.85245881528208 |
| 38 | 113.9 | 126.519183315808 | -12.6191833158080 |
| 39 | 137.4 | 137.343666316158 | 0.0563336838415397 |
| 40 | 157.1 | 165.481011216264 | -8.38101121626362 |
| 41 | 126.4 | 124.928976515948 | 1.47102348405187 |
| 42 | 112.2 | 113.619596915528 | -1.41959691552754 |
| 43 | 128.8 | 138.787562215212 | -9.98756221521207 |
| 44 | 136.8 | 137.543079214862 | -0.74307921486157 |
| 45 | 156.5 | 149.618182614791 | 6.88181738520853 |
| 46 | 215.2 | 214.109390115668 | 1.09060988433224 |
| 47 | 146.7 | 124.510390816684 | 22.1896091833158 |
| 48 | 130.8 | 122.429977216965 | 8.37002278303542 |
| 49 | 133.1 | 143.893229933403 | -10.7932299334033 |
| 50 | 153.4 | 135.486505432878 | 17.9134945671223 |
| 51 | 159.9 | 147.324263932702 | 12.5757360672975 |
| 52 | 174.6 | 175.123850332983 | -0.523850332982872 |
| 53 | 145 | 132.207506133894 | 12.7924938661058 |
| 54 | 112.9 | 119.209334034350 | -6.3093340343498 |
| 55 | 137.8 | 143.36402383456 | -5.5640238345601 |
| 56 | 150.6 | 141.781782334385 | 8.81821766561513 |
| 57 | 162.1 | 154.194644234140 | 7.9053557658605 |
| 58 | 226.4 | 219.69912723449 | 6.70087276551 |
| 59 | 112.3 | 131.788920434630 | -19.4889204346302 |
| 60 | 126.3 | 129.708506834911 | -3.4085068349106 |
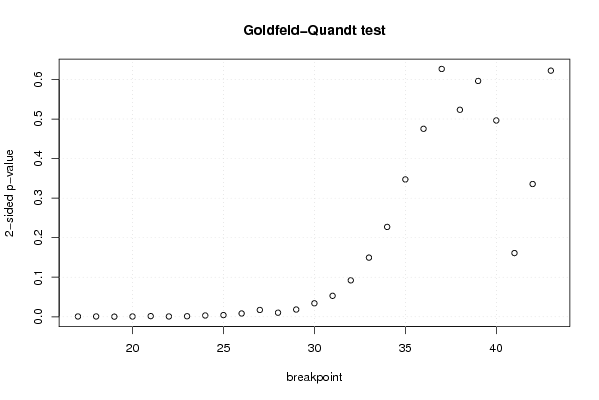
| Goldfeld-Quandt test for Heteroskedasticity | |||
| p-values | Alternative Hypothesis | ||
| breakpoint index | greater | 2-sided | less |
| 17 | 0.999618847419858 | 0.000762305160283137 | 0.000381152580141569 |
| 18 | 0.99958555644055 | 0.00082888711889816 | 0.00041444355944908 |
| 19 | 0.99985573752144 | 0.000288524957118729 | 0.000144262478559364 |
| 20 | 0.99966363981492 | 0.000672720370161743 | 0.000336360185080872 |
| 21 | 0.99918570367089 | 0.00162859265821895 | 0.000814296329109474 |
| 22 | 0.999616692418242 | 0.000766615163516541 | 0.000383307581758271 |
| 23 | 0.99933038011247 | 0.00133923977505964 | 0.000669619887529818 |
| 24 | 0.998380241037703 | 0.00323951792459501 | 0.00161975896229750 |
| 25 | 0.99787632070473 | 0.00424735859054138 | 0.00212367929527069 |
| 26 | 0.995839830735828 | 0.00832033852834286 | 0.00416016926417143 |
| 27 | 0.991413653250918 | 0.0171726934981637 | 0.00858634674908183 |
| 28 | 0.9948617924418 | 0.0102764151163989 | 0.00513820755819944 |
| 29 | 0.990856626076422 | 0.0182867478471555 | 0.00914337392357775 |
| 30 | 0.98298102604048 | 0.0340379479190416 | 0.0170189739595208 |
| 31 | 0.973522856677194 | 0.0529542866456121 | 0.0264771433228061 |
| 32 | 0.95393786258523 | 0.0921242748295378 | 0.0460621374147689 |
| 33 | 0.925210216701095 | 0.149579566597810 | 0.0747897832989052 |
| 34 | 0.886420693410233 | 0.227158613179535 | 0.113579306589767 |
| 35 | 0.826361590979276 | 0.347276818041448 | 0.173638409020724 |
| 36 | 0.762346981435996 | 0.475306037128008 | 0.237653018564004 |
| 37 | 0.686670022293673 | 0.626659955412654 | 0.313329977706327 |
| 38 | 0.738298716916327 | 0.523402566167345 | 0.261701283083673 |
| 39 | 0.701863181357667 | 0.596273637284667 | 0.298136818642333 |
| 40 | 0.751805375567711 | 0.496389248864578 | 0.248194624432289 |
| 41 | 0.91947101901493 | 0.161057961970139 | 0.0805289809850693 |
| 42 | 0.83215515953407 | 0.335689680931858 | 0.167844840465929 |
| 43 | 0.688813454480907 | 0.622373091038185 | 0.311186545519092 |
| Meta Analysis of Goldfeld-Quandt test for Heteroskedasticity | |||
| Description | # significant tests | % significant tests | OK/NOK |
| 1% type I error level | 10 | 0.370370370370370 | NOK |
| 5% type I error level | 14 | 0.518518518518518 | NOK |
| 10% type I error level | 16 | 0.592592592592593 | NOK |