Free Statistics

of Irreproducible Research!

Author's title

Author*The author of this computation has been verified*
R Software Modulerwasp_multipleregression.wasp
Title produced by softwareMultiple Regression
Date of computationFri, 20 Nov 2009 12:16:41 -0700
Cite this page as followsStatistical Computations at FreeStatistics.org, Office for Research Development and Education, URL https://freestatistics.org/blog/index.php?v=date/2009/Nov/20/t1258744734dwwy5rx8wptjl2j.htm/, Retrieved Tue, 23 Apr 2024 15:06:55 +0000
Statistical Computations at FreeStatistics.org, Office for Research Development and Education, URL https://freestatistics.org/blog/index.php?pk=58433, Retrieved Tue, 23 Apr 2024 15:06:55 +0000
QR Codes:

Original text written by user:
IsPrivate?No (this computation is public)
User-defined keywords
Estimated Impact185
Family? (F = Feedback message, R = changed R code, M = changed R Module, P = changed Parameters, D = changed Data)
-     [Multiple Regression] [Q1 The Seatbeltlaw] [2007-11-14 19:27:43] [8cd6641b921d30ebe00b648d1481bba0]
- RMPD  [Multiple Regression] [Seatbelt] [2009-11-12 13:54:52] [b98453cac15ba1066b407e146608df68]
-   PD      [Multiple Regression] [JJ Workshop 7, Mu...] [2009-11-20 19:16:41] [e31f2fa83f4a5291b9a51009566cf69b] [Current]
Feedback Forum

Post a new message
Dataseries X:
95.1	93.8
97	93.8
112.7	107.6
102.9	101
97.4	95.4
111.4	96.5
87.4	89.2
96.8	87.1
114.1	110.5
110.3	110.8
103.9	104.2
101.6	88.9
94.6	89.8
95.9	90
104.7	93.9
102.8	91.3
98.1	87.8
113.9	99.7
80.9	73.5
95.7	79.2
113.2	96.9
105.9	95.2
108.8	95.6
102.3	89.7
99	92.8
100.7	88
115.5	101.1
100.7	92.7
109.9	95.8
114.6	103.8
85.4	81.8
100.5	87.1
114.8	105.9
116.5	108.1
112.9	102.6
102	93.7
106	103.5
105.3	100.6
118.8	113.3
106.1	102.4
109.3	102.1
117.2	106.9
92.5	87.3
104.2	93.1
112.5	109.1
122.4	120.3
113.3	104.9
100	92.6
110.7	109.8
112.8	111.4
109.8	117.9
117.3	121.6
109.1	117.8
115.9	124.2
96	106.8
99.8	102.7
116.8	116.8
115.7	113.6
99.4	96.1
94.3	85


Summary of computational transaction
Raw Inputview raw input (R code)
Raw Outputview raw output of R engine
Computing time3 seconds
R Server'Gwilym Jenkins' @ 72.249.127.135

\begin{tabular}{lllllllll}
\hline
Summary of computational transaction \tabularnewline
Raw Input & view raw input (R code)  \tabularnewline
Raw Output & view raw output of R engine  \tabularnewline
Computing time & 3 seconds \tabularnewline
R Server & 'Gwilym Jenkins' @ 72.249.127.135 \tabularnewline
\hline
\end{tabular}
%Source: https://freestatistics.org/blog/index.php?pk=58433&T=0

[TABLE]
[ROW][C]Summary of computational transaction[/C][/ROW]
[ROW][C]Raw Input[/C][C]view raw input (R code) [/C][/ROW]
[ROW][C]Raw Output[/C][C]view raw output of R engine [/C][/ROW]
[ROW][C]Computing time[/C][C]3 seconds[/C][/ROW]
[ROW][C]R Server[/C][C]'Gwilym Jenkins' @ 72.249.127.135[/C][/ROW]
[/TABLE]
Source: https://freestatistics.org/blog/index.php?pk=58433&T=0

Globally Unique Identifier (entire table): ba.freestatistics.org/blog/index.php?pk=58433&T=0

As an alternative you can also use a QR Code:  

The GUIDs for individual cells are displayed in the table below:

Summary of computational transaction
Raw Inputview raw input (R code)
Raw Outputview raw output of R engine
Computing time3 seconds
R Server'Gwilym Jenkins' @ 72.249.127.135


Multiple Linear Regression - Estimated Regression Equation
TIA[t] = + 65.1843542853472 + 0.370552244553412IAidM[t] -1.44718191533665M1[t] + 0.208032101299208M2[t] + 6.42047202382795M3[t] + 1.87637352487574M4[t] + 1.38285142693650M5[t] + 8.79445734007539M6[t] -10.5523637676236M7[t] -0.419972158013988M8[t] + 7.74804980808746M9[t] + 6.93384022573633M10[t] + 3.69712861521563M11[t] + 0.0420376319371333t + e[t]

\begin{tabular}{lllllllll}
\hline
Multiple Linear Regression - Estimated Regression Equation \tabularnewline
TIA[t] =  +  65.1843542853472 +  0.370552244553412IAidM[t] -1.44718191533665M1[t] +  0.208032101299208M2[t] +  6.42047202382795M3[t] +  1.87637352487574M4[t] +  1.38285142693650M5[t] +  8.79445734007539M6[t] -10.5523637676236M7[t] -0.419972158013988M8[t] +  7.74804980808746M9[t] +  6.93384022573633M10[t] +  3.69712861521563M11[t] +  0.0420376319371333t  + e[t] \tabularnewline
\hline
\end{tabular}
%Source: https://freestatistics.org/blog/index.php?pk=58433&T=1

[TABLE]
[ROW][C]Multiple Linear Regression - Estimated Regression Equation[/C][/ROW]
[ROW][C]TIA[t] =  +  65.1843542853472 +  0.370552244553412IAidM[t] -1.44718191533665M1[t] +  0.208032101299208M2[t] +  6.42047202382795M3[t] +  1.87637352487574M4[t] +  1.38285142693650M5[t] +  8.79445734007539M6[t] -10.5523637676236M7[t] -0.419972158013988M8[t] +  7.74804980808746M9[t] +  6.93384022573633M10[t] +  3.69712861521563M11[t] +  0.0420376319371333t  + e[t][/C][/ROW]
[/TABLE]
Source: https://freestatistics.org/blog/index.php?pk=58433&T=1

Globally Unique Identifier (entire table): ba.freestatistics.org/blog/index.php?pk=58433&T=1

As an alternative you can also use a QR Code:  

The GUIDs for individual cells are displayed in the table below:

Multiple Linear Regression - Estimated Regression Equation
TIA[t] = + 65.1843542853472 + 0.370552244553412IAidM[t] -1.44718191533665M1[t] + 0.208032101299208M2[t] + 6.42047202382795M3[t] + 1.87637352487574M4[t] + 1.38285142693650M5[t] + 8.79445734007539M6[t] -10.5523637676236M7[t] -0.419972158013988M8[t] + 7.74804980808746M9[t] + 6.93384022573633M10[t] + 3.69712861521563M11[t] + 0.0420376319371333t + e[t]


Multiple Linear Regression - Ordinary Least Squares
VariableParameterS.D.T-STATH0: parameter = 02-tail p-value1-tail p-value
(Intercept)65.18435428534726.18654810.536500
IAidM0.3705522445534120.0743824.98189e-065e-06
M1-1.447181915336652.527046-0.57270.5696520.284826
M20.2080321012992082.4888680.08360.9337490.466875
M36.420472023827952.7849872.30540.0257060.012853
M41.876373524875742.59930.72190.4740240.237012
M51.382851426936502.5310740.54630.5874660.293733
M68.794457340075392.7230663.22960.002290.001145
M7-10.55236376762362.366246-4.45955.3e-052.6e-05
M8-0.4199721580139882.365497-0.17750.8598630.429932
M97.748049808087462.7450652.82250.0070150.003508
M106.933840225736332.8008642.47560.0170440.008522
M113.697128615215632.4994581.47920.145910.072955
t0.04203763193713330.0364841.15220.2551780.127589

\begin{tabular}{lllllllll}
\hline
Multiple Linear Regression - Ordinary Least Squares \tabularnewline
Variable & Parameter & S.D. & T-STATH0: parameter = 0 & 2-tail p-value & 1-tail p-value \tabularnewline
(Intercept) & 65.1843542853472 & 6.186548 & 10.5365 & 0 & 0 \tabularnewline
IAidM & 0.370552244553412 & 0.074382 & 4.9818 & 9e-06 & 5e-06 \tabularnewline
M1 & -1.44718191533665 & 2.527046 & -0.5727 & 0.569652 & 0.284826 \tabularnewline
M2 & 0.208032101299208 & 2.488868 & 0.0836 & 0.933749 & 0.466875 \tabularnewline
M3 & 6.42047202382795 & 2.784987 & 2.3054 & 0.025706 & 0.012853 \tabularnewline
M4 & 1.87637352487574 & 2.5993 & 0.7219 & 0.474024 & 0.237012 \tabularnewline
M5 & 1.38285142693650 & 2.531074 & 0.5463 & 0.587466 & 0.293733 \tabularnewline
M6 & 8.79445734007539 & 2.723066 & 3.2296 & 0.00229 & 0.001145 \tabularnewline
M7 & -10.5523637676236 & 2.366246 & -4.4595 & 5.3e-05 & 2.6e-05 \tabularnewline
M8 & -0.419972158013988 & 2.365497 & -0.1775 & 0.859863 & 0.429932 \tabularnewline
M9 & 7.74804980808746 & 2.745065 & 2.8225 & 0.007015 & 0.003508 \tabularnewline
M10 & 6.93384022573633 & 2.800864 & 2.4756 & 0.017044 & 0.008522 \tabularnewline
M11 & 3.69712861521563 & 2.499458 & 1.4792 & 0.14591 & 0.072955 \tabularnewline
t & 0.0420376319371333 & 0.036484 & 1.1522 & 0.255178 & 0.127589 \tabularnewline
\hline
\end{tabular}
%Source: https://freestatistics.org/blog/index.php?pk=58433&T=2

[TABLE]
[ROW][C]Multiple Linear Regression - Ordinary Least Squares[/C][/ROW]
[ROW][C]Variable[/C][C]Parameter[/C][C]S.D.[/C][C]T-STATH0: parameter = 0[/C][C]2-tail p-value[/C][C]1-tail p-value[/C][/ROW]
[ROW][C](Intercept)[/C][C]65.1843542853472[/C][C]6.186548[/C][C]10.5365[/C][C]0[/C][C]0[/C][/ROW]
[ROW][C]IAidM[/C][C]0.370552244553412[/C][C]0.074382[/C][C]4.9818[/C][C]9e-06[/C][C]5e-06[/C][/ROW]
[ROW][C]M1[/C][C]-1.44718191533665[/C][C]2.527046[/C][C]-0.5727[/C][C]0.569652[/C][C]0.284826[/C][/ROW]
[ROW][C]M2[/C][C]0.208032101299208[/C][C]2.488868[/C][C]0.0836[/C][C]0.933749[/C][C]0.466875[/C][/ROW]
[ROW][C]M3[/C][C]6.42047202382795[/C][C]2.784987[/C][C]2.3054[/C][C]0.025706[/C][C]0.012853[/C][/ROW]
[ROW][C]M4[/C][C]1.87637352487574[/C][C]2.5993[/C][C]0.7219[/C][C]0.474024[/C][C]0.237012[/C][/ROW]
[ROW][C]M5[/C][C]1.38285142693650[/C][C]2.531074[/C][C]0.5463[/C][C]0.587466[/C][C]0.293733[/C][/ROW]
[ROW][C]M6[/C][C]8.79445734007539[/C][C]2.723066[/C][C]3.2296[/C][C]0.00229[/C][C]0.001145[/C][/ROW]
[ROW][C]M7[/C][C]-10.5523637676236[/C][C]2.366246[/C][C]-4.4595[/C][C]5.3e-05[/C][C]2.6e-05[/C][/ROW]
[ROW][C]M8[/C][C]-0.419972158013988[/C][C]2.365497[/C][C]-0.1775[/C][C]0.859863[/C][C]0.429932[/C][/ROW]
[ROW][C]M9[/C][C]7.74804980808746[/C][C]2.745065[/C][C]2.8225[/C][C]0.007015[/C][C]0.003508[/C][/ROW]
[ROW][C]M10[/C][C]6.93384022573633[/C][C]2.800864[/C][C]2.4756[/C][C]0.017044[/C][C]0.008522[/C][/ROW]
[ROW][C]M11[/C][C]3.69712861521563[/C][C]2.499458[/C][C]1.4792[/C][C]0.14591[/C][C]0.072955[/C][/ROW]
[ROW][C]t[/C][C]0.0420376319371333[/C][C]0.036484[/C][C]1.1522[/C][C]0.255178[/C][C]0.127589[/C][/ROW]
[/TABLE]
Source: https://freestatistics.org/blog/index.php?pk=58433&T=2

Globally Unique Identifier (entire table): ba.freestatistics.org/blog/index.php?pk=58433&T=2

As an alternative you can also use a QR Code:  

The GUIDs for individual cells are displayed in the table below:

Multiple Linear Regression - Ordinary Least Squares
VariableParameterS.D.T-STATH0: parameter = 02-tail p-value1-tail p-value
(Intercept)65.18435428534726.18654810.536500
IAidM0.3705522445534120.0743824.98189e-065e-06
M1-1.447181915336652.527046-0.57270.5696520.284826
M20.2080321012992082.4888680.08360.9337490.466875
M36.420472023827952.7849872.30540.0257060.012853
M41.876373524875742.59930.72190.4740240.237012
M51.382851426936502.5310740.54630.5874660.293733
M68.794457340075392.7230663.22960.002290.001145
M7-10.55236376762362.366246-4.45955.3e-052.6e-05
M8-0.4199721580139882.365497-0.17750.8598630.429932
M97.748049808087462.7450652.82250.0070150.003508
M106.933840225736332.8008642.47560.0170440.008522
M113.697128615215632.4994581.47920.145910.072955
t0.04203763193713330.0364841.15220.2551780.127589


Multiple Linear Regression - Regression Statistics
Multiple R0.9304892192588
R-squared0.86581018715685
Adjusted R-squared0.82788697917944
F-TEST (value)22.8306156924424
F-TEST (DF numerator)13
F-TEST (DF denominator)46
p-value8.88178419700125e-16
Multiple Linear Regression - Residual Statistics
Residual Standard Deviation3.73365659029078
Sum Squared Residuals641.248810574203

\begin{tabular}{lllllllll}
\hline
Multiple Linear Regression - Regression Statistics \tabularnewline
Multiple R & 0.9304892192588 \tabularnewline
R-squared & 0.86581018715685 \tabularnewline
Adjusted R-squared & 0.82788697917944 \tabularnewline
F-TEST (value) & 22.8306156924424 \tabularnewline
F-TEST (DF numerator) & 13 \tabularnewline
F-TEST (DF denominator) & 46 \tabularnewline
p-value & 8.88178419700125e-16 \tabularnewline
Multiple Linear Regression - Residual Statistics \tabularnewline
Residual Standard Deviation & 3.73365659029078 \tabularnewline
Sum Squared Residuals & 641.248810574203 \tabularnewline
\hline
\end{tabular}
%Source: https://freestatistics.org/blog/index.php?pk=58433&T=3

[TABLE]
[ROW][C]Multiple Linear Regression - Regression Statistics[/C][/ROW]
[ROW][C]Multiple R[/C][C]0.9304892192588[/C][/ROW]
[ROW][C]R-squared[/C][C]0.86581018715685[/C][/ROW]
[ROW][C]Adjusted R-squared[/C][C]0.82788697917944[/C][/ROW]
[ROW][C]F-TEST (value)[/C][C]22.8306156924424[/C][/ROW]
[ROW][C]F-TEST (DF numerator)[/C][C]13[/C][/ROW]
[ROW][C]F-TEST (DF denominator)[/C][C]46[/C][/ROW]
[ROW][C]p-value[/C][C]8.88178419700125e-16[/C][/ROW]
[ROW][C]Multiple Linear Regression - Residual Statistics[/C][/ROW]
[ROW][C]Residual Standard Deviation[/C][C]3.73365659029078[/C][/ROW]
[ROW][C]Sum Squared Residuals[/C][C]641.248810574203[/C][/ROW]
[/TABLE]
Source: https://freestatistics.org/blog/index.php?pk=58433&T=3

Globally Unique Identifier (entire table): ba.freestatistics.org/blog/index.php?pk=58433&T=3

As an alternative you can also use a QR Code:  

The GUIDs for individual cells are displayed in the table below:

Multiple Linear Regression - Regression Statistics
Multiple R0.9304892192588
R-squared0.86581018715685
Adjusted R-squared0.82788697917944
F-TEST (value)22.8306156924424
F-TEST (DF numerator)13
F-TEST (DF denominator)46
p-value8.88178419700125e-16
Multiple Linear Regression - Residual Statistics
Residual Standard Deviation3.73365659029078
Sum Squared Residuals641.248810574203


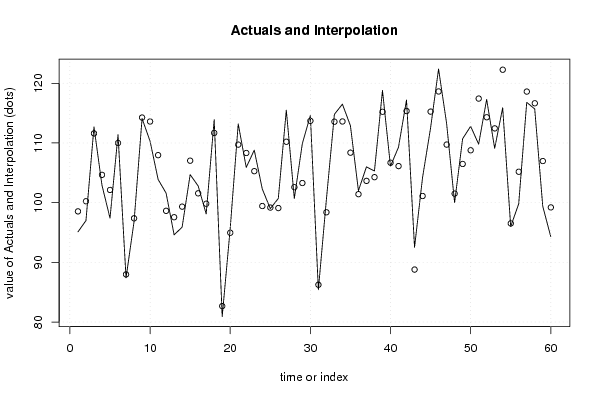
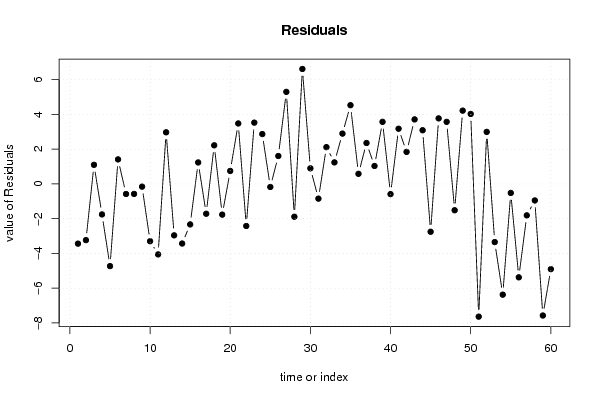
Multiple Linear Regression - Actuals, Interpolation, and Residuals
Time or IndexActualsInterpolationForecastResidualsPrediction Error
195.198.5370105410575-3.4370105410575
297100.234262189631-3.23426218963068
3112.7111.6023607189341.09763928106633
4102.9104.654655037866-1.75465503786607
597.4102.128078002365-4.72807800236485
6111.4109.9893290164501.41067098355037
787.487.9795141554479-0.579514155447851
896.897.3757836834324-0.57578368343245
9114.1114.256765804021-0.156765804020882
10110.3113.595759526973-3.29575952697290
11103.9107.955440734337-4.05544073433680
12101.698.63090040939112.96909959060888
1394.697.5592531460897-2.95925314608968
1495.999.3306152435733-3.43061524357334
15104.7107.030246551798-2.33024655179752
16102.8101.5647498489441.23525015105642
1798.199.8163325270045-1.71633252700453
18113.9111.6795477822662.22045221773385
1980.982.6662954992049-1.76629549920488
2095.794.95287253470610.747127465293902
21113.2109.721706861343.47829313865993
22105.9108.319596095185-2.41959609518527
23108.8105.2731430144233.52685698557693
24102.399.43179378827942.86820621172055
259999.1753614629955-0.175361462995504
26100.799.09396233771211.60603766228788
27115.5110.2026742958285.29732570417232
28100.7102.587974574564-1.88797457456395
29109.9103.2852020666776.61479793332259
30114.6113.7032635681810.89673643181925
3185.486.2463307122438-0.846330712243796
32100.598.38468684992372.11531315007635
33114.8113.5611286455661.23887135443362
34116.5113.604171633172.89582836683012
35112.9108.3714603095434.52853969045745
36102101.4184543497390.581545650261309
37106103.6447220629632.35527793703739
38105.3104.2673722023311.03262779766929
39118.8115.2278632626253.57213673737509
40106.1106.686782929978-0.586782929977654
41109.3106.1241327906103.17586720939048
42117.2115.3564271095421.84357289045808
4392.588.78881964053323.71118035946683
44104.2101.1124519004903.08754809951028
45112.5115.251347411383-2.75134741138289
46122.4118.6293605999673.77063940003289
47113.3109.7281820552613.57181794473899
48100101.515298463976-1.51529846397553
49110.7106.4836527868954.2163472131053
50112.8108.7737880267534.02621197324684
51109.8117.436855170816-7.63685517081621
52117.3114.3058376086492.99416239135124
53109.1112.446254613344-3.34625461334369
54115.9122.271432523562-6.37143252356154
559696.5190399925703-0.519039992570301
5699.8105.174205031448-5.37420503144808
57116.8118.609051277690-1.80905127768977
58115.7116.651112144705-0.951112144704847
5999.4106.971773886437-7.57177388643657
6094.399.2035529886152-4.90355298861521

\begin{tabular}{lllllllll}
\hline
Multiple Linear Regression - Actuals, Interpolation, and Residuals \tabularnewline
Time or Index & Actuals & InterpolationForecast & ResidualsPrediction Error \tabularnewline
1 & 95.1 & 98.5370105410575 & -3.4370105410575 \tabularnewline
2 & 97 & 100.234262189631 & -3.23426218963068 \tabularnewline
3 & 112.7 & 111.602360718934 & 1.09763928106633 \tabularnewline
4 & 102.9 & 104.654655037866 & -1.75465503786607 \tabularnewline
5 & 97.4 & 102.128078002365 & -4.72807800236485 \tabularnewline
6 & 111.4 & 109.989329016450 & 1.41067098355037 \tabularnewline
7 & 87.4 & 87.9795141554479 & -0.579514155447851 \tabularnewline
8 & 96.8 & 97.3757836834324 & -0.57578368343245 \tabularnewline
9 & 114.1 & 114.256765804021 & -0.156765804020882 \tabularnewline
10 & 110.3 & 113.595759526973 & -3.29575952697290 \tabularnewline
11 & 103.9 & 107.955440734337 & -4.05544073433680 \tabularnewline
12 & 101.6 & 98.6309004093911 & 2.96909959060888 \tabularnewline
13 & 94.6 & 97.5592531460897 & -2.95925314608968 \tabularnewline
14 & 95.9 & 99.3306152435733 & -3.43061524357334 \tabularnewline
15 & 104.7 & 107.030246551798 & -2.33024655179752 \tabularnewline
16 & 102.8 & 101.564749848944 & 1.23525015105642 \tabularnewline
17 & 98.1 & 99.8163325270045 & -1.71633252700453 \tabularnewline
18 & 113.9 & 111.679547782266 & 2.22045221773385 \tabularnewline
19 & 80.9 & 82.6662954992049 & -1.76629549920488 \tabularnewline
20 & 95.7 & 94.9528725347061 & 0.747127465293902 \tabularnewline
21 & 113.2 & 109.72170686134 & 3.47829313865993 \tabularnewline
22 & 105.9 & 108.319596095185 & -2.41959609518527 \tabularnewline
23 & 108.8 & 105.273143014423 & 3.52685698557693 \tabularnewline
24 & 102.3 & 99.4317937882794 & 2.86820621172055 \tabularnewline
25 & 99 & 99.1753614629955 & -0.175361462995504 \tabularnewline
26 & 100.7 & 99.0939623377121 & 1.60603766228788 \tabularnewline
27 & 115.5 & 110.202674295828 & 5.29732570417232 \tabularnewline
28 & 100.7 & 102.587974574564 & -1.88797457456395 \tabularnewline
29 & 109.9 & 103.285202066677 & 6.61479793332259 \tabularnewline
30 & 114.6 & 113.703263568181 & 0.89673643181925 \tabularnewline
31 & 85.4 & 86.2463307122438 & -0.846330712243796 \tabularnewline
32 & 100.5 & 98.3846868499237 & 2.11531315007635 \tabularnewline
33 & 114.8 & 113.561128645566 & 1.23887135443362 \tabularnewline
34 & 116.5 & 113.60417163317 & 2.89582836683012 \tabularnewline
35 & 112.9 & 108.371460309543 & 4.52853969045745 \tabularnewline
36 & 102 & 101.418454349739 & 0.581545650261309 \tabularnewline
37 & 106 & 103.644722062963 & 2.35527793703739 \tabularnewline
38 & 105.3 & 104.267372202331 & 1.03262779766929 \tabularnewline
39 & 118.8 & 115.227863262625 & 3.57213673737509 \tabularnewline
40 & 106.1 & 106.686782929978 & -0.586782929977654 \tabularnewline
41 & 109.3 & 106.124132790610 & 3.17586720939048 \tabularnewline
42 & 117.2 & 115.356427109542 & 1.84357289045808 \tabularnewline
43 & 92.5 & 88.7888196405332 & 3.71118035946683 \tabularnewline
44 & 104.2 & 101.112451900490 & 3.08754809951028 \tabularnewline
45 & 112.5 & 115.251347411383 & -2.75134741138289 \tabularnewline
46 & 122.4 & 118.629360599967 & 3.77063940003289 \tabularnewline
47 & 113.3 & 109.728182055261 & 3.57181794473899 \tabularnewline
48 & 100 & 101.515298463976 & -1.51529846397553 \tabularnewline
49 & 110.7 & 106.483652786895 & 4.2163472131053 \tabularnewline
50 & 112.8 & 108.773788026753 & 4.02621197324684 \tabularnewline
51 & 109.8 & 117.436855170816 & -7.63685517081621 \tabularnewline
52 & 117.3 & 114.305837608649 & 2.99416239135124 \tabularnewline
53 & 109.1 & 112.446254613344 & -3.34625461334369 \tabularnewline
54 & 115.9 & 122.271432523562 & -6.37143252356154 \tabularnewline
55 & 96 & 96.5190399925703 & -0.519039992570301 \tabularnewline
56 & 99.8 & 105.174205031448 & -5.37420503144808 \tabularnewline
57 & 116.8 & 118.609051277690 & -1.80905127768977 \tabularnewline
58 & 115.7 & 116.651112144705 & -0.951112144704847 \tabularnewline
59 & 99.4 & 106.971773886437 & -7.57177388643657 \tabularnewline
60 & 94.3 & 99.2035529886152 & -4.90355298861521 \tabularnewline
\hline
\end{tabular}
%Source: https://freestatistics.org/blog/index.php?pk=58433&T=4

[TABLE]
[ROW][C]Multiple Linear Regression - Actuals, Interpolation, and Residuals[/C][/ROW]
[ROW][C]Time or Index[/C][C]Actuals[/C][C]InterpolationForecast[/C][C]ResidualsPrediction Error[/C][/ROW]
[ROW][C]1[/C][C]95.1[/C][C]98.5370105410575[/C][C]-3.4370105410575[/C][/ROW]
[ROW][C]2[/C][C]97[/C][C]100.234262189631[/C][C]-3.23426218963068[/C][/ROW]
[ROW][C]3[/C][C]112.7[/C][C]111.602360718934[/C][C]1.09763928106633[/C][/ROW]
[ROW][C]4[/C][C]102.9[/C][C]104.654655037866[/C][C]-1.75465503786607[/C][/ROW]
[ROW][C]5[/C][C]97.4[/C][C]102.128078002365[/C][C]-4.72807800236485[/C][/ROW]
[ROW][C]6[/C][C]111.4[/C][C]109.989329016450[/C][C]1.41067098355037[/C][/ROW]
[ROW][C]7[/C][C]87.4[/C][C]87.9795141554479[/C][C]-0.579514155447851[/C][/ROW]
[ROW][C]8[/C][C]96.8[/C][C]97.3757836834324[/C][C]-0.57578368343245[/C][/ROW]
[ROW][C]9[/C][C]114.1[/C][C]114.256765804021[/C][C]-0.156765804020882[/C][/ROW]
[ROW][C]10[/C][C]110.3[/C][C]113.595759526973[/C][C]-3.29575952697290[/C][/ROW]
[ROW][C]11[/C][C]103.9[/C][C]107.955440734337[/C][C]-4.05544073433680[/C][/ROW]
[ROW][C]12[/C][C]101.6[/C][C]98.6309004093911[/C][C]2.96909959060888[/C][/ROW]
[ROW][C]13[/C][C]94.6[/C][C]97.5592531460897[/C][C]-2.95925314608968[/C][/ROW]
[ROW][C]14[/C][C]95.9[/C][C]99.3306152435733[/C][C]-3.43061524357334[/C][/ROW]
[ROW][C]15[/C][C]104.7[/C][C]107.030246551798[/C][C]-2.33024655179752[/C][/ROW]
[ROW][C]16[/C][C]102.8[/C][C]101.564749848944[/C][C]1.23525015105642[/C][/ROW]
[ROW][C]17[/C][C]98.1[/C][C]99.8163325270045[/C][C]-1.71633252700453[/C][/ROW]
[ROW][C]18[/C][C]113.9[/C][C]111.679547782266[/C][C]2.22045221773385[/C][/ROW]
[ROW][C]19[/C][C]80.9[/C][C]82.6662954992049[/C][C]-1.76629549920488[/C][/ROW]
[ROW][C]20[/C][C]95.7[/C][C]94.9528725347061[/C][C]0.747127465293902[/C][/ROW]
[ROW][C]21[/C][C]113.2[/C][C]109.72170686134[/C][C]3.47829313865993[/C][/ROW]
[ROW][C]22[/C][C]105.9[/C][C]108.319596095185[/C][C]-2.41959609518527[/C][/ROW]
[ROW][C]23[/C][C]108.8[/C][C]105.273143014423[/C][C]3.52685698557693[/C][/ROW]
[ROW][C]24[/C][C]102.3[/C][C]99.4317937882794[/C][C]2.86820621172055[/C][/ROW]
[ROW][C]25[/C][C]99[/C][C]99.1753614629955[/C][C]-0.175361462995504[/C][/ROW]
[ROW][C]26[/C][C]100.7[/C][C]99.0939623377121[/C][C]1.60603766228788[/C][/ROW]
[ROW][C]27[/C][C]115.5[/C][C]110.202674295828[/C][C]5.29732570417232[/C][/ROW]
[ROW][C]28[/C][C]100.7[/C][C]102.587974574564[/C][C]-1.88797457456395[/C][/ROW]
[ROW][C]29[/C][C]109.9[/C][C]103.285202066677[/C][C]6.61479793332259[/C][/ROW]
[ROW][C]30[/C][C]114.6[/C][C]113.703263568181[/C][C]0.89673643181925[/C][/ROW]
[ROW][C]31[/C][C]85.4[/C][C]86.2463307122438[/C][C]-0.846330712243796[/C][/ROW]
[ROW][C]32[/C][C]100.5[/C][C]98.3846868499237[/C][C]2.11531315007635[/C][/ROW]
[ROW][C]33[/C][C]114.8[/C][C]113.561128645566[/C][C]1.23887135443362[/C][/ROW]
[ROW][C]34[/C][C]116.5[/C][C]113.60417163317[/C][C]2.89582836683012[/C][/ROW]
[ROW][C]35[/C][C]112.9[/C][C]108.371460309543[/C][C]4.52853969045745[/C][/ROW]
[ROW][C]36[/C][C]102[/C][C]101.418454349739[/C][C]0.581545650261309[/C][/ROW]
[ROW][C]37[/C][C]106[/C][C]103.644722062963[/C][C]2.35527793703739[/C][/ROW]
[ROW][C]38[/C][C]105.3[/C][C]104.267372202331[/C][C]1.03262779766929[/C][/ROW]
[ROW][C]39[/C][C]118.8[/C][C]115.227863262625[/C][C]3.57213673737509[/C][/ROW]
[ROW][C]40[/C][C]106.1[/C][C]106.686782929978[/C][C]-0.586782929977654[/C][/ROW]
[ROW][C]41[/C][C]109.3[/C][C]106.124132790610[/C][C]3.17586720939048[/C][/ROW]
[ROW][C]42[/C][C]117.2[/C][C]115.356427109542[/C][C]1.84357289045808[/C][/ROW]
[ROW][C]43[/C][C]92.5[/C][C]88.7888196405332[/C][C]3.71118035946683[/C][/ROW]
[ROW][C]44[/C][C]104.2[/C][C]101.112451900490[/C][C]3.08754809951028[/C][/ROW]
[ROW][C]45[/C][C]112.5[/C][C]115.251347411383[/C][C]-2.75134741138289[/C][/ROW]
[ROW][C]46[/C][C]122.4[/C][C]118.629360599967[/C][C]3.77063940003289[/C][/ROW]
[ROW][C]47[/C][C]113.3[/C][C]109.728182055261[/C][C]3.57181794473899[/C][/ROW]
[ROW][C]48[/C][C]100[/C][C]101.515298463976[/C][C]-1.51529846397553[/C][/ROW]
[ROW][C]49[/C][C]110.7[/C][C]106.483652786895[/C][C]4.2163472131053[/C][/ROW]
[ROW][C]50[/C][C]112.8[/C][C]108.773788026753[/C][C]4.02621197324684[/C][/ROW]
[ROW][C]51[/C][C]109.8[/C][C]117.436855170816[/C][C]-7.63685517081621[/C][/ROW]
[ROW][C]52[/C][C]117.3[/C][C]114.305837608649[/C][C]2.99416239135124[/C][/ROW]
[ROW][C]53[/C][C]109.1[/C][C]112.446254613344[/C][C]-3.34625461334369[/C][/ROW]
[ROW][C]54[/C][C]115.9[/C][C]122.271432523562[/C][C]-6.37143252356154[/C][/ROW]
[ROW][C]55[/C][C]96[/C][C]96.5190399925703[/C][C]-0.519039992570301[/C][/ROW]
[ROW][C]56[/C][C]99.8[/C][C]105.174205031448[/C][C]-5.37420503144808[/C][/ROW]
[ROW][C]57[/C][C]116.8[/C][C]118.609051277690[/C][C]-1.80905127768977[/C][/ROW]
[ROW][C]58[/C][C]115.7[/C][C]116.651112144705[/C][C]-0.951112144704847[/C][/ROW]
[ROW][C]59[/C][C]99.4[/C][C]106.971773886437[/C][C]-7.57177388643657[/C][/ROW]
[ROW][C]60[/C][C]94.3[/C][C]99.2035529886152[/C][C]-4.90355298861521[/C][/ROW]
[/TABLE]
Source: https://freestatistics.org/blog/index.php?pk=58433&T=4

Globally Unique Identifier (entire table): ba.freestatistics.org/blog/index.php?pk=58433&T=4

As an alternative you can also use a QR Code:  

The GUIDs for individual cells are displayed in the table below:

Multiple Linear Regression - Actuals, Interpolation, and Residuals
Time or IndexActualsInterpolationForecastResidualsPrediction Error
195.198.5370105410575-3.4370105410575
297100.234262189631-3.23426218963068
3112.7111.6023607189341.09763928106633
4102.9104.654655037866-1.75465503786607
597.4102.128078002365-4.72807800236485
6111.4109.9893290164501.41067098355037
787.487.9795141554479-0.579514155447851
896.897.3757836834324-0.57578368343245
9114.1114.256765804021-0.156765804020882
10110.3113.595759526973-3.29575952697290
11103.9107.955440734337-4.05544073433680
12101.698.63090040939112.96909959060888
1394.697.5592531460897-2.95925314608968
1495.999.3306152435733-3.43061524357334
15104.7107.030246551798-2.33024655179752
16102.8101.5647498489441.23525015105642
1798.199.8163325270045-1.71633252700453
18113.9111.6795477822662.22045221773385
1980.982.6662954992049-1.76629549920488
2095.794.95287253470610.747127465293902
21113.2109.721706861343.47829313865993
22105.9108.319596095185-2.41959609518527
23108.8105.2731430144233.52685698557693
24102.399.43179378827942.86820621172055
259999.1753614629955-0.175361462995504
26100.799.09396233771211.60603766228788
27115.5110.2026742958285.29732570417232
28100.7102.587974574564-1.88797457456395
29109.9103.2852020666776.61479793332259
30114.6113.7032635681810.89673643181925
3185.486.2463307122438-0.846330712243796
32100.598.38468684992372.11531315007635
33114.8113.5611286455661.23887135443362
34116.5113.604171633172.89582836683012
35112.9108.3714603095434.52853969045745
36102101.4184543497390.581545650261309
37106103.6447220629632.35527793703739
38105.3104.2673722023311.03262779766929
39118.8115.2278632626253.57213673737509
40106.1106.686782929978-0.586782929977654
41109.3106.1241327906103.17586720939048
42117.2115.3564271095421.84357289045808
4392.588.78881964053323.71118035946683
44104.2101.1124519004903.08754809951028
45112.5115.251347411383-2.75134741138289
46122.4118.6293605999673.77063940003289
47113.3109.7281820552613.57181794473899
48100101.515298463976-1.51529846397553
49110.7106.4836527868954.2163472131053
50112.8108.7737880267534.02621197324684
51109.8117.436855170816-7.63685517081621
52117.3114.3058376086492.99416239135124
53109.1112.446254613344-3.34625461334369
54115.9122.271432523562-6.37143252356154
559696.5190399925703-0.519039992570301
5699.8105.174205031448-5.37420503144808
57116.8118.609051277690-1.80905127768977
58115.7116.651112144705-0.951112144704847
5999.4106.971773886437-7.57177388643657
6094.399.2035529886152-4.90355298861521


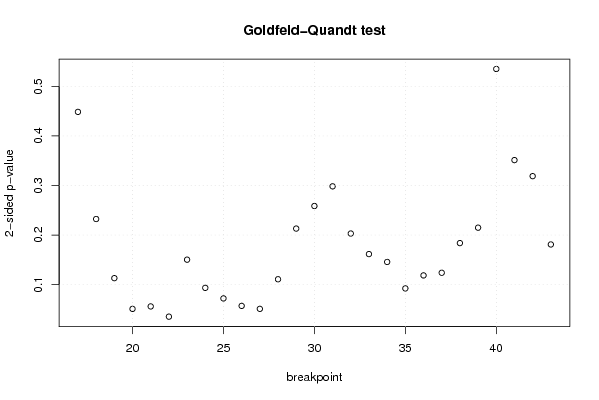
Goldfeld-Quandt test for Heteroskedasticity
p-valuesAlternative Hypothesis
breakpoint indexgreater2-sidedless
170.2242112425315920.4484224850631840.775788757468408
180.1161834877509580.2323669755019160.883816512249042
190.05652833741348230.1130566748269650.943471662586518
200.02552553832852340.05105107665704680.974474461671477
210.02801078041218610.05602156082437220.971989219587814
220.01769785106077240.03539570212154470.982302148939228
230.0751746541124610.1503493082249220.924825345887539
240.04675064264771330.09350128529542660.953249357352287
250.0360970692756550.072194138551310.963902930724345
260.02856036571207260.05712073142414520.971439634287927
270.02557919759829450.05115839519658910.974420802401705
280.05542063589978610.1108412717995720.944579364100214
290.1065300342446110.2130600684892230.893469965755389
300.1292827097748560.2585654195497120.870717290225144
310.1491465577468010.2982931154936020.850853442253199
320.1015388256824460.2030776513648930.898461174317554
330.08083359439948120.1616671887989620.919166405600519
340.07287654856542040.1457530971308410.92712345143458
350.04618846040461930.09237692080923870.95381153959538
360.05930886445413730.1186177289082750.940691135545863
370.06195698114602140.1239139622920430.938043018853979
380.09190861179777650.1838172235955530.908091388202223
390.1074419855009820.2148839710019650.892558014499018
400.2675438106633020.5350876213266040.732456189336698
410.1756033077959520.3512066155919030.824396692204048
420.1594162245990550.3188324491981090.840583775400945
430.09051138346703890.1810227669340780.909488616532961

\begin{tabular}{lllllllll}
\hline
Goldfeld-Quandt test for Heteroskedasticity \tabularnewline
p-values & Alternative Hypothesis \tabularnewline
breakpoint index & greater & 2-sided & less \tabularnewline
17 & 0.224211242531592 & 0.448422485063184 & 0.775788757468408 \tabularnewline
18 & 0.116183487750958 & 0.232366975501916 & 0.883816512249042 \tabularnewline
19 & 0.0565283374134823 & 0.113056674826965 & 0.943471662586518 \tabularnewline
20 & 0.0255255383285234 & 0.0510510766570468 & 0.974474461671477 \tabularnewline
21 & 0.0280107804121861 & 0.0560215608243722 & 0.971989219587814 \tabularnewline
22 & 0.0176978510607724 & 0.0353957021215447 & 0.982302148939228 \tabularnewline
23 & 0.075174654112461 & 0.150349308224922 & 0.924825345887539 \tabularnewline
24 & 0.0467506426477133 & 0.0935012852954266 & 0.953249357352287 \tabularnewline
25 & 0.036097069275655 & 0.07219413855131 & 0.963902930724345 \tabularnewline
26 & 0.0285603657120726 & 0.0571207314241452 & 0.971439634287927 \tabularnewline
27 & 0.0255791975982945 & 0.0511583951965891 & 0.974420802401705 \tabularnewline
28 & 0.0554206358997861 & 0.110841271799572 & 0.944579364100214 \tabularnewline
29 & 0.106530034244611 & 0.213060068489223 & 0.893469965755389 \tabularnewline
30 & 0.129282709774856 & 0.258565419549712 & 0.870717290225144 \tabularnewline
31 & 0.149146557746801 & 0.298293115493602 & 0.850853442253199 \tabularnewline
32 & 0.101538825682446 & 0.203077651364893 & 0.898461174317554 \tabularnewline
33 & 0.0808335943994812 & 0.161667188798962 & 0.919166405600519 \tabularnewline
34 & 0.0728765485654204 & 0.145753097130841 & 0.92712345143458 \tabularnewline
35 & 0.0461884604046193 & 0.0923769208092387 & 0.95381153959538 \tabularnewline
36 & 0.0593088644541373 & 0.118617728908275 & 0.940691135545863 \tabularnewline
37 & 0.0619569811460214 & 0.123913962292043 & 0.938043018853979 \tabularnewline
38 & 0.0919086117977765 & 0.183817223595553 & 0.908091388202223 \tabularnewline
39 & 0.107441985500982 & 0.214883971001965 & 0.892558014499018 \tabularnewline
40 & 0.267543810663302 & 0.535087621326604 & 0.732456189336698 \tabularnewline
41 & 0.175603307795952 & 0.351206615591903 & 0.824396692204048 \tabularnewline
42 & 0.159416224599055 & 0.318832449198109 & 0.840583775400945 \tabularnewline
43 & 0.0905113834670389 & 0.181022766934078 & 0.909488616532961 \tabularnewline
\hline
\end{tabular}
%Source: https://freestatistics.org/blog/index.php?pk=58433&T=5

[TABLE]
[ROW][C]Goldfeld-Quandt test for Heteroskedasticity[/C][/ROW]
[ROW][C]p-values[/C][C]Alternative Hypothesis[/C][/ROW]
[ROW][C]breakpoint index[/C][C]greater[/C][C]2-sided[/C][C]less[/C][/ROW]
[ROW][C]17[/C][C]0.224211242531592[/C][C]0.448422485063184[/C][C]0.775788757468408[/C][/ROW]
[ROW][C]18[/C][C]0.116183487750958[/C][C]0.232366975501916[/C][C]0.883816512249042[/C][/ROW]
[ROW][C]19[/C][C]0.0565283374134823[/C][C]0.113056674826965[/C][C]0.943471662586518[/C][/ROW]
[ROW][C]20[/C][C]0.0255255383285234[/C][C]0.0510510766570468[/C][C]0.974474461671477[/C][/ROW]
[ROW][C]21[/C][C]0.0280107804121861[/C][C]0.0560215608243722[/C][C]0.971989219587814[/C][/ROW]
[ROW][C]22[/C][C]0.0176978510607724[/C][C]0.0353957021215447[/C][C]0.982302148939228[/C][/ROW]
[ROW][C]23[/C][C]0.075174654112461[/C][C]0.150349308224922[/C][C]0.924825345887539[/C][/ROW]
[ROW][C]24[/C][C]0.0467506426477133[/C][C]0.0935012852954266[/C][C]0.953249357352287[/C][/ROW]
[ROW][C]25[/C][C]0.036097069275655[/C][C]0.07219413855131[/C][C]0.963902930724345[/C][/ROW]
[ROW][C]26[/C][C]0.0285603657120726[/C][C]0.0571207314241452[/C][C]0.971439634287927[/C][/ROW]
[ROW][C]27[/C][C]0.0255791975982945[/C][C]0.0511583951965891[/C][C]0.974420802401705[/C][/ROW]
[ROW][C]28[/C][C]0.0554206358997861[/C][C]0.110841271799572[/C][C]0.944579364100214[/C][/ROW]
[ROW][C]29[/C][C]0.106530034244611[/C][C]0.213060068489223[/C][C]0.893469965755389[/C][/ROW]
[ROW][C]30[/C][C]0.129282709774856[/C][C]0.258565419549712[/C][C]0.870717290225144[/C][/ROW]
[ROW][C]31[/C][C]0.149146557746801[/C][C]0.298293115493602[/C][C]0.850853442253199[/C][/ROW]
[ROW][C]32[/C][C]0.101538825682446[/C][C]0.203077651364893[/C][C]0.898461174317554[/C][/ROW]
[ROW][C]33[/C][C]0.0808335943994812[/C][C]0.161667188798962[/C][C]0.919166405600519[/C][/ROW]
[ROW][C]34[/C][C]0.0728765485654204[/C][C]0.145753097130841[/C][C]0.92712345143458[/C][/ROW]
[ROW][C]35[/C][C]0.0461884604046193[/C][C]0.0923769208092387[/C][C]0.95381153959538[/C][/ROW]
[ROW][C]36[/C][C]0.0593088644541373[/C][C]0.118617728908275[/C][C]0.940691135545863[/C][/ROW]
[ROW][C]37[/C][C]0.0619569811460214[/C][C]0.123913962292043[/C][C]0.938043018853979[/C][/ROW]
[ROW][C]38[/C][C]0.0919086117977765[/C][C]0.183817223595553[/C][C]0.908091388202223[/C][/ROW]
[ROW][C]39[/C][C]0.107441985500982[/C][C]0.214883971001965[/C][C]0.892558014499018[/C][/ROW]
[ROW][C]40[/C][C]0.267543810663302[/C][C]0.535087621326604[/C][C]0.732456189336698[/C][/ROW]
[ROW][C]41[/C][C]0.175603307795952[/C][C]0.351206615591903[/C][C]0.824396692204048[/C][/ROW]
[ROW][C]42[/C][C]0.159416224599055[/C][C]0.318832449198109[/C][C]0.840583775400945[/C][/ROW]
[ROW][C]43[/C][C]0.0905113834670389[/C][C]0.181022766934078[/C][C]0.909488616532961[/C][/ROW]
[/TABLE]
Source: https://freestatistics.org/blog/index.php?pk=58433&T=5

Globally Unique Identifier (entire table): ba.freestatistics.org/blog/index.php?pk=58433&T=5

As an alternative you can also use a QR Code:  

The GUIDs for individual cells are displayed in the table below:

Goldfeld-Quandt test for Heteroskedasticity
p-valuesAlternative Hypothesis
breakpoint indexgreater2-sidedless
170.2242112425315920.4484224850631840.775788757468408
180.1161834877509580.2323669755019160.883816512249042
190.05652833741348230.1130566748269650.943471662586518
200.02552553832852340.05105107665704680.974474461671477
210.02801078041218610.05602156082437220.971989219587814
220.01769785106077240.03539570212154470.982302148939228
230.0751746541124610.1503493082249220.924825345887539
240.04675064264771330.09350128529542660.953249357352287
250.0360970692756550.072194138551310.963902930724345
260.02856036571207260.05712073142414520.971439634287927
270.02557919759829450.05115839519658910.974420802401705
280.05542063589978610.1108412717995720.944579364100214
290.1065300342446110.2130600684892230.893469965755389
300.1292827097748560.2585654195497120.870717290225144
310.1491465577468010.2982931154936020.850853442253199
320.1015388256824460.2030776513648930.898461174317554
330.08083359439948120.1616671887989620.919166405600519
340.07287654856542040.1457530971308410.92712345143458
350.04618846040461930.09237692080923870.95381153959538
360.05930886445413730.1186177289082750.940691135545863
370.06195698114602140.1239139622920430.938043018853979
380.09190861179777650.1838172235955530.908091388202223
390.1074419855009820.2148839710019650.892558014499018
400.2675438106633020.5350876213266040.732456189336698
410.1756033077959520.3512066155919030.824396692204048
420.1594162245990550.3188324491981090.840583775400945
430.09051138346703890.1810227669340780.909488616532961


Meta Analysis of Goldfeld-Quandt test for Heteroskedasticity
Description# significant tests% significant testsOK/NOK
1% type I error level00OK
5% type I error level10.0370370370370370OK
10% type I error level80.296296296296296NOK

\begin{tabular}{lllllllll}
\hline
Meta Analysis of Goldfeld-Quandt test for Heteroskedasticity \tabularnewline
Description & # significant tests & % significant tests & OK/NOK \tabularnewline
1% type I error level & 0 & 0 & OK \tabularnewline
5% type I error level & 1 & 0.0370370370370370 & OK \tabularnewline
10% type I error level & 8 & 0.296296296296296 & NOK \tabularnewline
\hline
\end{tabular}
%Source: https://freestatistics.org/blog/index.php?pk=58433&T=6

[TABLE]
[ROW][C]Meta Analysis of Goldfeld-Quandt test for Heteroskedasticity[/C][/ROW]
[ROW][C]Description[/C][C]# significant tests[/C][C]% significant tests[/C][C]OK/NOK[/C][/ROW]
[ROW][C]1% type I error level[/C][C]0[/C][C]0[/C][C]OK[/C][/ROW]
[ROW][C]5% type I error level[/C][C]1[/C][C]0.0370370370370370[/C][C]OK[/C][/ROW]
[ROW][C]10% type I error level[/C][C]8[/C][C]0.296296296296296[/C][C]NOK[/C][/ROW]
[/TABLE]
Source: https://freestatistics.org/blog/index.php?pk=58433&T=6

Globally Unique Identifier (entire table): ba.freestatistics.org/blog/index.php?pk=58433&T=6

As an alternative you can also use a QR Code:  

The GUIDs for individual cells are displayed in the table below:

Meta Analysis of Goldfeld-Quandt test for Heteroskedasticity
Description# significant tests% significant testsOK/NOK
1% type I error level00OK
5% type I error level10.0370370370370370OK
10% type I error level80.296296296296296NOK


Parameters (Session):
par1 = 1 ; par2 = Include Monthly Dummies ; par3 = Linear Trend ;
Parameters (R input):
par1 = 1 ; par2 = Include Monthly Dummies ; par3 = Linear Trend ;
R code (references can be found in the software module):
library(lattice)
library(lmtest)
n25 <- 25 #minimum number of obs. for Goldfeld-Quandt test
par1 <- as.numeric(par1)
x <- t(y)
k <- length(x[1,])
n <- length(x[,1])
x1 <- cbind(x[,par1], x[,1:k!=par1])
mycolnames <- c(colnames(x)[par1], colnames(x)[1:k!=par1])
colnames(x1) <- mycolnames #colnames(x)[par1]
x <- x1
if (par3 == 'First Differences'){
x2 <- array(0, dim=c(n-1,k), dimnames=list(1:(n-1), paste('(1-B)',colnames(x),sep='')))
for (i in 1:n-1) {
for (j in 1:k) {
x2[i,j] <- x[i+1,j] - x[i,j]
}
}
x <- x2
}
if (par2 == 'Include Monthly Dummies'){
x2 <- array(0, dim=c(n,11), dimnames=list(1:n, paste('M', seq(1:11), sep ='')))
for (i in 1:11){
x2[seq(i,n,12),i] <- 1
}
x <- cbind(x, x2)
}
if (par2 == 'Include Quarterly Dummies'){
x2 <- array(0, dim=c(n,3), dimnames=list(1:n, paste('Q', seq(1:3), sep ='')))
for (i in 1:3){
x2[seq(i,n,4),i] <- 1
}
x <- cbind(x, x2)
}
k <- length(x[1,])
if (par3 == 'Linear Trend'){
x <- cbind(x, c(1:n))
colnames(x)[k+1] <- 't'
}
x
k <- length(x[1,])
df <- as.data.frame(x)
(mylm <- lm(df))
(mysum <- summary(mylm))
if (n > n25) {
kp3 <- k + 3
nmkm3 <- n - k - 3
gqarr <- array(NA, dim=c(nmkm3-kp3+1,3))
numgqtests <- 0
numsignificant1 <- 0
numsignificant5 <- 0
numsignificant10 <- 0
for (mypoint in kp3:nmkm3) {
j <- 0
numgqtests <- numgqtests + 1
for (myalt in c('greater', 'two.sided', 'less')) {
j <- j + 1
gqarr[mypoint-kp3+1,j] <- gqtest(mylm, point=mypoint, alternative=myalt)$p.value
}
if (gqarr[mypoint-kp3+1,2] < 0.01) numsignificant1 <- numsignificant1 + 1
if (gqarr[mypoint-kp3+1,2] < 0.05) numsignificant5 <- numsignificant5 + 1
if (gqarr[mypoint-kp3+1,2] < 0.10) numsignificant10 <- numsignificant10 + 1
}
gqarr
}
bitmap(file='test0.png')
plot(x[,1], type='l', main='Actuals and Interpolation', ylab='value of Actuals and Interpolation (dots)', xlab='time or index')
points(x[,1]-mysum$resid)
grid()
dev.off()
bitmap(file='test1.png')
plot(mysum$resid, type='b', pch=19, main='Residuals', ylab='value of Residuals', xlab='time or index')
grid()
dev.off()
bitmap(file='test2.png')
hist(mysum$resid, main='Residual Histogram', xlab='values of Residuals')
grid()
dev.off()
bitmap(file='test3.png')
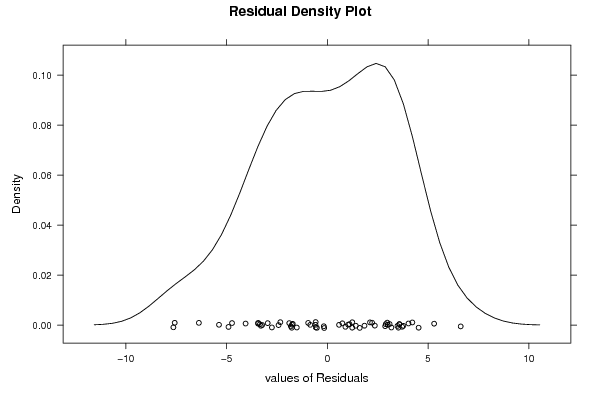
densityplot(~mysum$resid,col='black',main='Residual Density Plot', xlab='values of Residuals')
dev.off()
bitmap(file='test4.png')
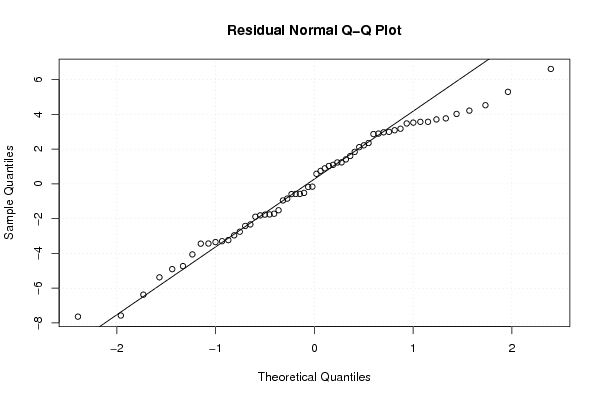
qqnorm(mysum$resid, main='Residual Normal Q-Q Plot')
qqline(mysum$resid)
grid()
dev.off()
(myerror <- as.ts(mysum$resid))
bitmap(file='test5.png')
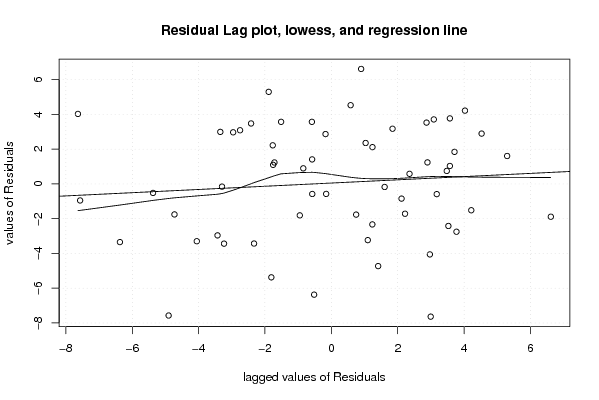
dum <- cbind(lag(myerror,k=1),myerror)
dum
dum1 <- dum[2:length(myerror),]
dum1
z <- as.data.frame(dum1)
z
plot(z,main=paste('Residual Lag plot, lowess, and regression line'), ylab='values of Residuals', xlab='lagged values of Residuals')
lines(lowess(z))
abline(lm(z))
grid()
dev.off()
bitmap(file='test6.png')
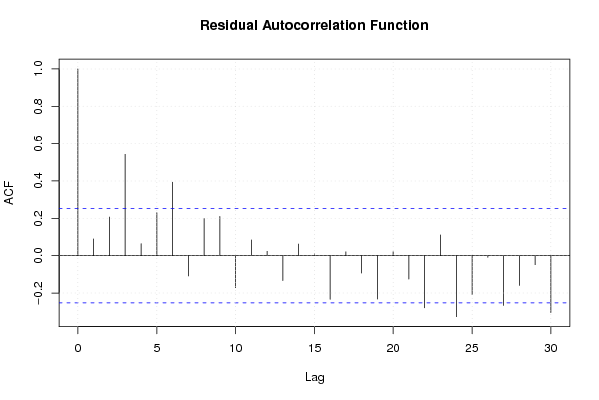
acf(mysum$resid, lag.max=length(mysum$resid)/2, main='Residual Autocorrelation Function')
grid()
dev.off()
bitmap(file='test7.png')
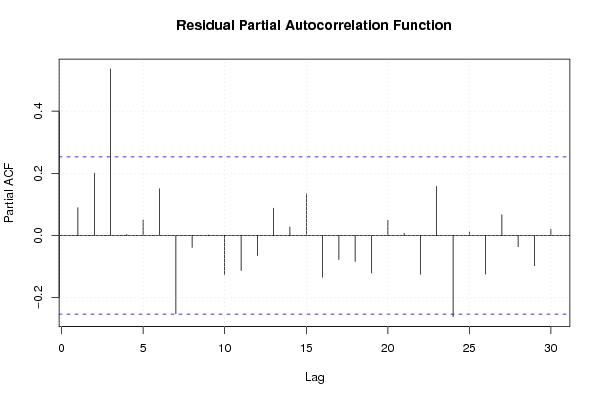
pacf(mysum$resid, lag.max=length(mysum$resid)/2, main='Residual Partial Autocorrelation Function')
grid()
dev.off()
bitmap(file='test8.png')
opar <- par(mfrow = c(2,2), oma = c(0, 0, 1.1, 0))
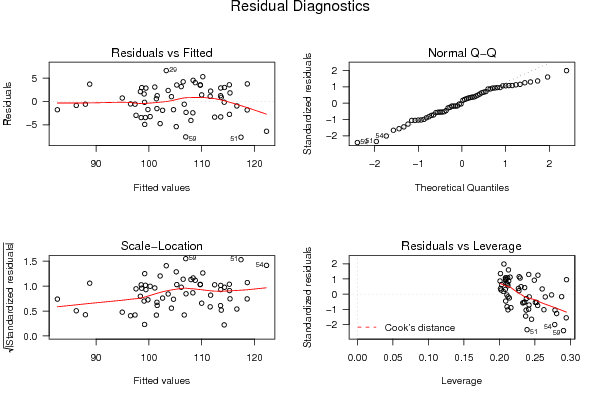
plot(mylm, las = 1, sub='Residual Diagnostics')
par(opar)
dev.off()
if (n > n25) {
bitmap(file='test9.png')
plot(kp3:nmkm3,gqarr[,2], main='Goldfeld-Quandt test',ylab='2-sided p-value',xlab='breakpoint')
grid()
dev.off()
}
load(file='createtable')
a<-table.start()
a<-table.row.start(a)
a<-table.element(a, 'Multiple Linear Regression - Estimated Regression Equation', 1, TRUE)
a<-table.row.end(a)
myeq <- colnames(x)[1]
myeq <- paste(myeq, '[t] = ', sep='')
for (i in 1:k){
if (mysum$coefficients[i,1] > 0) myeq <- paste(myeq, '+', '')
myeq <- paste(myeq, mysum$coefficients[i,1], sep=' ')
if (rownames(mysum$coefficients)[i] != '(Intercept)') {
myeq <- paste(myeq, rownames(mysum$coefficients)[i], sep='')
if (rownames(mysum$coefficients)[i] != 't') myeq <- paste(myeq, '[t]', sep='')
}
}
myeq <- paste(myeq, ' + e[t]')
a<-table.row.start(a)
a<-table.element(a, myeq)
a<-table.row.end(a)
a<-table.end(a)
table.save(a,file='mytable1.tab')
a<-table.start()
a<-table.row.start(a)
a<-table.element(a,hyperlink('ols1.htm','Multiple Linear Regression - Ordinary Least Squares',''), 6, TRUE)
a<-table.row.end(a)
a<-table.row.start(a)
a<-table.element(a,'Variable',header=TRUE)
a<-table.element(a,'Parameter',header=TRUE)
a<-table.element(a,'S.D.',header=TRUE)
a<-table.element(a,'T-STAT
H0: parameter = 0',header=TRUE)
a<-table.element(a,'2-tail p-value',header=TRUE)
a<-table.element(a,'1-tail p-value',header=TRUE)
a<-table.row.end(a)
for (i in 1:k){
a<-table.row.start(a)
a<-table.element(a,rownames(mysum$coefficients)[i],header=TRUE)
a<-table.element(a,mysum$coefficients[i,1])
a<-table.element(a, round(mysum$coefficients[i,2],6))
a<-table.element(a, round(mysum$coefficients[i,3],4))
a<-table.element(a, round(mysum$coefficients[i,4],6))
a<-table.element(a, round(mysum$coefficients[i,4]/2,6))
a<-table.row.end(a)
}
a<-table.end(a)
table.save(a,file='mytable2.tab')
a<-table.start()
a<-table.row.start(a)
a<-table.element(a, 'Multiple Linear Regression - Regression Statistics', 2, TRUE)
a<-table.row.end(a)
a<-table.row.start(a)
a<-table.element(a, 'Multiple R',1,TRUE)
a<-table.element(a, sqrt(mysum$r.squared))
a<-table.row.end(a)
a<-table.row.start(a)
a<-table.element(a, 'R-squared',1,TRUE)
a<-table.element(a, mysum$r.squared)
a<-table.row.end(a)
a<-table.row.start(a)
a<-table.element(a, 'Adjusted R-squared',1,TRUE)
a<-table.element(a, mysum$adj.r.squared)
a<-table.row.end(a)
a<-table.row.start(a)
a<-table.element(a, 'F-TEST (value)',1,TRUE)
a<-table.element(a, mysum$fstatistic[1])
a<-table.row.end(a)
a<-table.row.start(a)
a<-table.element(a, 'F-TEST (DF numerator)',1,TRUE)
a<-table.element(a, mysum$fstatistic[2])
a<-table.row.end(a)
a<-table.row.start(a)
a<-table.element(a, 'F-TEST (DF denominator)',1,TRUE)
a<-table.element(a, mysum$fstatistic[3])
a<-table.row.end(a)
a<-table.row.start(a)
a<-table.element(a, 'p-value',1,TRUE)
a<-table.element(a, 1-pf(mysum$fstatistic[1],mysum$fstatistic[2],mysum$fstatistic[3]))
a<-table.row.end(a)
a<-table.row.start(a)
a<-table.element(a, 'Multiple Linear Regression - Residual Statistics', 2, TRUE)
a<-table.row.end(a)
a<-table.row.start(a)
a<-table.element(a, 'Residual Standard Deviation',1,TRUE)
a<-table.element(a, mysum$sigma)
a<-table.row.end(a)
a<-table.row.start(a)
a<-table.element(a, 'Sum Squared Residuals',1,TRUE)
a<-table.element(a, sum(myerror*myerror))
a<-table.row.end(a)
a<-table.end(a)
table.save(a,file='mytable3.tab')
a<-table.start()
a<-table.row.start(a)
a<-table.element(a, 'Multiple Linear Regression - Actuals, Interpolation, and Residuals', 4, TRUE)
a<-table.row.end(a)
a<-table.row.start(a)
a<-table.element(a, 'Time or Index', 1, TRUE)
a<-table.element(a, 'Actuals', 1, TRUE)
a<-table.element(a, 'Interpolation
Forecast', 1, TRUE)
a<-table.element(a, 'Residuals
Prediction Error', 1, TRUE)
a<-table.row.end(a)
for (i in 1:n) {
a<-table.row.start(a)
a<-table.element(a,i, 1, TRUE)
a<-table.element(a,x[i])
a<-table.element(a,x[i]-mysum$resid[i])
a<-table.element(a,mysum$resid[i])
a<-table.row.end(a)
}
a<-table.end(a)
table.save(a,file='mytable4.tab')
if (n > n25) {
a<-table.start()
a<-table.row.start(a)
a<-table.element(a,'Goldfeld-Quandt test for Heteroskedasticity',4,TRUE)
a<-table.row.end(a)
a<-table.row.start(a)
a<-table.element(a,'p-values',header=TRUE)
a<-table.element(a,'Alternative Hypothesis',3,header=TRUE)
a<-table.row.end(a)
a<-table.row.start(a)
a<-table.element(a,'breakpoint index',header=TRUE)
a<-table.element(a,'greater',header=TRUE)
a<-table.element(a,'2-sided',header=TRUE)
a<-table.element(a,'less',header=TRUE)
a<-table.row.end(a)
for (mypoint in kp3:nmkm3) {
a<-table.row.start(a)
a<-table.element(a,mypoint,header=TRUE)
a<-table.element(a,gqarr[mypoint-kp3+1,1])
a<-table.element(a,gqarr[mypoint-kp3+1,2])
a<-table.element(a,gqarr[mypoint-kp3+1,3])
a<-table.row.end(a)
}
a<-table.end(a)
table.save(a,file='mytable5.tab')
a<-table.start()
a<-table.row.start(a)
a<-table.element(a,'Meta Analysis of Goldfeld-Quandt test for Heteroskedasticity',4,TRUE)
a<-table.row.end(a)
a<-table.row.start(a)
a<-table.element(a,'Description',header=TRUE)
a<-table.element(a,'# significant tests',header=TRUE)
a<-table.element(a,'% significant tests',header=TRUE)
a<-table.element(a,'OK/NOK',header=TRUE)
a<-table.row.end(a)
a<-table.row.start(a)
a<-table.element(a,'1% type I error level',header=TRUE)
a<-table.element(a,numsignificant1)
a<-table.element(a,numsignificant1/numgqtests)
if (numsignificant1/numgqtests < 0.01) dum <- 'OK' else dum <- 'NOK'
a<-table.element(a,dum)
a<-table.row.end(a)
a<-table.row.start(a)
a<-table.element(a,'5% type I error level',header=TRUE)
a<-table.element(a,numsignificant5)
a<-table.element(a,numsignificant5/numgqtests)
if (numsignificant5/numgqtests < 0.05) dum <- 'OK' else dum <- 'NOK'
a<-table.element(a,dum)
a<-table.row.end(a)
a<-table.row.start(a)
a<-table.element(a,'10% type I error level',header=TRUE)
a<-table.element(a,numsignificant10)
a<-table.element(a,numsignificant10/numgqtests)
if (numsignificant10/numgqtests < 0.1) dum <- 'OK' else dum <- 'NOK'
a<-table.element(a,dum)
a<-table.row.end(a)
a<-table.end(a)
table.save(a,file='mytable6.tab')
}