| Multiple Linear Regression - Estimated Regression Equation |
| TIA[t] = + 65.1843542853472 + 0.370552244553412IAidM[t] -1.44718191533665M1[t] + 0.208032101299208M2[t] + 6.42047202382795M3[t] + 1.87637352487574M4[t] + 1.38285142693650M5[t] + 8.79445734007539M6[t] -10.5523637676236M7[t] -0.419972158013988M8[t] + 7.74804980808746M9[t] + 6.93384022573633M10[t] + 3.69712861521563M11[t] + 0.0420376319371333t + e[t] |
| Multiple Linear Regression - Ordinary Least Squares | |||||
| Variable | Parameter | S.D. | T-STAT H0: parameter = 0 | 2-tail p-value | 1-tail p-value |
| (Intercept) | 65.1843542853472 | 6.186548 | 10.5365 | 0 | 0 |
| IAidM | 0.370552244553412 | 0.074382 | 4.9818 | 9e-06 | 5e-06 |
| M1 | -1.44718191533665 | 2.527046 | -0.5727 | 0.569652 | 0.284826 |
| M2 | 0.208032101299208 | 2.488868 | 0.0836 | 0.933749 | 0.466875 |
| M3 | 6.42047202382795 | 2.784987 | 2.3054 | 0.025706 | 0.012853 |
| M4 | 1.87637352487574 | 2.5993 | 0.7219 | 0.474024 | 0.237012 |
| M5 | 1.38285142693650 | 2.531074 | 0.5463 | 0.587466 | 0.293733 |
| M6 | 8.79445734007539 | 2.723066 | 3.2296 | 0.00229 | 0.001145 |
| M7 | -10.5523637676236 | 2.366246 | -4.4595 | 5.3e-05 | 2.6e-05 |
| M8 | -0.419972158013988 | 2.365497 | -0.1775 | 0.859863 | 0.429932 |
| M9 | 7.74804980808746 | 2.745065 | 2.8225 | 0.007015 | 0.003508 |
| M10 | 6.93384022573633 | 2.800864 | 2.4756 | 0.017044 | 0.008522 |
| M11 | 3.69712861521563 | 2.499458 | 1.4792 | 0.14591 | 0.072955 |
| t | 0.0420376319371333 | 0.036484 | 1.1522 | 0.255178 | 0.127589 |
| Multiple Linear Regression - Regression Statistics | |
| Multiple R | 0.9304892192588 |
| R-squared | 0.86581018715685 |
| Adjusted R-squared | 0.82788697917944 |
| F-TEST (value) | 22.8306156924424 |
| F-TEST (DF numerator) | 13 |
| F-TEST (DF denominator) | 46 |
| p-value | 8.88178419700125e-16 |
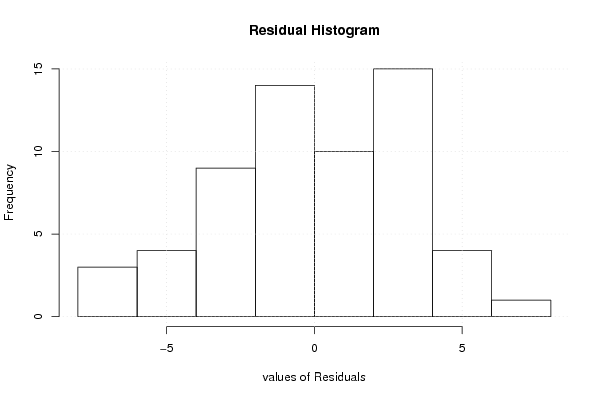
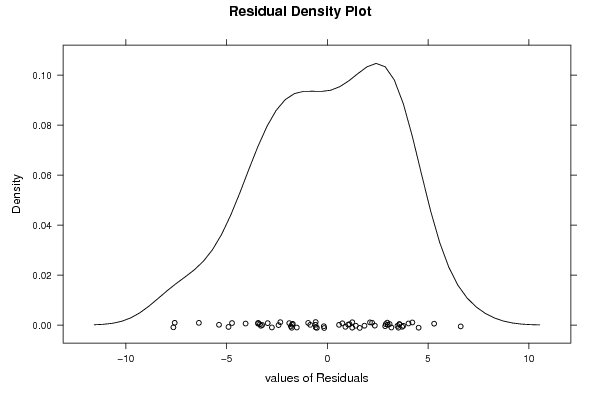
| Multiple Linear Regression - Residual Statistics | |
| Residual Standard Deviation | 3.73365659029078 |
| Sum Squared Residuals | 641.248810574203 |
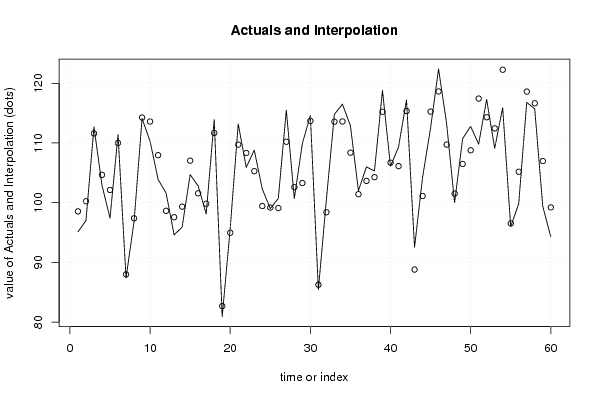
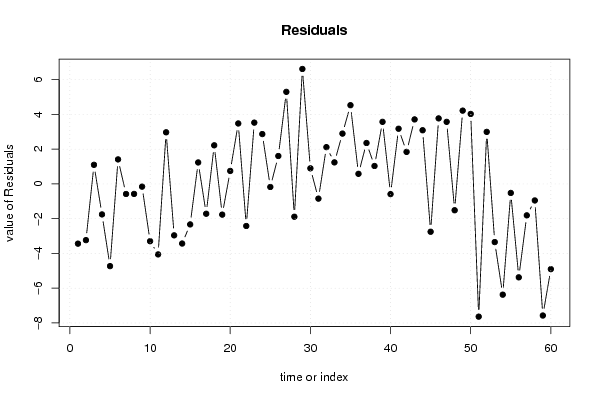
| Multiple Linear Regression - Actuals, Interpolation, and Residuals | |||
| Time or Index | Actuals | Interpolation Forecast | Residuals Prediction Error |
| 1 | 95.1 | 98.5370105410575 | -3.4370105410575 |
| 2 | 97 | 100.234262189631 | -3.23426218963068 |
| 3 | 112.7 | 111.602360718934 | 1.09763928106633 |
| 4 | 102.9 | 104.654655037866 | -1.75465503786607 |
| 5 | 97.4 | 102.128078002365 | -4.72807800236485 |
| 6 | 111.4 | 109.989329016450 | 1.41067098355037 |
| 7 | 87.4 | 87.9795141554479 | -0.579514155447851 |
| 8 | 96.8 | 97.3757836834324 | -0.57578368343245 |
| 9 | 114.1 | 114.256765804021 | -0.156765804020882 |
| 10 | 110.3 | 113.595759526973 | -3.29575952697290 |
| 11 | 103.9 | 107.955440734337 | -4.05544073433680 |
| 12 | 101.6 | 98.6309004093911 | 2.96909959060888 |
| 13 | 94.6 | 97.5592531460897 | -2.95925314608968 |
| 14 | 95.9 | 99.3306152435733 | -3.43061524357334 |
| 15 | 104.7 | 107.030246551798 | -2.33024655179752 |
| 16 | 102.8 | 101.564749848944 | 1.23525015105642 |
| 17 | 98.1 | 99.8163325270045 | -1.71633252700453 |
| 18 | 113.9 | 111.679547782266 | 2.22045221773385 |
| 19 | 80.9 | 82.6662954992049 | -1.76629549920488 |
| 20 | 95.7 | 94.9528725347061 | 0.747127465293902 |
| 21 | 113.2 | 109.72170686134 | 3.47829313865993 |
| 22 | 105.9 | 108.319596095185 | -2.41959609518527 |
| 23 | 108.8 | 105.273143014423 | 3.52685698557693 |
| 24 | 102.3 | 99.4317937882794 | 2.86820621172055 |
| 25 | 99 | 99.1753614629955 | -0.175361462995504 |
| 26 | 100.7 | 99.0939623377121 | 1.60603766228788 |
| 27 | 115.5 | 110.202674295828 | 5.29732570417232 |
| 28 | 100.7 | 102.587974574564 | -1.88797457456395 |
| 29 | 109.9 | 103.285202066677 | 6.61479793332259 |
| 30 | 114.6 | 113.703263568181 | 0.89673643181925 |
| 31 | 85.4 | 86.2463307122438 | -0.846330712243796 |
| 32 | 100.5 | 98.3846868499237 | 2.11531315007635 |
| 33 | 114.8 | 113.561128645566 | 1.23887135443362 |
| 34 | 116.5 | 113.60417163317 | 2.89582836683012 |
| 35 | 112.9 | 108.371460309543 | 4.52853969045745 |
| 36 | 102 | 101.418454349739 | 0.581545650261309 |
| 37 | 106 | 103.644722062963 | 2.35527793703739 |
| 38 | 105.3 | 104.267372202331 | 1.03262779766929 |
| 39 | 118.8 | 115.227863262625 | 3.57213673737509 |
| 40 | 106.1 | 106.686782929978 | -0.586782929977654 |
| 41 | 109.3 | 106.124132790610 | 3.17586720939048 |
| 42 | 117.2 | 115.356427109542 | 1.84357289045808 |
| 43 | 92.5 | 88.7888196405332 | 3.71118035946683 |
| 44 | 104.2 | 101.112451900490 | 3.08754809951028 |
| 45 | 112.5 | 115.251347411383 | -2.75134741138289 |
| 46 | 122.4 | 118.629360599967 | 3.77063940003289 |
| 47 | 113.3 | 109.728182055261 | 3.57181794473899 |
| 48 | 100 | 101.515298463976 | -1.51529846397553 |
| 49 | 110.7 | 106.483652786895 | 4.2163472131053 |
| 50 | 112.8 | 108.773788026753 | 4.02621197324684 |
| 51 | 109.8 | 117.436855170816 | -7.63685517081621 |
| 52 | 117.3 | 114.305837608649 | 2.99416239135124 |
| 53 | 109.1 | 112.446254613344 | -3.34625461334369 |
| 54 | 115.9 | 122.271432523562 | -6.37143252356154 |
| 55 | 96 | 96.5190399925703 | -0.519039992570301 |
| 56 | 99.8 | 105.174205031448 | -5.37420503144808 |
| 57 | 116.8 | 118.609051277690 | -1.80905127768977 |
| 58 | 115.7 | 116.651112144705 | -0.951112144704847 |
| 59 | 99.4 | 106.971773886437 | -7.57177388643657 |
| 60 | 94.3 | 99.2035529886152 | -4.90355298861521 |
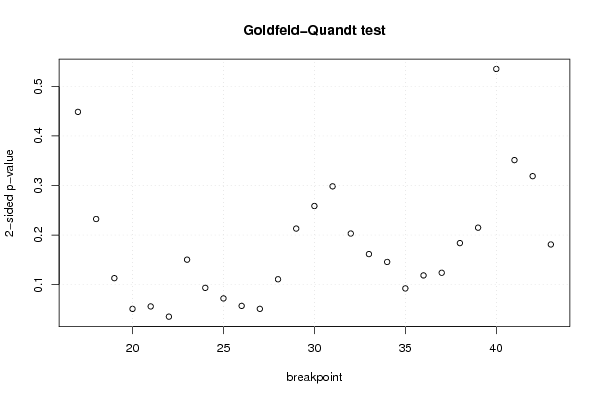
| Goldfeld-Quandt test for Heteroskedasticity | |||
| p-values | Alternative Hypothesis | ||
| breakpoint index | greater | 2-sided | less |
| 17 | 0.224211242531592 | 0.448422485063184 | 0.775788757468408 |
| 18 | 0.116183487750958 | 0.232366975501916 | 0.883816512249042 |
| 19 | 0.0565283374134823 | 0.113056674826965 | 0.943471662586518 |
| 20 | 0.0255255383285234 | 0.0510510766570468 | 0.974474461671477 |
| 21 | 0.0280107804121861 | 0.0560215608243722 | 0.971989219587814 |
| 22 | 0.0176978510607724 | 0.0353957021215447 | 0.982302148939228 |
| 23 | 0.075174654112461 | 0.150349308224922 | 0.924825345887539 |
| 24 | 0.0467506426477133 | 0.0935012852954266 | 0.953249357352287 |
| 25 | 0.036097069275655 | 0.07219413855131 | 0.963902930724345 |
| 26 | 0.0285603657120726 | 0.0571207314241452 | 0.971439634287927 |
| 27 | 0.0255791975982945 | 0.0511583951965891 | 0.974420802401705 |
| 28 | 0.0554206358997861 | 0.110841271799572 | 0.944579364100214 |
| 29 | 0.106530034244611 | 0.213060068489223 | 0.893469965755389 |
| 30 | 0.129282709774856 | 0.258565419549712 | 0.870717290225144 |
| 31 | 0.149146557746801 | 0.298293115493602 | 0.850853442253199 |
| 32 | 0.101538825682446 | 0.203077651364893 | 0.898461174317554 |
| 33 | 0.0808335943994812 | 0.161667188798962 | 0.919166405600519 |
| 34 | 0.0728765485654204 | 0.145753097130841 | 0.92712345143458 |
| 35 | 0.0461884604046193 | 0.0923769208092387 | 0.95381153959538 |
| 36 | 0.0593088644541373 | 0.118617728908275 | 0.940691135545863 |
| 37 | 0.0619569811460214 | 0.123913962292043 | 0.938043018853979 |
| 38 | 0.0919086117977765 | 0.183817223595553 | 0.908091388202223 |
| 39 | 0.107441985500982 | 0.214883971001965 | 0.892558014499018 |
| 40 | 0.267543810663302 | 0.535087621326604 | 0.732456189336698 |
| 41 | 0.175603307795952 | 0.351206615591903 | 0.824396692204048 |
| 42 | 0.159416224599055 | 0.318832449198109 | 0.840583775400945 |
| 43 | 0.0905113834670389 | 0.181022766934078 | 0.909488616532961 |
| Meta Analysis of Goldfeld-Quandt test for Heteroskedasticity | |||
| Description | # significant tests | % significant tests | OK/NOK |
| 1% type I error level | 0 | 0 | OK |
| 5% type I error level | 1 | 0.0370370370370370 | OK |
| 10% type I error level | 8 | 0.296296296296296 | NOK |