| Multiple Linear Regression - Estimated Regression Equation |
| wkl[t] = + 38.5210955524794 -0.00152089568579747bvg[t] + 1.09898403346457Y1[t] -0.082394676964828Y2[t] + 0.409148238270283Y3[t] -0.483746709978272Y4[t] -7.65892149435435M1[t] -15.0130071036027M2[t] -11.2938298789452M3[t] -12.1334166166230M4[t] -4.62991986405527M5[t] + 13.4100542052650M6[t] -6.78455588173178M7[t] -18.0900002095661M8[t] -23.8068515987059M9[t] -12.9528577185224M10[t] + 2.41394734964293M11[t] -0.0688079449944023t + e[t] |
| Multiple Linear Regression - Ordinary Least Squares | |||||
| Variable | Parameter | S.D. | T-STAT H0: parameter = 0 | 2-tail p-value | 1-tail p-value |
| (Intercept) | 38.5210955524794 | 22.308104 | 1.7268 | 0.092122 | 0.046061 |
| bvg | -0.00152089568579747 | 0.002951 | -0.5154 | 0.60919 | 0.304595 |
| Y1 | 1.09898403346457 | 0.143791 | 7.643 | 0 | 0 |
| Y2 | -0.082394676964828 | 0.22076 | -0.3732 | 0.710998 | 0.355499 |
| Y3 | 0.409148238270283 | 0.226494 | 1.8064 | 0.07857 | 0.039285 |
| Y4 | -0.483746709978272 | 0.157295 | -3.0754 | 0.00383 | 0.001915 |
| M1 | -7.65892149435435 | 3.784777 | -2.0236 | 0.049901 | 0.02495 |
| M2 | -15.0130071036027 | 4.295187 | -3.4953 | 0.001196 | 0.000598 |
| M3 | -11.2938298789452 | 4.014019 | -2.8136 | 0.007636 | 0.003818 |
| M4 | -12.1334166166230 | 3.601294 | -3.3692 | 0.001709 | 0.000854 |
| M5 | -4.62991986405527 | 3.654506 | -1.2669 | 0.212702 | 0.106351 |
| M6 | 13.4100542052650 | 3.392235 | 3.9532 | 0.000315 | 0.000157 |
| M7 | -6.78455588173178 | 3.848867 | -1.7627 | 0.08578 | 0.04289 |
| M8 | -18.0900002095661 | 5.252776 | -3.4439 | 0.001384 | 0.000692 |
| M9 | -23.8068515987059 | 5.934347 | -4.0117 | 0.000264 | 0.000132 |
| M10 | -12.9528577185224 | 4.268398 | -3.0346 | 0.004274 | 0.002137 |
| M11 | 2.41394734964293 | 3.746094 | 0.6444 | 0.523095 | 0.261547 |
| t | -0.0688079449944023 | 0.075876 | -0.9068 | 0.370056 | 0.185028 |
| Multiple Linear Regression - Regression Statistics | |
| Multiple R | 0.988899182665083 |
| R-squared | 0.97792159347567 |
| Adjusted R-squared | 0.968297672683013 |
| F-TEST (value) | 101.613636951569 |
| F-TEST (DF numerator) | 17 |
| F-TEST (DF denominator) | 39 |
| p-value | 0 |
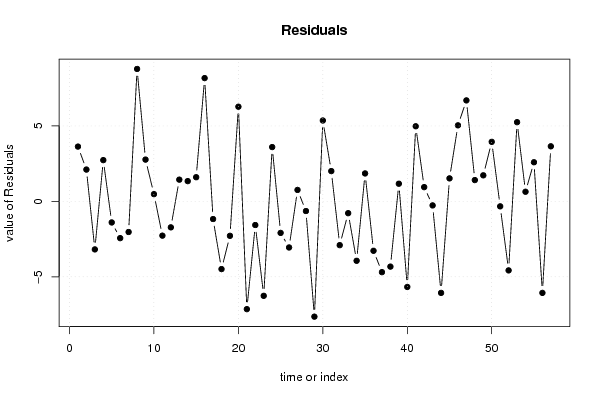
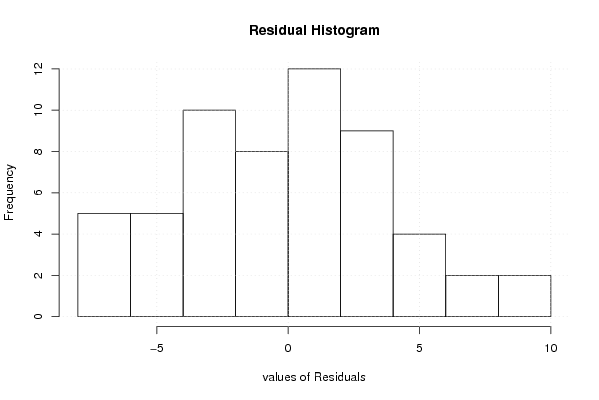
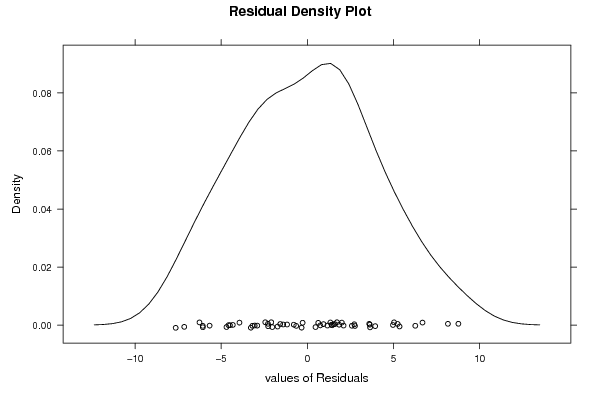
| Multiple Linear Regression - Residual Statistics | |
| Residual Standard Deviation | 4.71069167719526 |
| Sum Squared Residuals | 865.434027026272 |
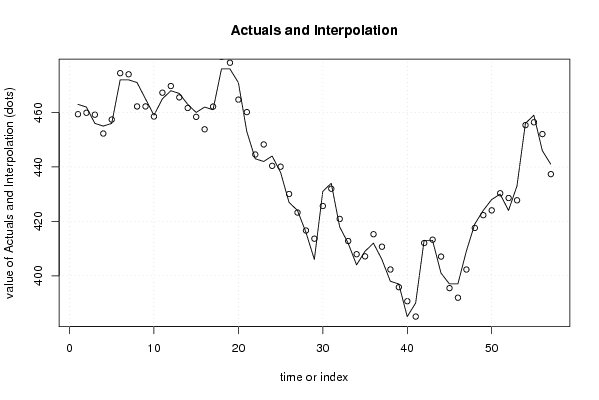
| Multiple Linear Regression - Actuals, Interpolation, and Residuals | |||
| Time or Index | Actuals | Interpolation Forecast | Residuals Prediction Error |
| 1 | 463 | 459.371873836721 | 3.62812616327886 |
| 2 | 462 | 459.895290112043 | 2.10470988795653 |
| 3 | 456 | 459.187772888032 | -3.18777288803227 |
| 4 | 455 | 452.269818855432 | 2.7301811445679 |
| 5 | 456 | 457.400820147714 | -1.40082014771398 |
| 6 | 472 | 474.440778964047 | -2.44077896404659 |
| 7 | 472 | 474.033641304716 | -2.03364130471551 |
| 8 | 471 | 462.226364670269 | 8.7736353297309 |
| 9 | 465 | 462.233234553776 | 2.76676544622374 |
| 10 | 459 | 458.523620295763 | 0.476379704237281 |
| 11 | 465 | 467.27491064952 | -2.27491064952004 |
| 12 | 468 | 469.725256519834 | -1.72525651983418 |
| 13 | 467 | 465.564048251984 | 1.43595174801603 |
| 14 | 463 | 461.661107016361 | 1.33889298363914 |
| 15 | 460 | 458.402757404164 | 1.59724259583569 |
| 16 | 462 | 453.833127951759 | 8.16687204824076 |
| 17 | 461 | 462.175336005547 | -1.1753360055466 |
| 18 | 476 | 480.492162009258 | -4.49216200925834 |
| 19 | 476 | 478.286737171548 | -2.28673717154764 |
| 20 | 471 | 464.728815669415 | 6.27118433058544 |
| 21 | 453 | 460.146772131966 | -7.14677213196571 |
| 22 | 443 | 444.572174944957 | -1.57217494495710 |
| 23 | 442 | 448.262942482809 | -6.26294248280918 |
| 24 | 444 | 440.40408382543 | 3.59591617456951 |
| 25 | 438 | 440.092821851425 | -2.09282185142451 |
| 26 | 427 | 430.058187902105 | -3.05818790210455 |
| 27 | 424 | 423.24428284947 | 0.755717150529872 |
| 28 | 416 | 416.644566318303 | -0.644566318302859 |
| 29 | 406 | 413.644404556278 | -7.64440455627754 |
| 30 | 431 | 425.643292705955 | 5.35670729404479 |
| 31 | 434 | 431.996398907092 | 2.00360109290750 |
| 32 | 418 | 420.906172282792 | -2.90617228279153 |
| 33 | 412 | 412.78617091795 | -0.786170917950232 |
| 34 | 404 | 407.940565399571 | -3.94056539957111 |
| 35 | 409 | 407.151809083509 | 1.8481909164906 |
| 36 | 412 | 415.279301153185 | -3.27930115318458 |
| 37 | 406 | 410.693974701347 | -4.69397470134713 |
| 38 | 398 | 402.32745703837 | -4.32745703837046 |
| 39 | 397 | 395.832006340761 | 1.16799365923901 |
| 40 | 385 | 390.674992804677 | -5.67499280467734 |
| 41 | 390 | 385.025953328284 | 4.9740466717162 |
| 42 | 413 | 412.059481687304 | 0.940518312696215 |
| 43 | 413 | 413.271941748622 | -0.271941748622342 |
| 44 | 401 | 407.070052338508 | -6.07005233850753 |
| 45 | 397 | 395.479130724374 | 1.52086927562637 |
| 46 | 397 | 391.963639359709 | 5.03636064029093 |
| 47 | 409 | 402.310337784161 | 6.68966221583862 |
| 48 | 419 | 417.591358501551 | 1.40864149844925 |
| 49 | 424 | 422.277281358523 | 1.72271864147675 |
| 50 | 428 | 424.057957931121 | 3.94204206887936 |
| 51 | 430 | 430.333180517572 | -0.333180517572299 |
| 52 | 424 | 428.577494069828 | -4.57749406982845 |
| 53 | 433 | 427.753485962178 | 5.24651403782191 |
| 54 | 456 | 455.364284633436 | 0.635715366563918 |
| 55 | 459 | 456.411280868022 | 2.588719131978 |
| 56 | 446 | 452.068595039017 | -6.06859503901729 |
| 57 | 441 | 437.354691671934 | 3.64530832806583 |
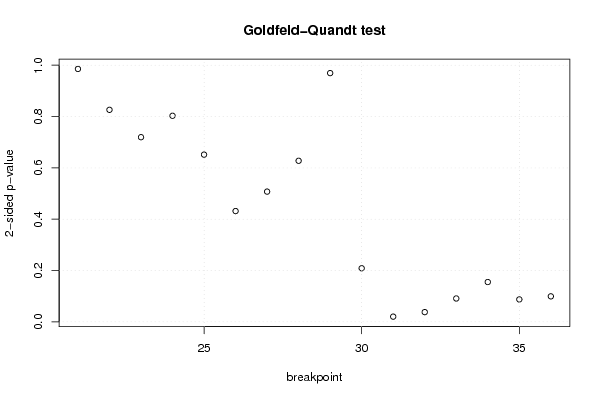
| Goldfeld-Quandt test for Heteroskedasticity | |||
| p-values | Alternative Hypothesis | ||
| breakpoint index | greater | 2-sided | less |
| 21 | 0.50727684712697 | 0.98544630574606 | 0.49272315287303 |
| 22 | 0.413092348982315 | 0.82618469796463 | 0.586907651017685 |
| 23 | 0.359773217904678 | 0.719546435809355 | 0.640226782095322 |
| 24 | 0.401480106737047 | 0.802960213474095 | 0.598519893262953 |
| 25 | 0.325812235902037 | 0.651624471804075 | 0.674187764097963 |
| 26 | 0.215854766906257 | 0.431709533812513 | 0.784145233093743 |
| 27 | 0.253765663876886 | 0.507531327753773 | 0.746234336123114 |
| 28 | 0.313846253597398 | 0.627692507194797 | 0.686153746402602 |
| 29 | 0.484639349196203 | 0.969278698392407 | 0.515360650803797 |
| 30 | 0.89555664116932 | 0.208886717661359 | 0.104443358830679 |
| 31 | 0.989837169542928 | 0.0203256609141437 | 0.0101628304570718 |
| 32 | 0.980980072592555 | 0.0380398548148891 | 0.0190199274074445 |
| 33 | 0.954443894920125 | 0.0911122101597489 | 0.0455561050798744 |
| 34 | 0.92238308259875 | 0.155233834802499 | 0.0776169174012495 |
| 35 | 0.956259521417266 | 0.0874809571654685 | 0.0437404785827342 |
| 36 | 0.950274280638667 | 0.099451438722667 | 0.0497257193613335 |
| Meta Analysis of Goldfeld-Quandt test for Heteroskedasticity | |||
| Description | # significant tests | % significant tests | OK/NOK |
| 1% type I error level | 0 | 0 | OK |
| 5% type I error level | 2 | 0.125 | NOK |
| 10% type I error level | 5 | 0.3125 | NOK |