| Multiple Linear Regression - Estimated Regression Equation |
| dzcg[t] = + 86.4486262206775 + 0.820422117853948totid[t] -0.834444510665815ndzcg[t] + 0.270023243827998`indc `[t] + 0.436858127219093M1[t] -0.0399988870685178M2[t] -2.40677166640325M3[t] -2.95706963841343M4[t] -4.03836102042737M5[t] -2.09097820123675M6[t] -3.00419908854042M7[t] -1.78500969314317M8[t] + 0.899750191024355M9[t] -0.347689294709870M10[t] -1.28273233446154M11[t] + e[t] |
| Multiple Linear Regression - Ordinary Least Squares | |||||
| Variable | Parameter | S.D. | T-STAT H0: parameter = 0 | 2-tail p-value | 1-tail p-value |
| (Intercept) | 86.4486262206775 | 16.948443 | 5.1007 | 6e-06 | 3e-06 |
| totid | 0.820422117853948 | 0.168203 | 4.8776 | 1.3e-05 | 7e-06 |
| ndzcg | -0.834444510665815 | 0.205969 | -4.0513 | 0.000194 | 9.7e-05 |
| `indc ` | 0.270023243827998 | 0.088286 | 3.0585 | 0.003702 | 0.001851 |
| M1 | 0.436858127219093 | 2.32707 | 0.1877 | 0.851915 | 0.425957 |
| M2 | -0.0399988870685178 | 2.445107 | -0.0164 | 0.987019 | 0.493509 |
| M3 | -2.40677166640325 | 2.447676 | -0.9833 | 0.330609 | 0.165305 |
| M4 | -2.95706963841343 | 2.431048 | -1.2164 | 0.230046 | 0.115023 |
| M5 | -4.03836102042737 | 2.454271 | -1.6454 | 0.106696 | 0.053348 |
| M6 | -2.09097820123675 | 2.43641 | -0.8582 | 0.39522 | 0.19761 |
| M7 | -3.00419908854042 | 2.451304 | -1.2256 | 0.226605 | 0.113303 |
| M8 | -1.78500969314317 | 2.434525 | -0.7332 | 0.467153 | 0.233576 |
| M9 | 0.899750191024355 | 2.437178 | 0.3692 | 0.71369 | 0.356845 |
| M10 | -0.347689294709870 | 2.438123 | -0.1426 | 0.887225 | 0.443612 |
| M11 | -1.28273233446154 | 2.430166 | -0.5278 | 0.600149 | 0.300075 |
| Multiple Linear Regression - Regression Statistics | |
| Multiple R | 0.806556871701163 |
| R-squared | 0.650533987288366 |
| Adjusted R-squared | 0.544174766028304 |
| F-TEST (value) | 6.11638539264709 |
| F-TEST (DF numerator) | 14 |
| F-TEST (DF denominator) | 46 |
| p-value | 1.30419228838718e-06 |
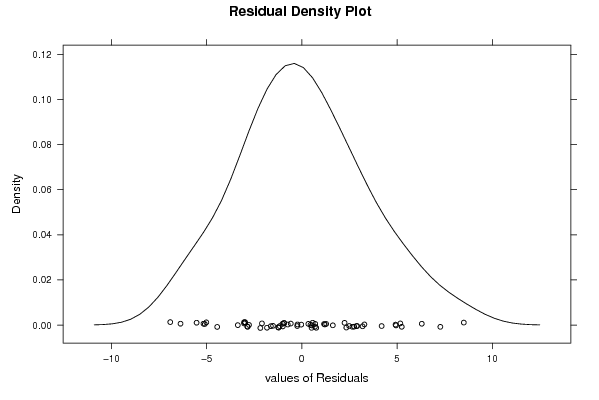
| Multiple Linear Regression - Residual Statistics | |
| Residual Standard Deviation | 3.84022541403812 |
| Sum Squared Residuals | 678.377236608714 |
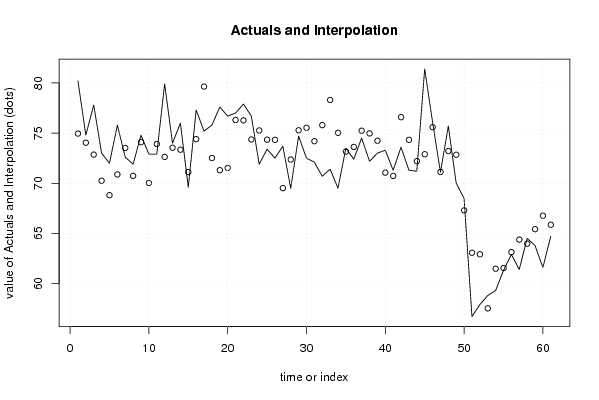
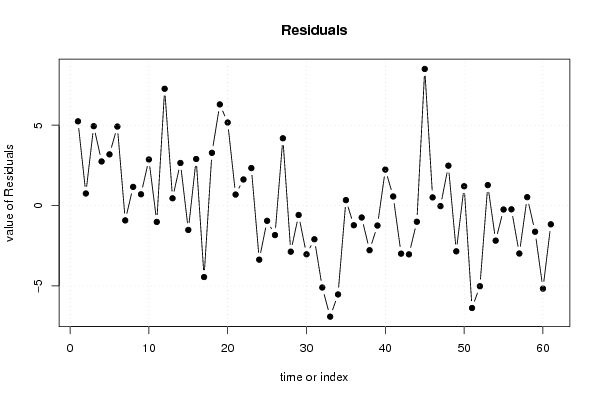
| Multiple Linear Regression - Actuals, Interpolation, and Residuals | |||
| Time or Index | Actuals | Interpolation Forecast | Residuals Prediction Error |
| 1 | 80.2 | 74.9562892573062 | 5.24371074269383 |
| 2 | 74.8 | 74.046726814901 | 0.753273185099047 |
| 3 | 77.8 | 72.8594528054395 | 4.94054719456051 |
| 4 | 73 | 70.2538928209509 | 2.74610717904912 |
| 5 | 72 | 68.8130466162076 | 3.18695338379240 |
| 6 | 75.8 | 70.8817928877485 | 4.9182071122515 |
| 7 | 72.6 | 73.5214517922032 | -0.921451792203235 |
| 8 | 71.9 | 70.7356686257313 | 1.16433137426871 |
| 9 | 74.8 | 74.0971098875952 | 0.702890112404835 |
| 10 | 72.9 | 70.0307881762526 | 2.8692118237474 |
| 11 | 72.9 | 73.9159504891177 | -1.01595048911766 |
| 12 | 79.9 | 72.6306121218806 | 7.26938787811938 |
| 13 | 74 | 73.5460299434781 | 0.453970056521884 |
| 14 | 76 | 73.3468026215177 | 2.65319737848227 |
| 15 | 69.6 | 71.1148789759435 | -1.51487897594348 |
| 16 | 77.3 | 74.4004554372002 | 2.89954456279978 |
| 17 | 75.2 | 79.6454591634618 | -4.44545916346178 |
| 18 | 75.8 | 72.5175648777333 | 3.28243512226671 |
| 19 | 77.6 | 71.3042784696034 | 6.29572153039659 |
| 20 | 76.7 | 71.5311431399821 | 5.16885686001792 |
| 21 | 77 | 76.3127540443536 | 0.687245955646354 |
| 22 | 77.9 | 76.2749141461826 | 1.62508585381746 |
| 23 | 76.7 | 74.3665824792556 | 2.33341752074438 |
| 24 | 71.9 | 75.2643440618515 | -3.36434406185155 |
| 25 | 73.4 | 74.3473836906399 | -0.9473836906399 |
| 26 | 72.5 | 74.3332743814681 | -1.83327438146811 |
| 27 | 73.7 | 69.5124543399012 | 4.18754566009878 |
| 28 | 69.5 | 72.3683415866974 | -2.86834158669735 |
| 29 | 74.7 | 75.2840875015755 | -0.584087501575478 |
| 30 | 72.5 | 75.5302127145839 | -3.03021271458391 |
| 31 | 72.1 | 74.1964283819833 | -2.09642838198331 |
| 32 | 70.7 | 75.7963818114026 | -5.0963818114026 |
| 33 | 71.4 | 78.3099875349018 | -6.90998753490176 |
| 34 | 69.5 | 75.027512638719 | -5.52751263871902 |
| 35 | 73.5 | 73.1590974644503 | 0.340902535549746 |
| 36 | 72.4 | 73.622809920339 | -1.22280992033903 |
| 37 | 74.5 | 75.2405690567126 | -0.740569056712586 |
| 38 | 72.2 | 74.9764874836678 | -2.77648748366777 |
| 39 | 73 | 74.2416673336438 | -1.24166733364381 |
| 40 | 73.3 | 71.0596026401883 | 2.24039735981165 |
| 41 | 71.3 | 70.7315790849344 | 0.568420915065627 |
| 42 | 73.6 | 76.5903455234814 | -2.99034552348141 |
| 43 | 71.3 | 74.3340781541353 | -3.0340781541353 |
| 44 | 71.2 | 72.2048444170411 | -1.00484441704112 |
| 45 | 81.4 | 72.8980607361489 | 8.50193926385113 |
| 46 | 76.1 | 75.5906224798161 | 0.50937752018388 |
| 47 | 71.1 | 71.1320881325193 | -0.0320881325193157 |
| 48 | 75.7 | 73.2164182220861 | 2.48358177791392 |
| 49 | 70 | 72.8450284871207 | -2.84502848712074 |
| 50 | 68.5 | 67.2967086984454 | 1.20329130155456 |
| 51 | 56.7 | 63.071546545072 | -6.37154654507201 |
| 52 | 57.9 | 62.9177075149632 | -5.01770751496319 |
| 53 | 58.8 | 57.5258276338208 | 1.27417236617924 |
| 54 | 59.3 | 61.4800839964529 | -2.18008399645289 |
| 55 | 61.3 | 61.5437632020747 | -0.243763202074747 |
| 56 | 62.9 | 63.1319620058429 | -0.231962005842906 |
| 57 | 61.4 | 64.3820877970006 | -2.98208779700056 |
| 58 | 64.5 | 63.9761625590297 | 0.523837440970271 |
| 59 | 63.8 | 65.4262814346571 | -1.62628143465715 |
| 60 | 61.6 | 66.7658156738427 | -5.16581567384272 |
| 61 | 64.7 | 65.8646995647425 | -1.16469956474248 |
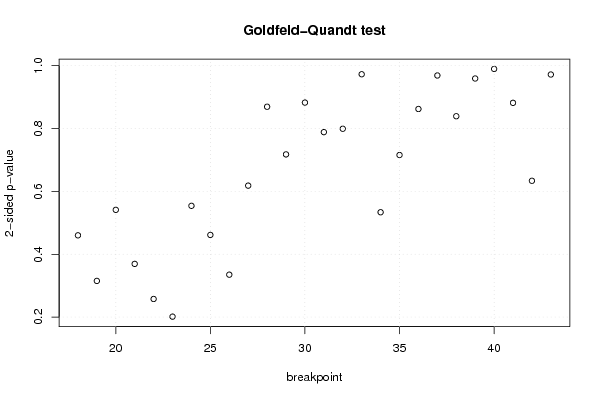
| Goldfeld-Quandt test for Heteroskedasticity | |||
| p-values | Alternative Hypothesis | ||
| breakpoint index | greater | 2-sided | less |
| 18 | 0.230096815355985 | 0.46019363071197 | 0.769903184644015 |
| 19 | 0.157575342339981 | 0.315150684679962 | 0.842424657660019 |
| 20 | 0.270647713129717 | 0.541295426259434 | 0.729352286870283 |
| 21 | 0.184665272659414 | 0.369330545318827 | 0.815334727340586 |
| 22 | 0.128853553723435 | 0.257707107446869 | 0.871146446276565 |
| 23 | 0.100726002065253 | 0.201452004130506 | 0.899273997934747 |
| 24 | 0.277037468023952 | 0.554074936047905 | 0.722962531976048 |
| 25 | 0.230754896273267 | 0.461509792546535 | 0.769245103726732 |
| 26 | 0.167479154376447 | 0.334958308752894 | 0.832520845623553 |
| 27 | 0.309145885572048 | 0.618291771144097 | 0.690854114427952 |
| 28 | 0.434669578491932 | 0.869339156983864 | 0.565330421508068 |
| 29 | 0.358841775729175 | 0.71768355145835 | 0.641158224270825 |
| 30 | 0.441266473269945 | 0.88253294653989 | 0.558733526730055 |
| 31 | 0.3942774109774 | 0.7885548219548 | 0.6057225890226 |
| 32 | 0.399634997313609 | 0.799269994627217 | 0.600365002686391 |
| 33 | 0.486343992348948 | 0.972687984697896 | 0.513656007651052 |
| 34 | 0.733185329410597 | 0.533629341178806 | 0.266814670589403 |
| 35 | 0.64216584490751 | 0.71566831018498 | 0.35783415509249 |
| 36 | 0.568922348132738 | 0.862155303734524 | 0.431077651867262 |
| 37 | 0.48439982387301 | 0.96879964774602 | 0.51560017612699 |
| 38 | 0.419566280061255 | 0.83913256012251 | 0.580433719938745 |
| 39 | 0.479594851460572 | 0.959189702921145 | 0.520405148539428 |
| 40 | 0.505214738519704 | 0.989570522960593 | 0.494785261480296 |
| 41 | 0.440849078523938 | 0.881698157047875 | 0.559150921476062 |
| 42 | 0.316864428818821 | 0.633728857637642 | 0.683135571181179 |
| 43 | 0.514080667111528 | 0.971838665776944 | 0.485919332888472 |
| Meta Analysis of Goldfeld-Quandt test for Heteroskedasticity | |||
| Description | # significant tests | % significant tests | OK/NOK |
| 1% type I error level | 0 | 0 | OK |
| 5% type I error level | 0 | 0 | OK |
| 10% type I error level | 0 | 0 | OK |