| Multiple Linear Regression - Estimated Regression Equation |
| X[t] = + 2.91905237632963 -0.00453242253479385Y[t] + 1.41540921091640Y2[t] -0.690016330933515Y3[t] + 0.137104573754478M1[t] + 0.0607064192686293M2[t] -0.137858049153742M3[t] -0.124199435265789M4[t] -0.161449243535398M5[t] -0.126372602670887M6[t] -0.0213838761519172M7[t] + 0.575373145223861M8[t] -0.398167433129223M9[t] -0.080157117956941M10[t] -0.105845708602752M11[t] -0.00769637743671768t + e[t] |
| Multiple Linear Regression - Ordinary Least Squares | |||||
| Variable | Parameter | S.D. | T-STAT H0: parameter = 0 | 2-tail p-value | 1-tail p-value |
| (Intercept) | 2.91905237632963 | 1.021101 | 2.8587 | 0.006534 | 0.003267 |
| Y | -0.00453242253479385 | 0.007543 | -0.6009 | 0.551062 | 0.275531 |
| Y2 | 1.41540921091640 | 0.113061 | 12.519 | 0 | 0 |
| Y3 | -0.690016330933515 | 0.112329 | -6.1428 | 0 | 0 |
| M1 | 0.137104573754478 | 0.146224 | 0.9376 | 0.353668 | 0.176834 |
| M2 | 0.0607064192686293 | 0.150161 | 0.4043 | 0.688015 | 0.344007 |
| M3 | -0.137858049153742 | 0.147784 | -0.9328 | 0.356114 | 0.178057 |
| M4 | -0.124199435265789 | 0.133191 | -0.9325 | 0.356289 | 0.178144 |
| M5 | -0.161449243535398 | 0.132865 | -1.2151 | 0.230945 | 0.115473 |
| M6 | -0.126372602670887 | 0.137069 | -0.922 | 0.361691 | 0.180845 |
| M7 | -0.0213838761519172 | 0.138145 | -0.1548 | 0.877709 | 0.438854 |
| M8 | 0.575373145223861 | 0.217551 | 2.6448 | 0.011367 | 0.005684 |
| M9 | -0.398167433129223 | 0.192458 | -2.0689 | 0.044605 | 0.022303 |
| M10 | -0.080157117956941 | 0.137849 | -0.5815 | 0.56395 | 0.281975 |
| M11 | -0.105845708602752 | 0.133625 | -0.7921 | 0.432643 | 0.216322 |
| t | -0.00769637743671768 | 0.002721 | -2.8281 | 0.007084 | 0.003542 |
| Multiple Linear Regression - Regression Statistics | |
| Multiple R | 0.972918106226033 |
| R-squared | 0.946569641422451 |
| Adjusted R-squared | 0.927931144244237 |
| F-TEST (value) | 50.7857276459411 |
| F-TEST (DF numerator) | 15 |
| F-TEST (DF denominator) | 43 |
| p-value | 0 |
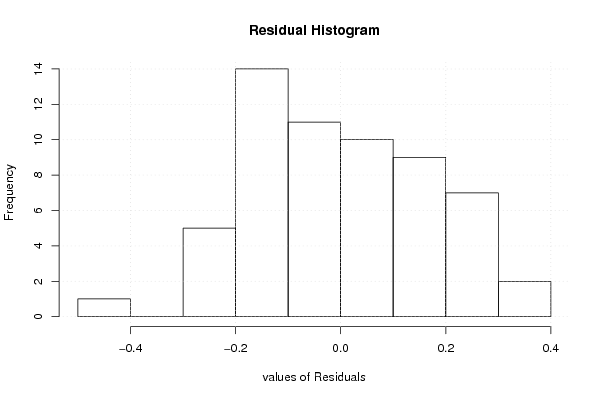
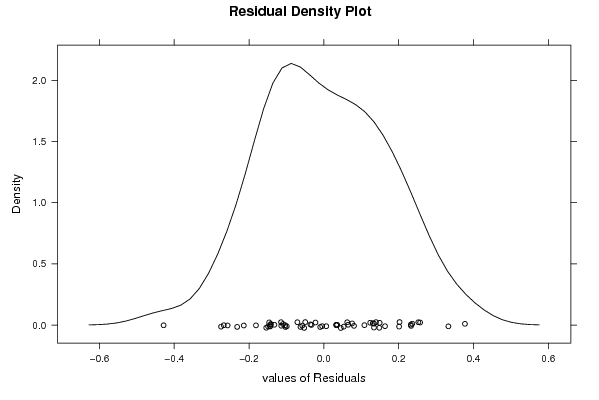
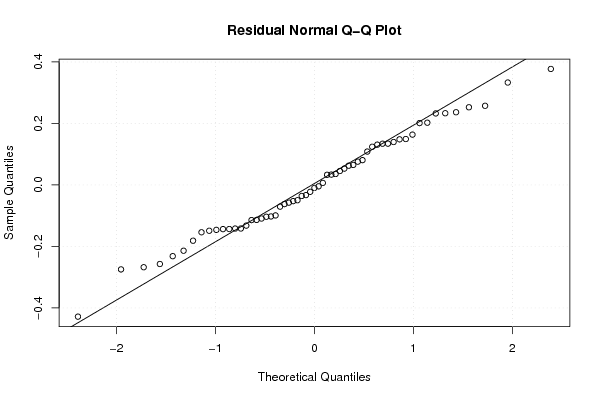
| Multiple Linear Regression - Residual Statistics | |
| Residual Standard Deviation | 0.193728062396361 |
| Sum Squared Residuals | 1.61381417287347 |
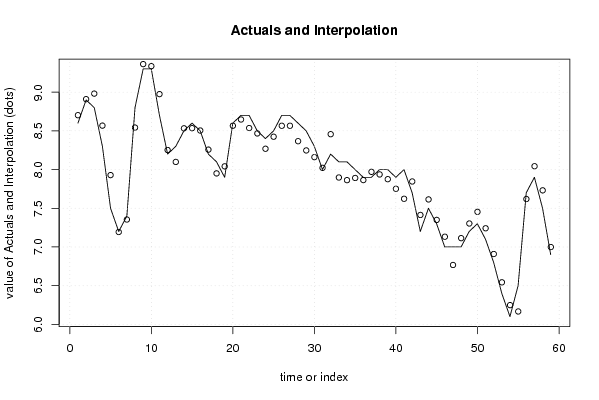
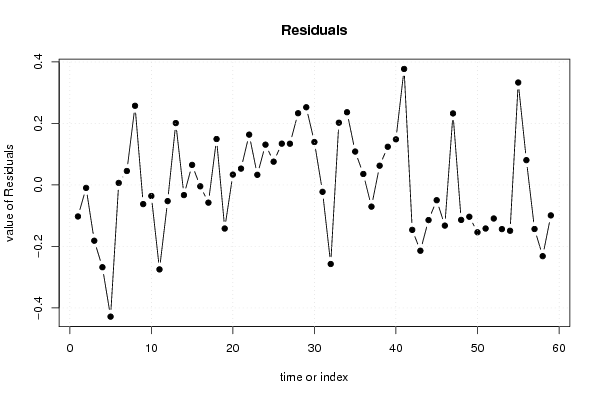
| Multiple Linear Regression - Actuals, Interpolation, and Residuals | |||
| Time or Index | Actuals | Interpolation Forecast | Residuals Prediction Error |
| 1 | 8.6 | 8.70256902088208 | -0.102569020882076 |
| 2 | 8.9 | 8.90971469170541 | -0.00971469170541226 |
| 3 | 8.8 | 8.98146174011844 | -0.181461740118434 |
| 4 | 8.3 | 8.56771912240171 | -0.267719122401711 |
| 5 | 7.5 | 7.92848770517152 | -0.428487705171517 |
| 6 | 7.2 | 7.19347708927432 | 0.00652291072568439 |
| 7 | 7.4 | 7.35470582434135 | 0.0452941756586532 |
| 8 | 8.8 | 8.5426313505788 | 0.257368649421206 |
| 9 | 9.3 | 9.36235925205818 | -0.0623592520581825 |
| 10 | 9.3 | 9.33594402209309 | -0.0359440220930902 |
| 11 | 8.7 | 8.97477409417602 | -0.274774094176023 |
| 12 | 8.2 | 8.2526854030149 | -0.0526854030148971 |
| 13 | 8.3 | 8.0988233642646 | 0.201176635735407 |
| 14 | 8.5 | 8.53300487664398 | -0.0330048766439838 |
| 15 | 8.6 | 8.53493209057959 | 0.0650679094204113 |
| 16 | 8.5 | 8.50454666362957 | -0.00454666362957453 |
| 17 | 8.2 | 8.25766952655437 | -0.0576695265543664 |
| 18 | 8.1 | 7.95073104571412 | 0.149268954285878 |
| 19 | 7.9 | 8.04187509693505 | -0.141875096935046 |
| 20 | 8.6 | 8.56642547543238 | 0.0335745245676221 |
| 21 | 8.7 | 8.6468983799558 | 0.0531016200441935 |
| 22 | 8.7 | 8.53642441277066 | 0.163575587229343 |
| 23 | 8.5 | 8.46712449609877 | 0.0328755039012277 |
| 24 | 8.4 | 8.26904795973063 | 0.130952040269375 |
| 25 | 8.5 | 8.42437924761961 | 0.0756207523803906 |
| 26 | 8.7 | 8.56578426424685 | 0.134215735753146 |
| 27 | 8.7 | 8.56589850916854 | 0.134101490831458 |
| 28 | 8.6 | 8.36677762591813 | 0.233222374081874 |
| 29 | 8.5 | 8.2473703726351 | 0.252629627364891 |
| 30 | 8.3 | 8.16051306074451 | 0.13948693925549 |
| 31 | 8 | 8.0224228148233 | -0.0224228148233045 |
| 32 | 8.2 | 8.45721069969013 | -0.257210699690129 |
| 33 | 8.1 | 7.89762090508827 | 0.202379094911727 |
| 34 | 8.1 | 7.86357701329794 | 0.236422986702057 |
| 35 | 8 | 7.89148855999962 | 0.108511440000383 |
| 36 | 7.9 | 7.86441369119927 | 0.0355863088007312 |
| 37 | 7.9 | 7.970686005148 | -0.0706860051479941 |
| 38 | 8 | 7.9374634161796 | 0.0625365838203962 |
| 39 | 8 | 7.87591618718651 | 0.124083812813491 |
| 40 | 7.9 | 7.75168908632468 | 0.148310913675323 |
| 41 | 8 | 7.62276374571859 | 0.377236254281407 |
| 42 | 7.7 | 7.84618281122004 | -0.146182811220036 |
| 43 | 7.2 | 7.41404462590915 | -0.214044625909147 |
| 44 | 7.5 | 7.61435640027947 | -0.114356400279472 |
| 45 | 7.3 | 7.34972102957426 | -0.0497210295742588 |
| 46 | 7 | 7.1323291188077 | -0.132329118807700 |
| 47 | 7 | 6.7674536705425 | 0.232546329457503 |
| 48 | 7 | 7.11385294605521 | -0.113852946055209 |
| 49 | 7.2 | 7.30354236208573 | -0.103542362085727 |
| 50 | 7.3 | 7.45403275122415 | -0.154032751224146 |
| 51 | 7.1 | 7.24179147294693 | -0.141791472946926 |
| 52 | 6.8 | 6.90926750172591 | -0.109267501725913 |
| 53 | 6.4 | 6.54370864992042 | -0.143708649920416 |
| 54 | 6.1 | 6.24909599304702 | -0.149095993047016 |
| 55 | 6.5 | 6.16695163799116 | 0.333048362008845 |
| 56 | 7.7 | 7.61937607401923 | 0.0806239259807724 |
| 57 | 7.9 | 8.04340043332348 | -0.143400433323479 |
| 58 | 7.5 | 7.73172543303061 | -0.231725433030609 |
| 59 | 6.9 | 6.9991591791831 | -0.0991591791830919 |
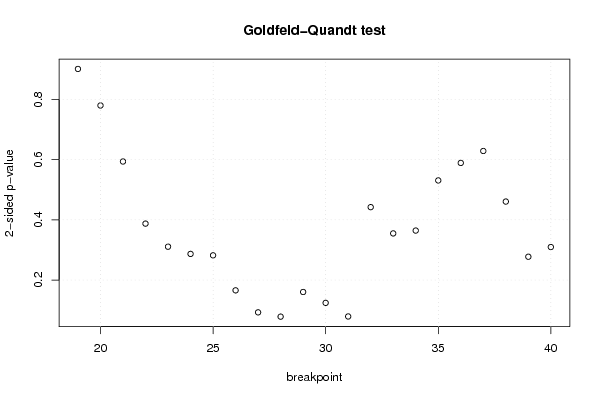
| Goldfeld-Quandt test for Heteroskedasticity | |||
| p-values | Alternative Hypothesis | ||
| breakpoint index | greater | 2-sided | less |
| 19 | 0.549529623176074 | 0.900940753647853 | 0.450470376823926 |
| 20 | 0.389849387565171 | 0.779698775130342 | 0.610150612434829 |
| 21 | 0.296836948123029 | 0.593673896246057 | 0.703163051876971 |
| 22 | 0.193698959118506 | 0.387397918237011 | 0.806301040881494 |
| 23 | 0.155426272334262 | 0.310852544668524 | 0.844573727665738 |
| 24 | 0.143456364331348 | 0.286912728662695 | 0.856543635668652 |
| 25 | 0.141087436726785 | 0.282174873453569 | 0.858912563273215 |
| 26 | 0.0829901971504919 | 0.165980394300984 | 0.917009802849508 |
| 27 | 0.0464348004442418 | 0.0928696008884837 | 0.953565199555758 |
| 28 | 0.0393116977762414 | 0.0786233955524828 | 0.960688302223759 |
| 29 | 0.0802396876416093 | 0.160479375283219 | 0.91976031235839 |
| 30 | 0.0621945143092876 | 0.124389028618575 | 0.937805485690712 |
| 31 | 0.0396156494741542 | 0.0792312989483084 | 0.960384350525846 |
| 32 | 0.221079219461420 | 0.442158438922839 | 0.77892078053858 |
| 33 | 0.177487635271593 | 0.354975270543185 | 0.822512364728407 |
| 34 | 0.182218913083658 | 0.364437826167316 | 0.817781086916342 |
| 35 | 0.265419641393698 | 0.530839282787397 | 0.734580358606302 |
| 36 | 0.294500974875637 | 0.589001949751275 | 0.705499025124363 |
| 37 | 0.314284998854232 | 0.628569997708464 | 0.685715001145768 |
| 38 | 0.230357251816582 | 0.460714503633165 | 0.769642748183418 |
| 39 | 0.138761099948727 | 0.277522199897454 | 0.861238900051273 |
| 40 | 0.154873972249608 | 0.309747944499216 | 0.845126027750392 |
| Meta Analysis of Goldfeld-Quandt test for Heteroskedasticity | |||
| Description | # significant tests | % significant tests | OK/NOK |
| 1% type I error level | 0 | 0 | OK |
| 5% type I error level | 0 | 0 | OK |
| 10% type I error level | 3 | 0.136363636363636 | NOK |