| Multiple Linear Regression - Estimated Regression Equation |
| Inflatie[t] = + 2.0125 + 0.245833333333334Kredietcrisis[t] + 0.609166666666665M1[t] + 0.429166666666667M2[t] + 0.409166666666666M3[t] + 0.309166666666666M4[t] + 0.369166666666667M5[t] + 0.249166666666667M6[t] + 0.209166666666666M7[t] + 0.149166666666667M8[t] + 0.149166666666667M9[t] -0.0400000000000002M10[t] + 0.0600000000000002M11[t] + e[t] |
| Multiple Linear Regression - Ordinary Least Squares | |||||
| Variable | Parameter | S.D. | T-STAT H0: parameter = 0 | 2-tail p-value | 1-tail p-value |
| (Intercept) | 2.0125 | 0.811399 | 2.4803 | 0.016766 | 0.008383 |
| Kredietcrisis | 0.245833333333334 | 0.450777 | 0.5454 | 0.588089 | 0.294044 |
| M1 | 0.609166666666665 | 1.085615 | 0.5611 | 0.577377 | 0.288689 |
| M2 | 0.429166666666667 | 1.085615 | 0.3953 | 0.694394 | 0.347197 |
| M3 | 0.409166666666666 | 1.085615 | 0.3769 | 0.707945 | 0.353973 |
| M4 | 0.309166666666666 | 1.085615 | 0.2848 | 0.77706 | 0.38853 |
| M5 | 0.369166666666667 | 1.085615 | 0.3401 | 0.735332 | 0.367666 |
| M6 | 0.249166666666667 | 1.085615 | 0.2295 | 0.819463 | 0.409732 |
| M7 | 0.209166666666666 | 1.085615 | 0.1927 | 0.848047 | 0.424023 |
| M8 | 0.149166666666667 | 1.085615 | 0.1374 | 0.891299 | 0.44565 |
| M9 | 0.149166666666667 | 1.085615 | 0.1374 | 0.891299 | 0.44565 |
| M10 | -0.0400000000000002 | 1.081865 | -0.037 | 0.970663 | 0.485331 |
| M11 | 0.0600000000000002 | 1.081865 | 0.0555 | 0.956007 | 0.478004 |
| Multiple Linear Regression - Regression Statistics | |
| Multiple R | 0.135977832184842 |
| R-squared | 0.0184899708456891 |
| Adjusted R-squared | -0.232108334470305 |
| F-TEST (value) | 0.0737833036116267 |
| F-TEST (DF numerator) | 12 |
| F-TEST (DF denominator) | 47 |
| p-value | 0.99998817080419 |
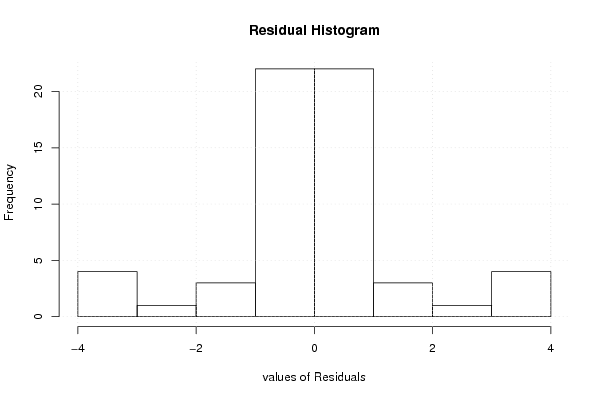
| Multiple Linear Regression - Residual Statistics | |
| Residual Standard Deviation | 1.71057878720451 |
| Sum Squared Residuals | 137.52575 |
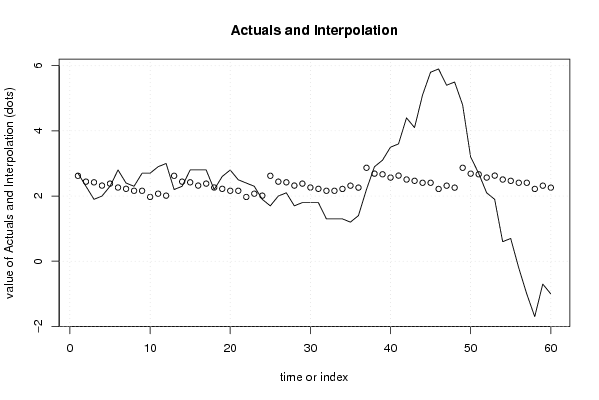
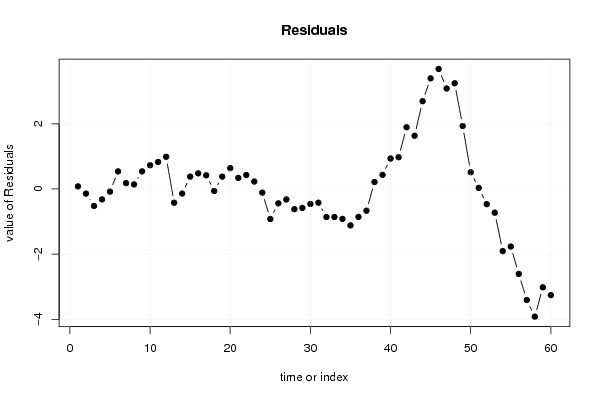
| Multiple Linear Regression - Actuals, Interpolation, and Residuals | |||
| Time or Index | Actuals | Interpolation Forecast | Residuals Prediction Error |
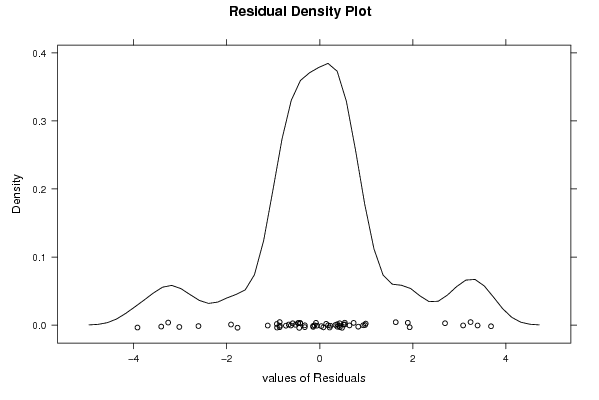
| 1 | 2.7 | 2.62166666666668 | 0.0783333333333253 |
| 2 | 2.3 | 2.44166666666667 | -0.141666666666665 |
| 3 | 1.9 | 2.42166666666667 | -0.521666666666667 |
| 4 | 2 | 2.32166666666667 | -0.321666666666667 |
| 5 | 2.3 | 2.38166666666667 | -0.0816666666666665 |
| 6 | 2.8 | 2.26166666666667 | 0.538333333333332 |
| 7 | 2.4 | 2.22166666666667 | 0.178333333333334 |
| 8 | 2.3 | 2.16166666666667 | 0.138333333333334 |
| 9 | 2.7 | 2.16166666666667 | 0.538333333333334 |
| 10 | 2.7 | 1.9725 | 0.7275 |
| 11 | 2.9 | 2.0725 | 0.8275 |
| 12 | 3 | 2.0125 | 0.9875 |
| 13 | 2.2 | 2.62166666666666 | -0.421666666666664 |
| 14 | 2.3 | 2.44166666666667 | -0.141666666666667 |
| 15 | 2.8 | 2.42166666666667 | 0.378333333333334 |
| 16 | 2.8 | 2.32166666666667 | 0.478333333333334 |
| 17 | 2.8 | 2.38166666666667 | 0.418333333333333 |
| 18 | 2.2 | 2.26166666666667 | -0.0616666666666665 |
| 19 | 2.6 | 2.22166666666667 | 0.378333333333334 |
| 20 | 2.8 | 2.16166666666667 | 0.638333333333334 |
| 21 | 2.5 | 2.16166666666667 | 0.338333333333333 |
| 22 | 2.4 | 1.9725 | 0.4275 |
| 23 | 2.3 | 2.0725 | 0.2275 |
| 24 | 1.9 | 2.0125 | -0.112500000000000 |
| 25 | 1.7 | 2.62166666666666 | -0.921666666666665 |
| 26 | 2 | 2.44166666666667 | -0.441666666666666 |
| 27 | 2.1 | 2.42166666666667 | -0.321666666666666 |
| 28 | 1.7 | 2.32166666666667 | -0.621666666666666 |
| 29 | 1.8 | 2.38166666666667 | -0.581666666666667 |
| 30 | 1.8 | 2.26166666666667 | -0.461666666666667 |
| 31 | 1.8 | 2.22166666666667 | -0.421666666666666 |
| 32 | 1.3 | 2.16166666666667 | -0.861666666666666 |
| 33 | 1.3 | 2.16166666666667 | -0.861666666666666 |
| 34 | 1.3 | 2.21833333333333 | -0.918333333333333 |
| 35 | 1.2 | 2.31833333333333 | -1.11833333333333 |
| 36 | 1.4 | 2.25833333333333 | -0.858333333333334 |
| 37 | 2.2 | 2.8675 | -0.667499999999999 |
| 38 | 2.9 | 2.6875 | 0.212499999999999 |
| 39 | 3.1 | 2.6675 | 0.4325 |
| 40 | 3.5 | 2.5675 | 0.9325 |
| 41 | 3.6 | 2.6275 | 0.9725 |
| 42 | 4.4 | 2.5075 | 1.8925 |
| 43 | 4.1 | 2.4675 | 1.6325 |
| 44 | 5.1 | 2.4075 | 2.6925 |
| 45 | 5.8 | 2.4075 | 3.3925 |
| 46 | 5.9 | 2.21833333333333 | 3.68166666666667 |
| 47 | 5.4 | 2.31833333333333 | 3.08166666666667 |
| 48 | 5.5 | 2.25833333333333 | 3.24166666666667 |
| 49 | 4.8 | 2.8675 | 1.9325 |
| 50 | 3.2 | 2.6875 | 0.5125 |
| 51 | 2.7 | 2.6675 | 0.0324999999999999 |
| 52 | 2.1 | 2.5675 | -0.4675 |
| 53 | 1.9 | 2.6275 | -0.7275 |
| 54 | 0.6 | 2.5075 | -1.9075 |
| 55 | 0.7 | 2.4675 | -1.7675 |
| 56 | -0.2 | 2.4075 | -2.6075 |
| 57 | -1 | 2.4075 | -3.4075 |
| 58 | -1.7 | 2.21833333333333 | -3.91833333333333 |
| 59 | -0.7 | 2.31833333333333 | -3.01833333333333 |
| 60 | -1 | 2.25833333333333 | -3.25833333333333 |
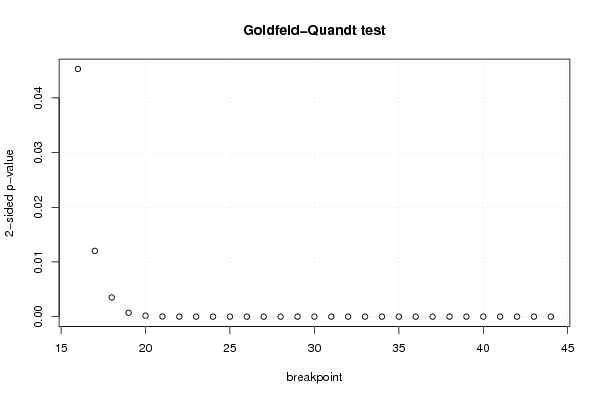
| Goldfeld-Quandt test for Heteroskedasticity | |||
| p-values | Alternative Hypothesis | ||
| breakpoint index | greater | 2-sided | less |
| 16 | 0.0226415726796944 | 0.0452831453593887 | 0.977358427320306 |
| 17 | 0.0060149318278533 | 0.0120298636557066 | 0.993985068172147 |
| 18 | 0.00175519370730880 | 0.00351038741461759 | 0.998244806292691 |
| 19 | 0.000355728675883654 | 0.000711457351767308 | 0.999644271324116 |
| 20 | 9.05990640179736e-05 | 0.000181198128035947 | 0.999909400935982 |
| 21 | 1.68246979634576e-05 | 3.36493959269153e-05 | 0.999983175302037 |
| 22 | 3.2745470708898e-06 | 6.5490941417796e-06 | 0.99999672545293 |
| 23 | 9.5311937907942e-07 | 1.90623875815884e-06 | 0.99999904688062 |
| 24 | 8.63235589500881e-07 | 1.72647117900176e-06 | 0.99999913676441 |
| 25 | 3.76601293769095e-07 | 7.5320258753819e-07 | 0.999999623398706 |
| 26 | 7.55785418836321e-08 | 1.51157083767264e-07 | 0.999999924421458 |
| 27 | 1.39007506214718e-08 | 2.78015012429437e-08 | 0.99999998609925 |
| 28 | 5.06519650858046e-09 | 1.01303930171609e-08 | 0.999999994934804 |
| 29 | 1.97935364450268e-09 | 3.95870728900535e-09 | 0.999999998020646 |
| 30 | 6.64282338176126e-10 | 1.32856467635225e-09 | 0.999999999335718 |
| 31 | 2.16073587231963e-10 | 4.32147174463926e-10 | 0.999999999783926 |
| 32 | 2.65471738856274e-10 | 5.30943477712549e-10 | 0.999999999734528 |
| 33 | 2.83961175764543e-10 | 5.67922351529086e-10 | 0.999999999716039 |
| 34 | 4.91950460330059e-11 | 9.83900920660118e-11 | 0.999999999950805 |
| 35 | 8.4312701722867e-12 | 1.68625403445734e-11 | 0.999999999991569 |
| 36 | 1.37822415580796e-12 | 2.75644831161593e-12 | 0.999999999998622 |
| 37 | 1.06211244349010e-12 | 2.12422488698021e-12 | 0.999999999998938 |
| 38 | 1.39085626708724e-12 | 2.78171253417449e-12 | 0.99999999999861 |
| 39 | 9.34200461682138e-13 | 1.86840092336428e-12 | 0.999999999999066 |
| 40 | 1.04186579472700e-12 | 2.08373158945401e-12 | 0.999999999998958 |
| 41 | 5.80743126466267e-13 | 1.16148625293253e-12 | 0.99999999999942 |
| 42 | 1.96106266934760e-12 | 3.92212533869521e-12 | 0.99999999999804 |
| 43 | 1.62127461758339e-12 | 3.24254923516679e-12 | 0.999999999998379 |
| 44 | 1.97462267047088e-11 | 3.94924534094176e-11 | 0.999999999980254 |
| Meta Analysis of Goldfeld-Quandt test for Heteroskedasticity | |||
| Description | # significant tests | % significant tests | OK/NOK |
| 1% type I error level | 27 | 0.93103448275862 | NOK |
| 5% type I error level | 29 | 1 | NOK |
| 10% type I error level | 29 | 1 | NOK |
