| Multiple Linear Regression - Estimated Regression Equation |
| TIA[t] = + 32.5049364211236 + 0.303638779125189IAidM[t] + 0.354779288294477`TIA(t-3)`[t] -1.15156326894194M1[t] + 2.55491853186197M2[t] + 11.9498804134043M3[t] + 6.94062493998272M4[t] + 5.91613478259514M5[t] + 10.2762807456465M6[t] -8.00791974071992M7[t] + 2.74328260551863M8[t] + 8.67593779647815M9[t] + 17.3117411390319M10[t] + 9.64099946115172M11[t] -0.0091814120305812t + e[t] |
| Multiple Linear Regression - Ordinary Least Squares | |||||
| Variable | Parameter | S.D. | T-STAT H0: parameter = 0 | 2-tail p-value | 1-tail p-value |
| (Intercept) | 32.5049364211236 | 14.565839 | 2.2316 | 0.030668 | 0.015334 |
| IAidM | 0.303638779125189 | 0.075723 | 4.0099 | 0.000226 | 0.000113 |
| `TIA(t-3)` | 0.354779288294477 | 0.144699 | 2.4518 | 0.018158 | 0.009079 |
| M1 | -1.15156326894194 | 2.402733 | -0.4793 | 0.634066 | 0.317033 |
| M2 | 2.55491853186197 | 2.549927 | 1.002 | 0.321722 | 0.160861 |
| M3 | 11.9498804134043 | 3.475651 | 3.4382 | 0.001272 | 0.000636 |
| M4 | 6.94062493998272 | 3.218519 | 2.1565 | 0.036428 | 0.018214 |
| M5 | 5.91613478259514 | 3.032412 | 1.951 | 0.057304 | 0.028652 |
| M6 | 10.2762807456465 | 2.655537 | 3.8698 | 0.000349 | 0.000174 |
| M7 | -8.00791974071992 | 2.475079 | -3.2354 | 0.00228 | 0.00114 |
| M8 | 2.74328260551863 | 2.590436 | 1.059 | 0.295249 | 0.147625 |
| M9 | 8.67593779647815 | 2.634067 | 3.2937 | 0.001931 | 0.000966 |
| M10 | 17.3117411390319 | 4.998995 | 3.463 | 0.001183 | 0.000592 |
| M11 | 9.64099946115172 | 3.39272 | 2.8417 | 0.006721 | 0.00336 |
| t | -0.0091814120305812 | 0.040456 | -0.2269 | 0.821492 | 0.410746 |
| Multiple Linear Regression - Regression Statistics | |
| Multiple R | 0.93894829808783 |
| R-squared | 0.881623906482032 |
| Adjusted R-squared | 0.844795788498664 |
| F-TEST (value) | 23.9388802566611 |
| F-TEST (DF numerator) | 14 |
| F-TEST (DF denominator) | 45 |
| p-value | 2.22044604925031e-16 |
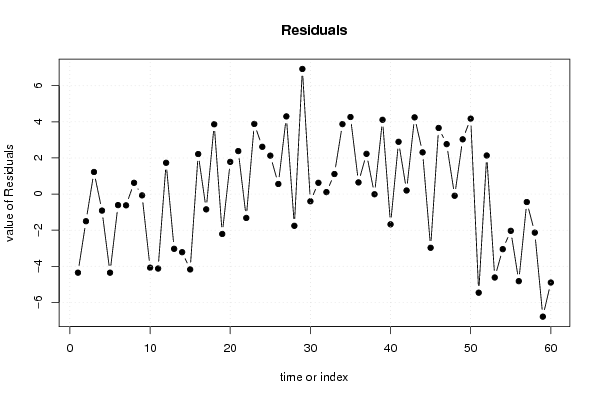
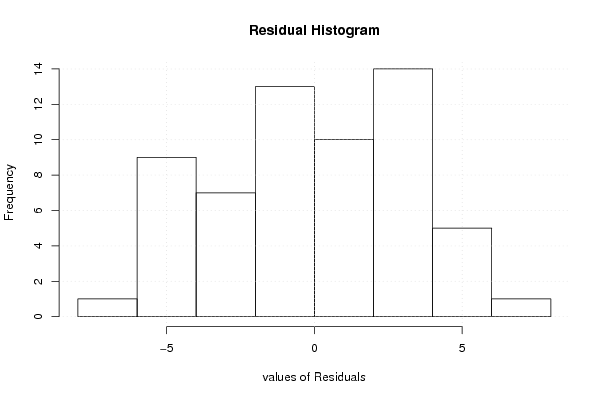
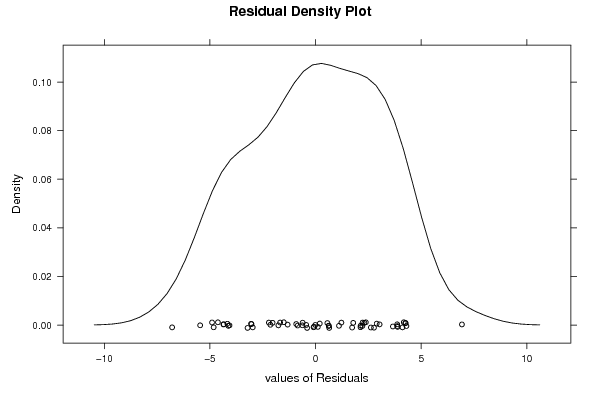
| Multiple Linear Regression - Residual Statistics | |
| Residual Standard Deviation | 3.54551443401741 |
| Sum Squared Residuals | 565.68026708216 |
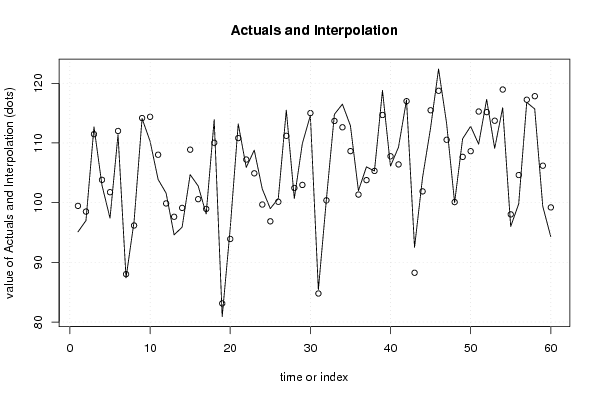
| Multiple Linear Regression - Actuals, Interpolation, and Residuals | |||
| Time or Index | Actuals | Interpolation Forecast | Residuals Prediction Error |
| 1 | 95.1 | 99.4543557245867 | -4.35435572458669 |
| 2 | 97 | 98.5040474367025 | -1.50404743670252 |
| 3 | 112.7 | 111.476918268041 | 1.22308173195868 |
| 4 | 102.9 | 103.815862721433 | -0.915862721432816 |
| 5 | 97.4 | 101.755894636673 | -4.35589463667311 |
| 6 | 111.4 | 112.010896670955 | -0.610896670954898 |
| 7 | 87.4 | 88.0241146596581 | -0.624114659658122 |
| 8 | 96.8 | 96.1772080720836 | 0.622791927916421 |
| 9 | 114.1 | 114.172739318665 | -0.0727393186646354 |
| 10 | 110.3 | 114.375749963858 | -4.07574996385792 |
| 11 | 103.9 | 108.026736241689 | -4.12673624168897 |
| 12 | 101.6 | 99.8685637353857 | 1.73143626461426 |
| 13 | 94.6 | 97.6329326601069 | -3.03293266010687 |
| 14 | 95.9 | 99.1203733596206 | -3.22037335962058 |
| 15 | 104.7 | 108.874352704643 | -4.1743527046433 |
| 16 | 102.8 | 100.582999975404 | 2.21700002459573 |
| 17 | 98.1 | 98.9478057538308 | -0.84780575383078 |
| 18 | 113.9 | 110.034129513433 | 3.86587048656729 |
| 19 | 80.9 | 83.1113309541962 | -2.21133095419624 |
| 20 | 95.7 | 93.9166302744337 | 1.78336972556626 |
| 21 | 113.2 | 110.820023198931 | 2.37997680106873 |
| 22 | 105.9 | 107.222742691224 | -1.32274269122390 |
| 23 | 108.8 | 104.915008579721 | 3.88499142027855 |
| 24 | 102.3 | 99.6819964548539 | 2.61800354514611 |
| 25 | 99 | 96.8726431846198 | 2.12735681538024 |
| 26 | 100.7 | 100.141337369646 | 0.558662630353834 |
| 27 | 115.5 | 111.198720471784 | 4.30127952821619 |
| 28 | 100.7 | 102.458946190308 | -1.75894619030826 |
| 29 | 109.9 | 102.969679626279 | 6.9303203737212 |
| 30 | 114.6 | 115.000487877059 | -0.400487877059376 |
| 31 | 85.4 | 84.77631937115 | 0.623680628850072 |
| 32 | 100.5 | 100.391595287031 | 0.108404712969405 |
| 33 | 114.8 | 113.690940768497 | 1.10905923150287 |
| 34 | 116.5 | 112.626012794897 | 3.87398720510299 |
| 35 | 112.9 | 108.633243673044 | 4.26675632695571 |
| 36 | 102 | 101.354021488259 | 0.645978511741171 |
| 37 | 106 | 103.772061632814 | 2.22793836718623 |
| 38 | 105.3 | 105.311604124264 | -0.0116041242639373 |
| 39 | 118.8 | 114.686502846256 | 4.11349715374419 |
| 40 | 106.1 | 107.777520421517 | -1.67752042151698 |
| 41 | 109.3 | 106.404411716555 | 2.89558828344488 |
| 42 | 117.2 | 117.002362799352 | 0.197637200647743 |
| 43 | 92.5 | 88.2519638687617 | 4.24803613123832 |
| 44 | 104.2 | 101.890383444438 | 2.30961655556194 |
| 45 | 112.5 | 115.474834066896 | -2.9748340668964 |
| 46 | 122.4 | 118.739161902748 | 3.66083809725188 |
| 47 | 113.3 | 110.534119287355 | 2.76588071264518 |
| 48 | 100 | 100.093849523777 | -0.0938495237768465 |
| 49 | 110.7 | 107.668006797873 | 3.03199320212709 |
| 50 | 112.8 | 108.622637709767 | 4.1773622902332 |
| 51 | 109.8 | 115.263505709276 | -5.46350570927576 |
| 52 | 117.3 | 115.164670691338 | 2.13532930866233 |
| 53 | 109.1 | 113.722208266662 | -4.62220826666220 |
| 54 | 115.9 | 118.952123139201 | -3.05212313920076 |
| 55 | 96 | 98.036271146234 | -2.03627114623404 |
| 56 | 99.8 | 104.624182922014 | -4.82418292201402 |
| 57 | 116.8 | 117.241462647011 | -0.441462647010568 |
| 58 | 115.7 | 117.836332647273 | -2.13633264727305 |
| 59 | 99.4 | 106.190892218190 | -6.79089221819047 |
| 60 | 94.3 | 99.2015687977247 | -4.90156879772469 |
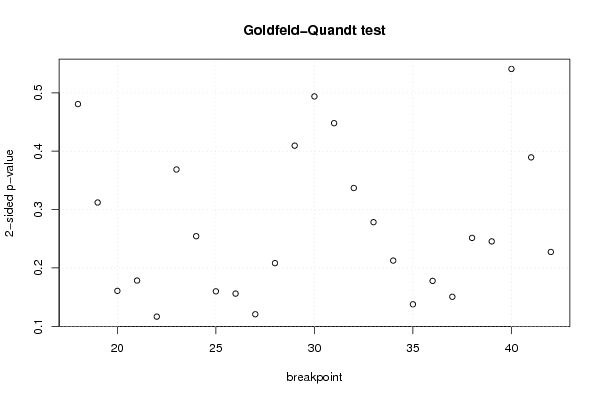
| Goldfeld-Quandt test for Heteroskedasticity | |||
| p-values | Alternative Hypothesis | ||
| breakpoint index | greater | 2-sided | less |
| 18 | 0.240402767718595 | 0.48080553543719 | 0.759597232281405 |
| 19 | 0.156069323308035 | 0.312138646616071 | 0.843930676691965 |
| 20 | 0.0803744096858877 | 0.160748819371775 | 0.919625590314112 |
| 21 | 0.0892172002147046 | 0.178434400429409 | 0.910782799785295 |
| 22 | 0.0582838367120907 | 0.116567673424181 | 0.94171616328791 |
| 23 | 0.184366069286090 | 0.368732138572179 | 0.81563393071391 |
| 24 | 0.127193752895896 | 0.254387505791793 | 0.872806247104104 |
| 25 | 0.0799763713517787 | 0.159952742703557 | 0.920023628648221 |
| 26 | 0.0780215597470313 | 0.156043119494063 | 0.921978440252969 |
| 27 | 0.0603299849990349 | 0.12065996999807 | 0.939670015000965 |
| 28 | 0.104140720031313 | 0.208281440062626 | 0.895859279968687 |
| 29 | 0.204775686933931 | 0.409551373867863 | 0.795224313066069 |
| 30 | 0.246961059870721 | 0.493922119741443 | 0.753038940129279 |
| 31 | 0.224026936389358 | 0.448053872778717 | 0.775973063610642 |
| 32 | 0.168503905357824 | 0.337007810715648 | 0.831496094642176 |
| 33 | 0.139221676847252 | 0.278443353694504 | 0.860778323152748 |
| 34 | 0.106327115971249 | 0.212654231942497 | 0.893672884028751 |
| 35 | 0.0688646729432135 | 0.137729345886427 | 0.931135327056786 |
| 36 | 0.0889201504270339 | 0.177840300854068 | 0.911079849572966 |
| 37 | 0.0753102481224137 | 0.150620496244827 | 0.924689751877586 |
| 38 | 0.125754359132600 | 0.251508718265199 | 0.8742456408674 |
| 39 | 0.122766871073735 | 0.245533742147470 | 0.877233128926265 |
| 40 | 0.270492702129114 | 0.540985404258228 | 0.729507297870886 |
| 41 | 0.194740275555743 | 0.389480551111487 | 0.805259724444257 |
| 42 | 0.113701858018165 | 0.227403716036331 | 0.886298141981835 |
| Meta Analysis of Goldfeld-Quandt test for Heteroskedasticity | |||
| Description | # significant tests | % significant tests | OK/NOK |
| 1% type I error level | 0 | 0 | OK |
| 5% type I error level | 0 | 0 | OK |
| 10% type I error level | 0 | 0 | OK |