| Multiple Linear Regression - Estimated Regression Equation |
| Inflatie[t] = + 3.22000000000000 + 2.25833333333333Kredietcrisis[t] + 0.273749999999998M1[t] + 0.160833333333333M2[t] + 0.207916666666666M3[t] + 0.175M4[t] + 0.302083333333333M5[t] + 0.249166666666666M6[t] + 0.276249999999999M7[t] + 0.283333333333333M8[t] + 0.350416666666667M9[t] -0.174166666666667M10[t] -0.00708333333333295M11[t] -0.0670833333333333t + e[t] |
| Multiple Linear Regression - Ordinary Least Squares | |||||
| Variable | Parameter | S.D. | T-STAT H0: parameter = 0 | 2-tail p-value | 1-tail p-value |
| (Intercept) | 3.22000000000000 | 0.877565 | 3.6692 | 0.00063 | 0.000315 |
| Kredietcrisis | 2.25833333333333 | 0.844437 | 2.6744 | 0.010331 | 0.005166 |
| M1 | 0.273749999999998 | 1.024115 | 0.2673 | 0.79043 | 0.395215 |
| M2 | 0.160833333333333 | 1.021501 | 0.1574 | 0.875581 | 0.43779 |
| M3 | 0.207916666666666 | 1.019463 | 0.2039 | 0.839294 | 0.419647 |
| M4 | 0.175 | 1.018005 | 0.1719 | 0.864266 | 0.432133 |
| M5 | 0.302083333333333 | 1.017129 | 0.297 | 0.767806 | 0.383903 |
| M6 | 0.249166666666666 | 1.016837 | 0.245 | 0.807515 | 0.403757 |
| M7 | 0.276249999999999 | 1.017129 | 0.2716 | 0.787146 | 0.393573 |
| M8 | 0.283333333333333 | 1.018005 | 0.2783 | 0.782012 | 0.391006 |
| M9 | 0.350416666666667 | 1.019463 | 0.3437 | 0.732618 | 0.366309 |
| M10 | -0.174166666666667 | 1.014496 | -0.1717 | 0.864444 | 0.432222 |
| M11 | -0.00708333333333295 | 1.013617 | -0.007 | 0.994455 | 0.497227 |
| t | -0.0670833333333333 | 0.024377 | -2.7519 | 0.008448 | 0.004224 |
| Multiple Linear Regression - Regression Statistics | |
| Multiple R | 0.396531226368374 |
| R-squared | 0.157237013485207 |
| Adjusted R-squared | -0.0809351348776692 |
| F-TEST (value) | 0.660182202520349 |
| F-TEST (DF numerator) | 13 |
| F-TEST (DF denominator) | 46 |
| p-value | 0.789807794205254 |
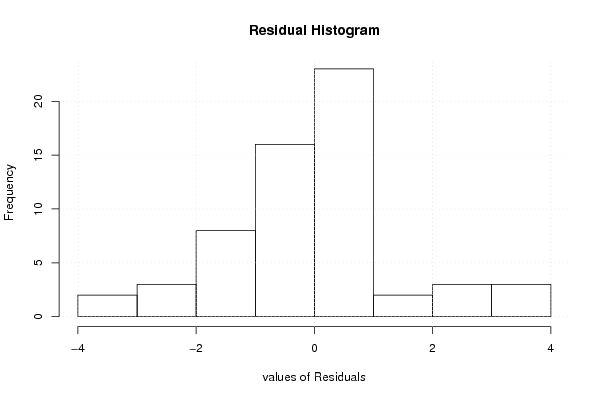
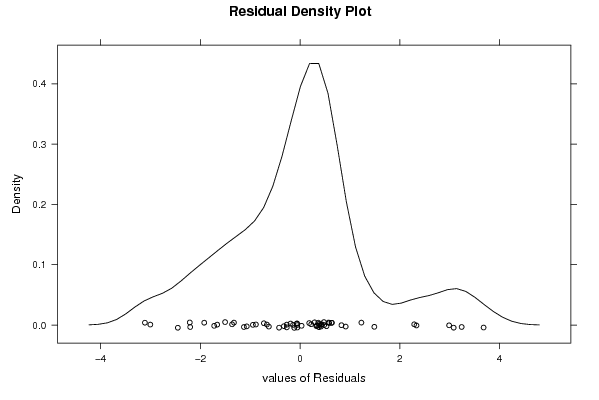
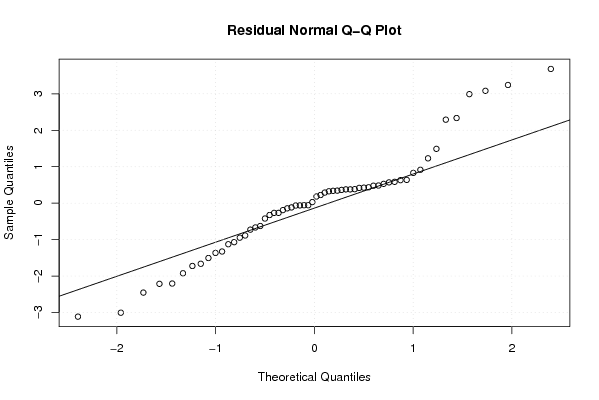
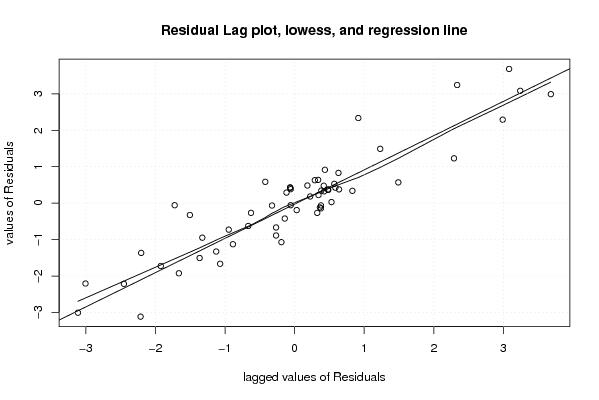
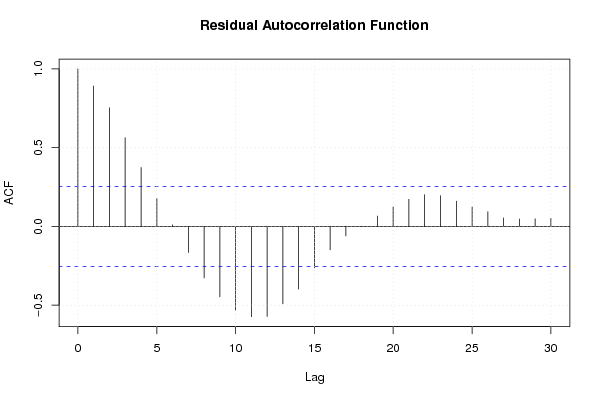
| Multiple Linear Regression - Residual Statistics | |
| Residual Standard Deviation | 1.60220635917828 |
| Sum Squared Residuals | 118.085 |
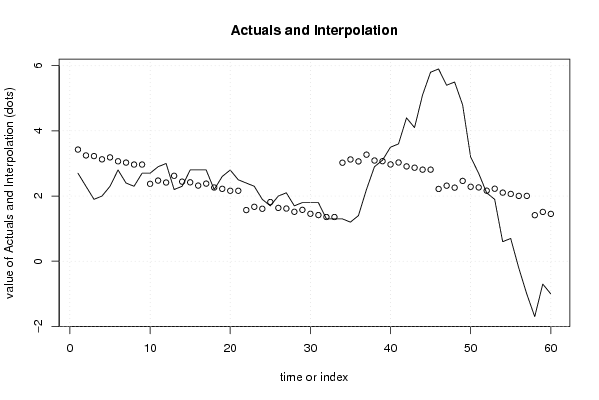
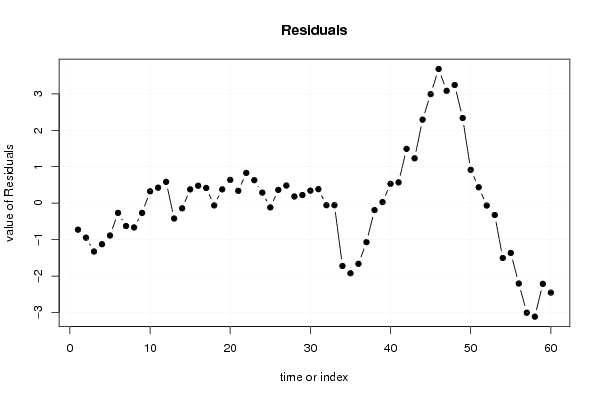
| Multiple Linear Regression - Actuals, Interpolation, and Residuals | |||
| Time or Index | Actuals | Interpolation Forecast | Residuals Prediction Error |
| 1 | 2.7 | 3.42666666666668 | -0.726666666666675 |
| 2 | 2.3 | 3.24666666666667 | -0.946666666666665 |
| 3 | 1.9 | 3.22666666666667 | -1.32666666666667 |
| 4 | 2 | 3.12666666666667 | -1.12666666666667 |
| 5 | 2.3 | 3.18666666666667 | -0.886666666666666 |
| 6 | 2.8 | 3.06666666666667 | -0.266666666666667 |
| 7 | 2.4 | 3.02666666666667 | -0.626666666666666 |
| 8 | 2.3 | 2.96666666666667 | -0.666666666666666 |
| 9 | 2.7 | 2.96666666666667 | -0.266666666666666 |
| 10 | 2.7 | 2.375 | 0.325 |
| 11 | 2.9 | 2.475 | 0.425000000000001 |
| 12 | 3 | 2.415 | 0.585 |
| 13 | 2.2 | 2.62166666666666 | -0.421666666666664 |
| 14 | 2.3 | 2.44166666666667 | -0.141666666666666 |
| 15 | 2.8 | 2.42166666666667 | 0.378333333333334 |
| 16 | 2.8 | 2.32166666666667 | 0.478333333333334 |
| 17 | 2.8 | 2.38166666666667 | 0.418333333333333 |
| 18 | 2.2 | 2.26166666666667 | -0.061666666666666 |
| 19 | 2.6 | 2.22166666666667 | 0.378333333333334 |
| 20 | 2.8 | 2.16166666666667 | 0.638333333333334 |
| 21 | 2.5 | 2.16166666666667 | 0.338333333333333 |
| 22 | 2.4 | 1.57 | 0.83 |
| 23 | 2.3 | 1.67 | 0.63 |
| 24 | 1.9 | 1.61 | 0.29 |
| 25 | 1.7 | 1.81666666666666 | -0.116666666666665 |
| 26 | 2 | 1.63666666666667 | 0.363333333333334 |
| 27 | 2.1 | 1.61666666666667 | 0.483333333333333 |
| 28 | 1.7 | 1.51666666666667 | 0.183333333333334 |
| 29 | 1.8 | 1.57666666666667 | 0.223333333333333 |
| 30 | 1.8 | 1.45666666666667 | 0.343333333333333 |
| 31 | 1.8 | 1.41666666666667 | 0.383333333333333 |
| 32 | 1.3 | 1.35666666666667 | -0.0566666666666671 |
| 33 | 1.3 | 1.35666666666667 | -0.0566666666666675 |
| 34 | 1.3 | 3.02333333333333 | -1.72333333333333 |
| 35 | 1.2 | 3.12333333333333 | -1.92333333333333 |
| 36 | 1.4 | 3.06333333333333 | -1.66333333333333 |
| 37 | 2.2 | 3.27 | -1.07000000000000 |
| 38 | 2.9 | 3.09 | -0.19 |
| 39 | 3.1 | 3.07 | 0.0299999999999999 |
| 40 | 3.5 | 2.97 | 0.53 |
| 41 | 3.6 | 3.03 | 0.57 |
| 42 | 4.4 | 2.91 | 1.49 |
| 43 | 4.1 | 2.87 | 1.23 |
| 44 | 5.1 | 2.81 | 2.29 |
| 45 | 5.8 | 2.81 | 2.99 |
| 46 | 5.9 | 2.21833333333333 | 3.68166666666667 |
| 47 | 5.4 | 2.31833333333333 | 3.08166666666667 |
| 48 | 5.5 | 2.25833333333333 | 3.24166666666667 |
| 49 | 4.8 | 2.465 | 2.335 |
| 50 | 3.2 | 2.285 | 0.915 |
| 51 | 2.7 | 2.265 | 0.435 |
| 52 | 2.1 | 2.165 | -0.0650000000000003 |
| 53 | 1.9 | 2.225 | -0.325000000000001 |
| 54 | 0.6 | 2.105 | -1.505 |
| 55 | 0.7 | 2.065 | -1.365 |
| 56 | -0.2 | 2.005 | -2.205 |
| 57 | -1 | 2.005 | -3.005 |
| 58 | -1.7 | 1.41333333333333 | -3.11333333333333 |
| 59 | -0.7 | 1.51333333333333 | -2.21333333333333 |
| 60 | -1 | 1.45333333333333 | -2.45333333333333 |
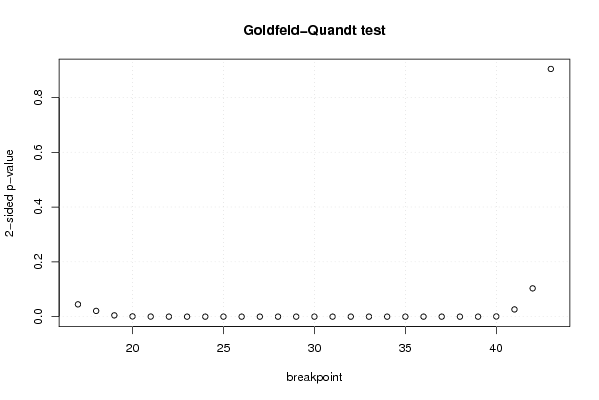
| Goldfeld-Quandt test for Heteroskedasticity | |||
| p-values | Alternative Hypothesis | ||
| breakpoint index | greater | 2-sided | less |
| 17 | 0.0224739812865512 | 0.0449479625731025 | 0.977526018713449 |
| 18 | 0.0104617910644468 | 0.0209235821288936 | 0.989538208935553 |
| 19 | 0.00235005166474178 | 0.00470010332948357 | 0.997649948335258 |
| 20 | 0.000534258543519644 | 0.00106851708703929 | 0.99946574145648 |
| 21 | 0.000128855709866717 | 0.000257711419733434 | 0.999871144290133 |
| 22 | 3.24252958266868e-05 | 6.48505916533736e-05 | 0.999967574704173 |
| 23 | 1.20353520957883e-05 | 2.40707041915765e-05 | 0.999987964647904 |
| 24 | 1.08444782561513e-05 | 2.16889565123026e-05 | 0.999989155521744 |
| 25 | 3.95067281735289e-06 | 7.90134563470579e-06 | 0.999996049327183 |
| 26 | 7.80740557809589e-07 | 1.56148111561918e-06 | 0.999999219259442 |
| 27 | 1.43002619770039e-07 | 2.86005239540077e-07 | 0.99999985699738 |
| 28 | 3.55306559298242e-08 | 7.10613118596483e-08 | 0.999999964469344 |
| 29 | 8.4763686879378e-09 | 1.69527373758756e-08 | 0.999999991523631 |
| 30 | 1.71169375868884e-09 | 3.42338751737768e-09 | 0.999999998288306 |
| 31 | 3.20696457212448e-10 | 6.41392914424896e-10 | 0.999999999679304 |
| 32 | 1.62519977467830e-10 | 3.25039954935659e-10 | 0.99999999983748 |
| 33 | 7.14718161667947e-11 | 1.42943632333589e-10 | 0.999999999928528 |
| 34 | 2.38890222658883e-11 | 4.77780445317767e-11 | 0.99999999997611 |
| 35 | 1.79781428654116e-11 | 3.59562857308231e-11 | 0.999999999982022 |
| 36 | 4.73096849260978e-11 | 9.46193698521956e-11 | 0.99999999995269 |
| 37 | 6.24629597509099e-09 | 1.24925919501820e-08 | 0.999999993753704 |
| 38 | 4.26890112224430e-07 | 8.53780224448859e-07 | 0.999999573109888 |
| 39 | 1.30998983525234e-05 | 2.61997967050468e-05 | 0.999986900101647 |
| 40 | 0.000362175197692025 | 0.000724350395384051 | 0.999637824802308 |
| 41 | 0.0132122866086545 | 0.0264245732173089 | 0.986787713391346 |
| 42 | 0.0516272961235373 | 0.103254592247075 | 0.948372703876463 |
| 43 | 0.452006754281721 | 0.904013508563443 | 0.547993245718279 |
| Meta Analysis of Goldfeld-Quandt test for Heteroskedasticity | |||
| Description | # significant tests | % significant tests | OK/NOK |
| 1% type I error level | 22 | 0.814814814814815 | NOK |
| 5% type I error level | 25 | 0.925925925925926 | NOK |
| 10% type I error level | 25 | 0.925925925925926 | NOK |