| Multiple Linear Regression - Estimated Regression Equation |
| vmtot[t] = -496.182843436178 + 5.99546433915312ktot[t] + e[t] |
| Multiple Linear Regression - Ordinary Least Squares | |||||
| Variable | Parameter | S.D. | T-STAT H0: parameter = 0 | 2-tail p-value | 1-tail p-value |
| (Intercept) | -496.182843436178 | 44.176154 | -11.2319 | 0 | 0 |
| ktot | 5.99546433915312 | 0.436159 | 13.7461 | 0 | 0 |
| Multiple Linear Regression - Regression Statistics | |
| Multiple R | 0.902562117697146 |
| R-squared | 0.814618376301957 |
| Adjusted R-squared | 0.81030717575084 |
| F-TEST (value) | 188.953950678737 |
| F-TEST (DF numerator) | 1 |
| F-TEST (DF denominator) | 43 |
| p-value | 0 |
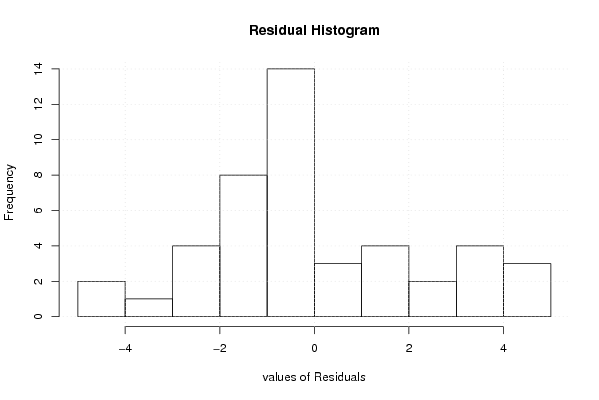
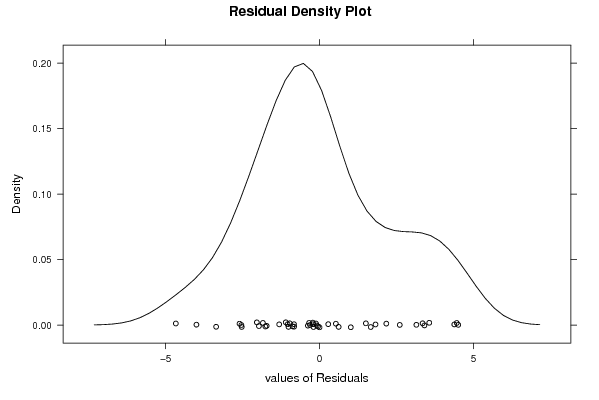
| Multiple Linear Regression - Residual Statistics | |
| Residual Standard Deviation | 2.26710358170506 |
| Sum Squared Residuals | 221.009621957737 |
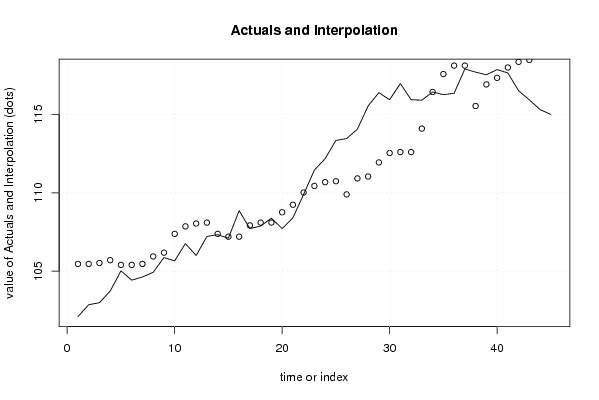
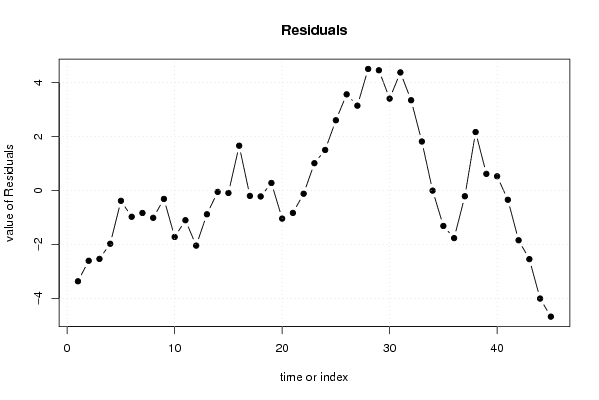
| Multiple Linear Regression - Actuals, Interpolation, and Residuals | |||
| Time or Index | Actuals | Interpolation Forecast | Residuals Prediction Error |
| 1 | 102.1 | 105.462002997838 | -3.36200299783781 |
| 2 | 102.86 | 105.462002997838 | -2.60200299783777 |
| 3 | 102.99 | 105.521957641229 | -2.53195764122933 |
| 4 | 103.73 | 105.701821571404 | -1.97182157140392 |
| 5 | 105.02 | 105.402048354446 | -0.382048354446288 |
| 6 | 104.43 | 105.402048354446 | -0.972048354446277 |
| 7 | 104.63 | 105.462002997838 | -0.832002997837764 |
| 8 | 104.93 | 105.94164014497 | -1.01164014497008 |
| 9 | 105.87 | 106.181458718536 | -0.311458718536158 |
| 10 | 105.66 | 107.380551586367 | -1.72055158636681 |
| 11 | 106.76 | 107.860188733499 | -1.10018873349904 |
| 12 | 106 | 108.040052663674 | -2.04005266367364 |
| 13 | 107.22 | 108.100007307065 | -0.880007307065206 |
| 14 | 107.33 | 107.380551586367 | -0.0505515863668045 |
| 15 | 107.11 | 107.200687656192 | -0.0906876561922033 |
| 16 | 108.86 | 107.200687656192 | 1.65931234380780 |
| 17 | 107.72 | 107.920143376891 | -0.200143376890605 |
| 18 | 107.88 | 108.100007307065 | -0.220007307065209 |
| 19 | 108.38 | 108.100007307065 | 0.279992692934791 |
| 20 | 107.72 | 108.759508384372 | -1.03950838437205 |
| 21 | 108.41 | 109.239145531504 | -0.829145531504287 |
| 22 | 109.9 | 110.018555895594 | -0.118555895594157 |
| 23 | 111.45 | 110.438238399335 | 1.01176160066508 |
| 24 | 112.18 | 110.678056972901 | 1.50194302709900 |
| 25 | 113.34 | 110.738011616293 | 2.60198838370744 |
| 26 | 113.46 | 109.898646608811 | 3.56135339118887 |
| 27 | 114.06 | 110.917875546467 | 3.14212445353284 |
| 28 | 115.54 | 111.037784833250 | 4.50221516674980 |
| 29 | 116.39 | 111.937104484123 | 4.4528955158768 |
| 30 | 115.94 | 112.536650918038 | 3.40334908196151 |
| 31 | 116.97 | 112.59660556143 | 4.37339443856995 |
| 32 | 115.94 | 112.59660556143 | 3.34339443856995 |
| 33 | 115.91 | 114.095471646218 | 1.81452835378167 |
| 34 | 116.43 | 116.433702738488 | -0.00370273848803870 |
| 35 | 116.26 | 117.572840962927 | -1.31284096292712 |
| 36 | 116.35 | 118.112432753451 | -1.76243275345085 |
| 37 | 117.9 | 118.112432753451 | -0.212432753450835 |
| 38 | 117.7 | 115.534383087615 | 2.16561691238496 |
| 39 | 117.53 | 116.913339885620 | 0.616660114379716 |
| 40 | 117.86 | 117.333022389361 | 0.526977610639037 |
| 41 | 117.65 | 117.992523466668 | -0.342523466667796 |
| 42 | 116.51 | 118.352251327017 | -1.84225132701700 |
| 43 | 115.93 | 118.4721606138 | -2.54216061380003 |
| 44 | 115.31 | 119.311525621281 | -4.00152562128148 |
| 45 | 115 | 119.671253481631 | -4.67125348163068 |
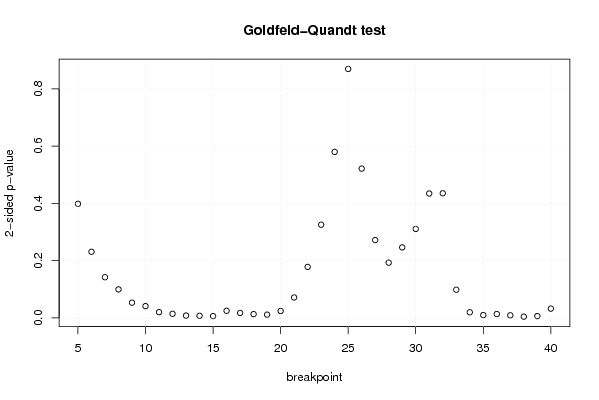
| Goldfeld-Quandt test for Heteroskedasticity | |||
| p-values | Alternative Hypothesis | ||
| breakpoint index | greater | 2-sided | less |
| 5 | 0.199318731174257 | 0.398637462348514 | 0.800681268825743 |
| 6 | 0.115594108625576 | 0.231188217251151 | 0.884405891374424 |
| 7 | 0.0711624811938339 | 0.142324962387668 | 0.928837518806166 |
| 8 | 0.0499467947874306 | 0.0998935895748613 | 0.95005320521257 |
| 9 | 0.0267414075930445 | 0.053482815186089 | 0.973258592406955 |
| 10 | 0.0206638474407009 | 0.0413276948814017 | 0.9793361525593 |
| 11 | 0.0102097537869319 | 0.0204195075738639 | 0.989790246213068 |
| 12 | 0.00731274270178372 | 0.0146254854035674 | 0.992687257298216 |
| 13 | 0.00417724989858655 | 0.0083544997971731 | 0.995822750101413 |
| 14 | 0.0038500545057596 | 0.0077001090115192 | 0.99614994549424 |
| 15 | 0.00328722765723289 | 0.00657445531446578 | 0.996712772342767 |
| 16 | 0.0125191584746119 | 0.0250383169492237 | 0.987480841525388 |
| 17 | 0.0087991619383147 | 0.0175983238766294 | 0.991200838061685 |
| 18 | 0.0067539162323872 | 0.0135078324647744 | 0.993246083767613 |
| 19 | 0.00584142913955876 | 0.0116828582791175 | 0.994158570860441 |
| 20 | 0.0122229605037382 | 0.0244459210074765 | 0.987777039496262 |
| 21 | 0.0358531145783887 | 0.0717062291567773 | 0.964146885421611 |
| 22 | 0.0892025868043295 | 0.178405173608659 | 0.91079741319567 |
| 23 | 0.162878562976181 | 0.325757125952361 | 0.83712143702382 |
| 24 | 0.290001015500195 | 0.580002031000391 | 0.709998984499805 |
| 25 | 0.434782250716365 | 0.86956450143273 | 0.565217749283635 |
| 26 | 0.739200690026864 | 0.521598619946272 | 0.260799309973136 |
| 27 | 0.863969652510037 | 0.272060694979927 | 0.136030347489963 |
| 28 | 0.903462723010548 | 0.193074553978904 | 0.0965372769894518 |
| 29 | 0.876752864372235 | 0.246494271255530 | 0.123247135627765 |
| 30 | 0.844564547321678 | 0.310870905356645 | 0.155435452678323 |
| 31 | 0.782664020182012 | 0.434671959635976 | 0.217335979817988 |
| 32 | 0.782243288470826 | 0.435513423058348 | 0.217756711529174 |
| 33 | 0.950648084171479 | 0.0987038316570417 | 0.0493519158285208 |
| 34 | 0.990023739451591 | 0.0199525210968171 | 0.00997626054840856 |
| 35 | 0.994927625727366 | 0.0101447485452688 | 0.00507237427263441 |
| 36 | 0.993093685767608 | 0.0138126284647847 | 0.00690631423239236 |
| 37 | 0.99529047881287 | 0.00941904237425978 | 0.00470952118712989 |
| 38 | 0.997671544822111 | 0.00465691035577722 | 0.00232845517788861 |
| 39 | 0.996765229827214 | 0.00646954034557163 | 0.00323477017278581 |
| 40 | 0.983666524263167 | 0.0326669514736662 | 0.0163334757368331 |
| Meta Analysis of Goldfeld-Quandt test for Heteroskedasticity | |||
| Description | # significant tests | % significant tests | OK/NOK |
| 1% type I error level | 6 | 0.166666666666667 | NOK |
| 5% type I error level | 18 | 0.5 | NOK |
| 10% type I error level | 22 | 0.611111111111111 | NOK |