Free Statistics

of Irreproducible Research!

Author's title

Author*The author of this computation has been verified*
R Software Modulerwasp_multipleregression.wasp
Title produced by softwareMultiple Regression
Date of computationFri, 20 Nov 2009 13:52:37 -0700
Cite this page as followsStatistical Computations at FreeStatistics.org, Office for Research Development and Education, URL https://freestatistics.org/blog/index.php?v=date/2009/Nov/20/t1258750445yeagxt0zm51zbnb.htm/, Retrieved Fri, 19 Apr 2024 17:31:07 +0000
Statistical Computations at FreeStatistics.org, Office for Research Development and Education, URL https://freestatistics.org/blog/index.php?pk=58462, Retrieved Fri, 19 Apr 2024 17:31:07 +0000
QR Codes:

Original text written by user:
IsPrivate?No (this computation is public)
User-defined keywords
Estimated Impact138
Family? (F = Feedback message, R = changed R code, M = changed R Module, P = changed Parameters, D = changed Data)
-       [Multiple Regression] [Shwws7_v1] [2009-11-20 20:52:37] [93b66894f6318f3da4fcda772f2ffa6f] [Current]
Feedback Forum

Post a new message
Dataseries X:
100,35	102,1
100,35	102,86
100,36	102,99
100,39	103,73
100,34	105,02
100,34	104,43
100,35	104,63
100,43	104,93
100,47	105,87
100,67	105,66
100,75	106,76
100,78	106
100,79	107,22
100,67	107,33
100,64	107,11
100,64	108,86
100,76	107,72
100,79	107,88
100,79	108,38
100,9	107,72
100,98	108,41
101,11	109,9
101,18	111,45
101,22	112,18
101,23	113,34
101,09	113,46
101,26	114,06
101,28	115,54
101,43	116,39
101,53	115,94
101,54	116,97
101,54	115,94
101,79	115,91
102,18	116,43
102,37	116,26
102,46	116,35
102,46	117,9
102,03	117,7
102,26	117,53
102,33	117,86
102,44	117,65
102,5	116,51
102,52	115,93
102,66	115,31
102,72	115


Summary of computational transaction
Raw Inputview raw input (R code)
Raw Outputview raw output of R engine
Computing time3 seconds
R Server'Gwilym Jenkins' @ 72.249.127.135

\begin{tabular}{lllllllll}
\hline
Summary of computational transaction \tabularnewline
Raw Input & view raw input (R code)  \tabularnewline
Raw Output & view raw output of R engine  \tabularnewline
Computing time & 3 seconds \tabularnewline
R Server & 'Gwilym Jenkins' @ 72.249.127.135 \tabularnewline
\hline
\end{tabular}
%Source: https://freestatistics.org/blog/index.php?pk=58462&T=0

[TABLE]
[ROW][C]Summary of computational transaction[/C][/ROW]
[ROW][C]Raw Input[/C][C]view raw input (R code) [/C][/ROW]
[ROW][C]Raw Output[/C][C]view raw output of R engine [/C][/ROW]
[ROW][C]Computing time[/C][C]3 seconds[/C][/ROW]
[ROW][C]R Server[/C][C]'Gwilym Jenkins' @ 72.249.127.135[/C][/ROW]
[/TABLE]
Source: https://freestatistics.org/blog/index.php?pk=58462&T=0

Globally Unique Identifier (entire table): ba.freestatistics.org/blog/index.php?pk=58462&T=0

As an alternative you can also use a QR Code:  

The GUIDs for individual cells are displayed in the table below:

Summary of computational transaction
Raw Inputview raw input (R code)
Raw Outputview raw output of R engine
Computing time3 seconds
R Server'Gwilym Jenkins' @ 72.249.127.135


Multiple Linear Regression - Estimated Regression Equation
ktot[t] = + 86.1933134730192 + 0.135872441268998vmtot[t] + e[t]

\begin{tabular}{lllllllll}
\hline
Multiple Linear Regression - Estimated Regression Equation \tabularnewline
ktot[t] =  +  86.1933134730192 +  0.135872441268998vmtot[t]  + e[t] \tabularnewline
\hline
\end{tabular}
%Source: https://freestatistics.org/blog/index.php?pk=58462&T=1

[TABLE]
[ROW][C]Multiple Linear Regression - Estimated Regression Equation[/C][/ROW]
[ROW][C]ktot[t] =  +  86.1933134730192 +  0.135872441268998vmtot[t]  + e[t][/C][/ROW]
[/TABLE]
Source: https://freestatistics.org/blog/index.php?pk=58462&T=1

Globally Unique Identifier (entire table): ba.freestatistics.org/blog/index.php?pk=58462&T=1

As an alternative you can also use a QR Code:  

The GUIDs for individual cells are displayed in the table below:

Multiple Linear Regression - Estimated Regression Equation
ktot[t] = + 86.1933134730192 + 0.135872441268998vmtot[t] + e[t]


Multiple Linear Regression - Ordinary Least Squares
VariableParameterS.D.T-STATH0: parameter = 02-tail p-value1-tail p-value
(Intercept)86.19331347301921.0988278.441700
vmtot0.1358724412689980.00988413.746100

\begin{tabular}{lllllllll}
\hline
Multiple Linear Regression - Ordinary Least Squares \tabularnewline
Variable & Parameter & S.D. & T-STATH0: parameter = 0 & 2-tail p-value & 1-tail p-value \tabularnewline
(Intercept) & 86.1933134730192 & 1.09882 & 78.4417 & 0 & 0 \tabularnewline
vmtot & 0.135872441268998 & 0.009884 & 13.7461 & 0 & 0 \tabularnewline
\hline
\end{tabular}
%Source: https://freestatistics.org/blog/index.php?pk=58462&T=2

[TABLE]
[ROW][C]Multiple Linear Regression - Ordinary Least Squares[/C][/ROW]
[ROW][C]Variable[/C][C]Parameter[/C][C]S.D.[/C][C]T-STATH0: parameter = 0[/C][C]2-tail p-value[/C][C]1-tail p-value[/C][/ROW]
[ROW][C](Intercept)[/C][C]86.1933134730192[/C][C]1.09882[/C][C]78.4417[/C][C]0[/C][C]0[/C][/ROW]
[ROW][C]vmtot[/C][C]0.135872441268998[/C][C]0.009884[/C][C]13.7461[/C][C]0[/C][C]0[/C][/ROW]
[/TABLE]
Source: https://freestatistics.org/blog/index.php?pk=58462&T=2

Globally Unique Identifier (entire table): ba.freestatistics.org/blog/index.php?pk=58462&T=2

As an alternative you can also use a QR Code:  

The GUIDs for individual cells are displayed in the table below:

Multiple Linear Regression - Ordinary Least Squares
VariableParameterS.D.T-STATH0: parameter = 02-tail p-value1-tail p-value
(Intercept)86.19331347301921.0988278.441700
vmtot0.1358724412689980.00988413.746100


Multiple Linear Regression - Regression Statistics
Multiple R0.902562117697146
R-squared0.814618376301957
Adjusted R-squared0.81030717575084
F-TEST (value)188.953950678736
F-TEST (DF numerator)1
F-TEST (DF denominator)43
p-value0
Multiple Linear Regression - Residual Statistics
Residual Standard Deviation0.341291632139295
Sum Squared Residuals5.00863906123707

\begin{tabular}{lllllllll}
\hline
Multiple Linear Regression - Regression Statistics \tabularnewline
Multiple R & 0.902562117697146 \tabularnewline
R-squared & 0.814618376301957 \tabularnewline
Adjusted R-squared & 0.81030717575084 \tabularnewline
F-TEST (value) & 188.953950678736 \tabularnewline
F-TEST (DF numerator) & 1 \tabularnewline
F-TEST (DF denominator) & 43 \tabularnewline
p-value & 0 \tabularnewline
Multiple Linear Regression - Residual Statistics \tabularnewline
Residual Standard Deviation & 0.341291632139295 \tabularnewline
Sum Squared Residuals & 5.00863906123707 \tabularnewline
\hline
\end{tabular}
%Source: https://freestatistics.org/blog/index.php?pk=58462&T=3

[TABLE]
[ROW][C]Multiple Linear Regression - Regression Statistics[/C][/ROW]
[ROW][C]Multiple R[/C][C]0.902562117697146[/C][/ROW]
[ROW][C]R-squared[/C][C]0.814618376301957[/C][/ROW]
[ROW][C]Adjusted R-squared[/C][C]0.81030717575084[/C][/ROW]
[ROW][C]F-TEST (value)[/C][C]188.953950678736[/C][/ROW]
[ROW][C]F-TEST (DF numerator)[/C][C]1[/C][/ROW]
[ROW][C]F-TEST (DF denominator)[/C][C]43[/C][/ROW]
[ROW][C]p-value[/C][C]0[/C][/ROW]
[ROW][C]Multiple Linear Regression - Residual Statistics[/C][/ROW]
[ROW][C]Residual Standard Deviation[/C][C]0.341291632139295[/C][/ROW]
[ROW][C]Sum Squared Residuals[/C][C]5.00863906123707[/C][/ROW]
[/TABLE]
Source: https://freestatistics.org/blog/index.php?pk=58462&T=3

Globally Unique Identifier (entire table): ba.freestatistics.org/blog/index.php?pk=58462&T=3

As an alternative you can also use a QR Code:  

The GUIDs for individual cells are displayed in the table below:

Multiple Linear Regression - Regression Statistics
Multiple R0.902562117697146
R-squared0.814618376301957
Adjusted R-squared0.81030717575084
F-TEST (value)188.953950678736
F-TEST (DF numerator)1
F-TEST (DF denominator)43
p-value0
Multiple Linear Regression - Residual Statistics
Residual Standard Deviation0.341291632139295
Sum Squared Residuals5.00863906123707


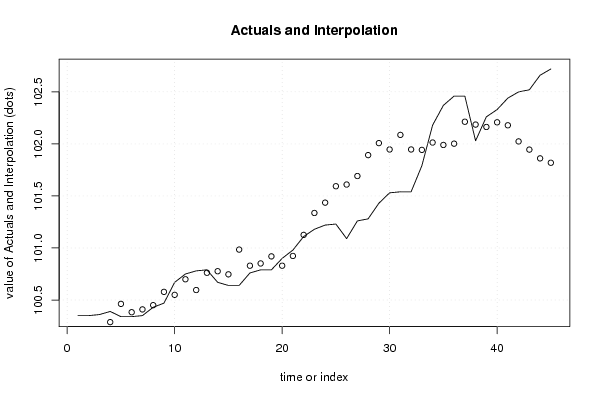
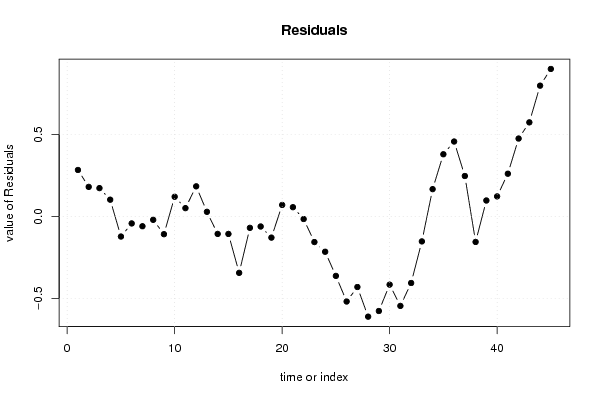
Multiple Linear Regression - Actuals, Interpolation, and Residuals
Time or IndexActualsInterpolationForecastResidualsPrediction Error
1100.35100.0658897265840.284110273416090
2100.35100.1691527819480.180847218051646
3100.36100.1868161993130.173183800686682
4100.39100.2873618058520.102638194147623
5100.34100.462637255089-0.122637255089381
6100.34100.382472514741-0.0424725147406731
7100.35100.409647002994-0.0596470029944803
8100.43100.450408735375-0.0204087353751689
9100.47100.578128830168-0.108128830168035
10100.67100.5495956175020.120404382498459
11100.75100.6990553028970.0509446971025573
12100.78100.5957922475330.184207752466998
13100.79100.7615566258810.0284433741188252
14100.67100.776502594421-0.106502594420769
15100.64100.746610657342-0.106610657341591
16100.64100.984387429562-0.344387429562338
17100.76100.829492846516-0.0694928465156753
18100.79100.851232437119-0.0612324371187134
19100.79100.919168657753-0.129168657753213
20100.9100.8294928465160.0705071534843253
21100.98100.9232448309910.056755169008715
22101.11101.125694768482-0.0156947684820985
23101.18101.336297052449-0.156297052449038
24101.22101.435483934575-0.215483934575416
25101.23101.593095966447-0.363095966447448
26101.09101.609400659400-0.519400659399727
27101.26101.690924124161-0.430924124161126
28101.28101.892015337239-0.612015337239248
29101.43102.007506912318-0.57750691231789
30101.53101.946364313747-0.416364313746846
31101.54102.086312928254-0.54631292825391
32101.54101.946364313747-0.406364313746841
33101.79101.942288140509-0.152288140508771
34102.18102.0129418099690.167058190031349
35102.37101.9898434949530.380156505047077
36102.46102.0020720146670.457927985332857
37102.46102.2126742986340.247325701365908
38102.03102.185499810380-0.155499810380284
39102.26102.1624014953650.0975985046354496
40102.33102.2072394009830.122760599016673
41102.44102.1787061883170.261293811683162
42102.5102.0238116052700.476188394729822
43102.52101.9450055893340.574994410665837
44102.66101.8607646757470.799235324252617
45102.72101.8186442189540.90135578104601

\begin{tabular}{lllllllll}
\hline
Multiple Linear Regression - Actuals, Interpolation, and Residuals \tabularnewline
Time or Index & Actuals & InterpolationForecast & ResidualsPrediction Error \tabularnewline
1 & 100.35 & 100.065889726584 & 0.284110273416090 \tabularnewline
2 & 100.35 & 100.169152781948 & 0.180847218051646 \tabularnewline
3 & 100.36 & 100.186816199313 & 0.173183800686682 \tabularnewline
4 & 100.39 & 100.287361805852 & 0.102638194147623 \tabularnewline
5 & 100.34 & 100.462637255089 & -0.122637255089381 \tabularnewline
6 & 100.34 & 100.382472514741 & -0.0424725147406731 \tabularnewline
7 & 100.35 & 100.409647002994 & -0.0596470029944803 \tabularnewline
8 & 100.43 & 100.450408735375 & -0.0204087353751689 \tabularnewline
9 & 100.47 & 100.578128830168 & -0.108128830168035 \tabularnewline
10 & 100.67 & 100.549595617502 & 0.120404382498459 \tabularnewline
11 & 100.75 & 100.699055302897 & 0.0509446971025573 \tabularnewline
12 & 100.78 & 100.595792247533 & 0.184207752466998 \tabularnewline
13 & 100.79 & 100.761556625881 & 0.0284433741188252 \tabularnewline
14 & 100.67 & 100.776502594421 & -0.106502594420769 \tabularnewline
15 & 100.64 & 100.746610657342 & -0.106610657341591 \tabularnewline
16 & 100.64 & 100.984387429562 & -0.344387429562338 \tabularnewline
17 & 100.76 & 100.829492846516 & -0.0694928465156753 \tabularnewline
18 & 100.79 & 100.851232437119 & -0.0612324371187134 \tabularnewline
19 & 100.79 & 100.919168657753 & -0.129168657753213 \tabularnewline
20 & 100.9 & 100.829492846516 & 0.0705071534843253 \tabularnewline
21 & 100.98 & 100.923244830991 & 0.056755169008715 \tabularnewline
22 & 101.11 & 101.125694768482 & -0.0156947684820985 \tabularnewline
23 & 101.18 & 101.336297052449 & -0.156297052449038 \tabularnewline
24 & 101.22 & 101.435483934575 & -0.215483934575416 \tabularnewline
25 & 101.23 & 101.593095966447 & -0.363095966447448 \tabularnewline
26 & 101.09 & 101.609400659400 & -0.519400659399727 \tabularnewline
27 & 101.26 & 101.690924124161 & -0.430924124161126 \tabularnewline
28 & 101.28 & 101.892015337239 & -0.612015337239248 \tabularnewline
29 & 101.43 & 102.007506912318 & -0.57750691231789 \tabularnewline
30 & 101.53 & 101.946364313747 & -0.416364313746846 \tabularnewline
31 & 101.54 & 102.086312928254 & -0.54631292825391 \tabularnewline
32 & 101.54 & 101.946364313747 & -0.406364313746841 \tabularnewline
33 & 101.79 & 101.942288140509 & -0.152288140508771 \tabularnewline
34 & 102.18 & 102.012941809969 & 0.167058190031349 \tabularnewline
35 & 102.37 & 101.989843494953 & 0.380156505047077 \tabularnewline
36 & 102.46 & 102.002072014667 & 0.457927985332857 \tabularnewline
37 & 102.46 & 102.212674298634 & 0.247325701365908 \tabularnewline
38 & 102.03 & 102.185499810380 & -0.155499810380284 \tabularnewline
39 & 102.26 & 102.162401495365 & 0.0975985046354496 \tabularnewline
40 & 102.33 & 102.207239400983 & 0.122760599016673 \tabularnewline
41 & 102.44 & 102.178706188317 & 0.261293811683162 \tabularnewline
42 & 102.5 & 102.023811605270 & 0.476188394729822 \tabularnewline
43 & 102.52 & 101.945005589334 & 0.574994410665837 \tabularnewline
44 & 102.66 & 101.860764675747 & 0.799235324252617 \tabularnewline
45 & 102.72 & 101.818644218954 & 0.90135578104601 \tabularnewline
\hline
\end{tabular}
%Source: https://freestatistics.org/blog/index.php?pk=58462&T=4

[TABLE]
[ROW][C]Multiple Linear Regression - Actuals, Interpolation, and Residuals[/C][/ROW]
[ROW][C]Time or Index[/C][C]Actuals[/C][C]InterpolationForecast[/C][C]ResidualsPrediction Error[/C][/ROW]
[ROW][C]1[/C][C]100.35[/C][C]100.065889726584[/C][C]0.284110273416090[/C][/ROW]
[ROW][C]2[/C][C]100.35[/C][C]100.169152781948[/C][C]0.180847218051646[/C][/ROW]
[ROW][C]3[/C][C]100.36[/C][C]100.186816199313[/C][C]0.173183800686682[/C][/ROW]
[ROW][C]4[/C][C]100.39[/C][C]100.287361805852[/C][C]0.102638194147623[/C][/ROW]
[ROW][C]5[/C][C]100.34[/C][C]100.462637255089[/C][C]-0.122637255089381[/C][/ROW]
[ROW][C]6[/C][C]100.34[/C][C]100.382472514741[/C][C]-0.0424725147406731[/C][/ROW]
[ROW][C]7[/C][C]100.35[/C][C]100.409647002994[/C][C]-0.0596470029944803[/C][/ROW]
[ROW][C]8[/C][C]100.43[/C][C]100.450408735375[/C][C]-0.0204087353751689[/C][/ROW]
[ROW][C]9[/C][C]100.47[/C][C]100.578128830168[/C][C]-0.108128830168035[/C][/ROW]
[ROW][C]10[/C][C]100.67[/C][C]100.549595617502[/C][C]0.120404382498459[/C][/ROW]
[ROW][C]11[/C][C]100.75[/C][C]100.699055302897[/C][C]0.0509446971025573[/C][/ROW]
[ROW][C]12[/C][C]100.78[/C][C]100.595792247533[/C][C]0.184207752466998[/C][/ROW]
[ROW][C]13[/C][C]100.79[/C][C]100.761556625881[/C][C]0.0284433741188252[/C][/ROW]
[ROW][C]14[/C][C]100.67[/C][C]100.776502594421[/C][C]-0.106502594420769[/C][/ROW]
[ROW][C]15[/C][C]100.64[/C][C]100.746610657342[/C][C]-0.106610657341591[/C][/ROW]
[ROW][C]16[/C][C]100.64[/C][C]100.984387429562[/C][C]-0.344387429562338[/C][/ROW]
[ROW][C]17[/C][C]100.76[/C][C]100.829492846516[/C][C]-0.0694928465156753[/C][/ROW]
[ROW][C]18[/C][C]100.79[/C][C]100.851232437119[/C][C]-0.0612324371187134[/C][/ROW]
[ROW][C]19[/C][C]100.79[/C][C]100.919168657753[/C][C]-0.129168657753213[/C][/ROW]
[ROW][C]20[/C][C]100.9[/C][C]100.829492846516[/C][C]0.0705071534843253[/C][/ROW]
[ROW][C]21[/C][C]100.98[/C][C]100.923244830991[/C][C]0.056755169008715[/C][/ROW]
[ROW][C]22[/C][C]101.11[/C][C]101.125694768482[/C][C]-0.0156947684820985[/C][/ROW]
[ROW][C]23[/C][C]101.18[/C][C]101.336297052449[/C][C]-0.156297052449038[/C][/ROW]
[ROW][C]24[/C][C]101.22[/C][C]101.435483934575[/C][C]-0.215483934575416[/C][/ROW]
[ROW][C]25[/C][C]101.23[/C][C]101.593095966447[/C][C]-0.363095966447448[/C][/ROW]
[ROW][C]26[/C][C]101.09[/C][C]101.609400659400[/C][C]-0.519400659399727[/C][/ROW]
[ROW][C]27[/C][C]101.26[/C][C]101.690924124161[/C][C]-0.430924124161126[/C][/ROW]
[ROW][C]28[/C][C]101.28[/C][C]101.892015337239[/C][C]-0.612015337239248[/C][/ROW]
[ROW][C]29[/C][C]101.43[/C][C]102.007506912318[/C][C]-0.57750691231789[/C][/ROW]
[ROW][C]30[/C][C]101.53[/C][C]101.946364313747[/C][C]-0.416364313746846[/C][/ROW]
[ROW][C]31[/C][C]101.54[/C][C]102.086312928254[/C][C]-0.54631292825391[/C][/ROW]
[ROW][C]32[/C][C]101.54[/C][C]101.946364313747[/C][C]-0.406364313746841[/C][/ROW]
[ROW][C]33[/C][C]101.79[/C][C]101.942288140509[/C][C]-0.152288140508771[/C][/ROW]
[ROW][C]34[/C][C]102.18[/C][C]102.012941809969[/C][C]0.167058190031349[/C][/ROW]
[ROW][C]35[/C][C]102.37[/C][C]101.989843494953[/C][C]0.380156505047077[/C][/ROW]
[ROW][C]36[/C][C]102.46[/C][C]102.002072014667[/C][C]0.457927985332857[/C][/ROW]
[ROW][C]37[/C][C]102.46[/C][C]102.212674298634[/C][C]0.247325701365908[/C][/ROW]
[ROW][C]38[/C][C]102.03[/C][C]102.185499810380[/C][C]-0.155499810380284[/C][/ROW]
[ROW][C]39[/C][C]102.26[/C][C]102.162401495365[/C][C]0.0975985046354496[/C][/ROW]
[ROW][C]40[/C][C]102.33[/C][C]102.207239400983[/C][C]0.122760599016673[/C][/ROW]
[ROW][C]41[/C][C]102.44[/C][C]102.178706188317[/C][C]0.261293811683162[/C][/ROW]
[ROW][C]42[/C][C]102.5[/C][C]102.023811605270[/C][C]0.476188394729822[/C][/ROW]
[ROW][C]43[/C][C]102.52[/C][C]101.945005589334[/C][C]0.574994410665837[/C][/ROW]
[ROW][C]44[/C][C]102.66[/C][C]101.860764675747[/C][C]0.799235324252617[/C][/ROW]
[ROW][C]45[/C][C]102.72[/C][C]101.818644218954[/C][C]0.90135578104601[/C][/ROW]
[/TABLE]
Source: https://freestatistics.org/blog/index.php?pk=58462&T=4

Globally Unique Identifier (entire table): ba.freestatistics.org/blog/index.php?pk=58462&T=4

As an alternative you can also use a QR Code:  

The GUIDs for individual cells are displayed in the table below:

Multiple Linear Regression - Actuals, Interpolation, and Residuals
Time or IndexActualsInterpolationForecastResidualsPrediction Error
1100.35100.0658897265840.284110273416090
2100.35100.1691527819480.180847218051646
3100.36100.1868161993130.173183800686682
4100.39100.2873618058520.102638194147623
5100.34100.462637255089-0.122637255089381
6100.34100.382472514741-0.0424725147406731
7100.35100.409647002994-0.0596470029944803
8100.43100.450408735375-0.0204087353751689
9100.47100.578128830168-0.108128830168035
10100.67100.5495956175020.120404382498459
11100.75100.6990553028970.0509446971025573
12100.78100.5957922475330.184207752466998
13100.79100.7615566258810.0284433741188252
14100.67100.776502594421-0.106502594420769
15100.64100.746610657342-0.106610657341591
16100.64100.984387429562-0.344387429562338
17100.76100.829492846516-0.0694928465156753
18100.79100.851232437119-0.0612324371187134
19100.79100.919168657753-0.129168657753213
20100.9100.8294928465160.0705071534843253
21100.98100.9232448309910.056755169008715
22101.11101.125694768482-0.0156947684820985
23101.18101.336297052449-0.156297052449038
24101.22101.435483934575-0.215483934575416
25101.23101.593095966447-0.363095966447448
26101.09101.609400659400-0.519400659399727
27101.26101.690924124161-0.430924124161126
28101.28101.892015337239-0.612015337239248
29101.43102.007506912318-0.57750691231789
30101.53101.946364313747-0.416364313746846
31101.54102.086312928254-0.54631292825391
32101.54101.946364313747-0.406364313746841
33101.79101.942288140509-0.152288140508771
34102.18102.0129418099690.167058190031349
35102.37101.9898434949530.380156505047077
36102.46102.0020720146670.457927985332857
37102.46102.2126742986340.247325701365908
38102.03102.185499810380-0.155499810380284
39102.26102.1624014953650.0975985046354496
40102.33102.2072394009830.122760599016673
41102.44102.1787061883170.261293811683162
42102.5102.0238116052700.476188394729822
43102.52101.9450055893340.574994410665837
44102.66101.8607646757470.799235324252617
45102.72101.8186442189540.90135578104601


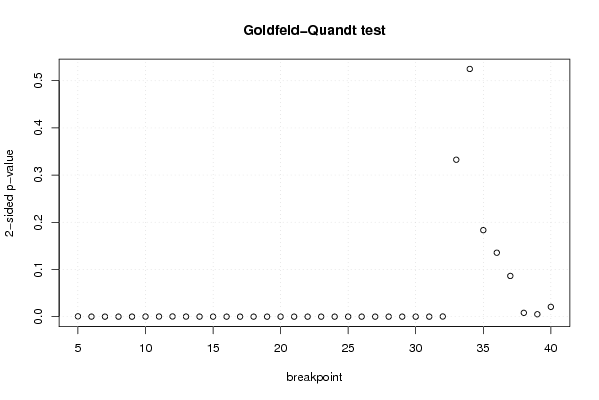
Goldfeld-Quandt test for Heteroskedasticity
p-valuesAlternative Hypothesis
breakpoint indexgreater2-sidedless
50.0003423690944106820.0006847381888213630.99965763090559
62.19631162840807e-054.39262325681614e-050.999978036883716
71.04239163641696e-062.08478327283392e-060.999998957608364
82.46188157367723e-064.92376314735446e-060.999997538118426
91.51631937953053e-063.03263875906105e-060.99999848368062
100.0001095557818561240.0002191115637122480.999890444218144
110.0001357679341252750.000271535868250550.999864232065875
120.0002024202029252200.0004048404058504410.999797579797075
137.13425922918265e-050.0001426851845836530.999928657407708
142.13539224248931e-054.27078448497862e-050.999978646077575
156.10672489369811e-061.22134497873962e-050.999993893275106
164.91325394364517e-069.82650788729034e-060.999995086746056
171.41843882489512e-062.83687764979024e-060.999998581561175
184.12411497536744e-078.24822995073487e-070.999999587588502
199.85092500084599e-081.97018500016920e-070.99999990149075
208.03774541945972e-081.60754908389194e-070.999999919622546
216.6352821021149e-081.32705642042298e-070.999999933647179
223.70526485351663e-087.41052970703326e-080.999999962947351
239.65474930837686e-091.93094986167537e-080.99999999034525
242.20421855835674e-094.40843711671349e-090.999999997795781
256.97163422498064e-101.39432684499613e-090.999999999302837
261.13440742382762e-092.26881484765524e-090.999999998865593
277.55858612668382e-101.51171722533676e-090.999999999244141
283.49207994486241e-096.98415988972483e-090.99999999650792
299.73866646069665e-091.94773329213933e-080.999999990261333
304.97482163301949e-089.94964326603898e-080.999999950251784
314.57861652815101e-079.15723305630201e-070.999999542138347
320.0001562760127236360.0003125520254472730.999843723987276
330.16630092659040.33260185318080.8336990734096
340.7375157614240770.5249684771518470.262484238575923
350.908338993129730.1833220137405410.0916610068702703
360.932252603934490.1354947921310190.0677473960655093
370.956845297458770.08630940508246050.0431547025412303
380.995951647733610.008096704532777990.00404835226638899
390.9974589068350980.005082186329803320.00254109316490166
400.989604788483020.02079042303395850.0103952115169793

\begin{tabular}{lllllllll}
\hline
Goldfeld-Quandt test for Heteroskedasticity \tabularnewline
p-values & Alternative Hypothesis \tabularnewline
breakpoint index & greater & 2-sided & less \tabularnewline
5 & 0.000342369094410682 & 0.000684738188821363 & 0.99965763090559 \tabularnewline
6 & 2.19631162840807e-05 & 4.39262325681614e-05 & 0.999978036883716 \tabularnewline
7 & 1.04239163641696e-06 & 2.08478327283392e-06 & 0.999998957608364 \tabularnewline
8 & 2.46188157367723e-06 & 4.92376314735446e-06 & 0.999997538118426 \tabularnewline
9 & 1.51631937953053e-06 & 3.03263875906105e-06 & 0.99999848368062 \tabularnewline
10 & 0.000109555781856124 & 0.000219111563712248 & 0.999890444218144 \tabularnewline
11 & 0.000135767934125275 & 0.00027153586825055 & 0.999864232065875 \tabularnewline
12 & 0.000202420202925220 & 0.000404840405850441 & 0.999797579797075 \tabularnewline
13 & 7.13425922918265e-05 & 0.000142685184583653 & 0.999928657407708 \tabularnewline
14 & 2.13539224248931e-05 & 4.27078448497862e-05 & 0.999978646077575 \tabularnewline
15 & 6.10672489369811e-06 & 1.22134497873962e-05 & 0.999993893275106 \tabularnewline
16 & 4.91325394364517e-06 & 9.82650788729034e-06 & 0.999995086746056 \tabularnewline
17 & 1.41843882489512e-06 & 2.83687764979024e-06 & 0.999998581561175 \tabularnewline
18 & 4.12411497536744e-07 & 8.24822995073487e-07 & 0.999999587588502 \tabularnewline
19 & 9.85092500084599e-08 & 1.97018500016920e-07 & 0.99999990149075 \tabularnewline
20 & 8.03774541945972e-08 & 1.60754908389194e-07 & 0.999999919622546 \tabularnewline
21 & 6.6352821021149e-08 & 1.32705642042298e-07 & 0.999999933647179 \tabularnewline
22 & 3.70526485351663e-08 & 7.41052970703326e-08 & 0.999999962947351 \tabularnewline
23 & 9.65474930837686e-09 & 1.93094986167537e-08 & 0.99999999034525 \tabularnewline
24 & 2.20421855835674e-09 & 4.40843711671349e-09 & 0.999999997795781 \tabularnewline
25 & 6.97163422498064e-10 & 1.39432684499613e-09 & 0.999999999302837 \tabularnewline
26 & 1.13440742382762e-09 & 2.26881484765524e-09 & 0.999999998865593 \tabularnewline
27 & 7.55858612668382e-10 & 1.51171722533676e-09 & 0.999999999244141 \tabularnewline
28 & 3.49207994486241e-09 & 6.98415988972483e-09 & 0.99999999650792 \tabularnewline
29 & 9.73866646069665e-09 & 1.94773329213933e-08 & 0.999999990261333 \tabularnewline
30 & 4.97482163301949e-08 & 9.94964326603898e-08 & 0.999999950251784 \tabularnewline
31 & 4.57861652815101e-07 & 9.15723305630201e-07 & 0.999999542138347 \tabularnewline
32 & 0.000156276012723636 & 0.000312552025447273 & 0.999843723987276 \tabularnewline
33 & 0.1663009265904 & 0.3326018531808 & 0.8336990734096 \tabularnewline
34 & 0.737515761424077 & 0.524968477151847 & 0.262484238575923 \tabularnewline
35 & 0.90833899312973 & 0.183322013740541 & 0.0916610068702703 \tabularnewline
36 & 0.93225260393449 & 0.135494792131019 & 0.0677473960655093 \tabularnewline
37 & 0.95684529745877 & 0.0863094050824605 & 0.0431547025412303 \tabularnewline
38 & 0.99595164773361 & 0.00809670453277799 & 0.00404835226638899 \tabularnewline
39 & 0.997458906835098 & 0.00508218632980332 & 0.00254109316490166 \tabularnewline
40 & 0.98960478848302 & 0.0207904230339585 & 0.0103952115169793 \tabularnewline
\hline
\end{tabular}
%Source: https://freestatistics.org/blog/index.php?pk=58462&T=5

[TABLE]
[ROW][C]Goldfeld-Quandt test for Heteroskedasticity[/C][/ROW]
[ROW][C]p-values[/C][C]Alternative Hypothesis[/C][/ROW]
[ROW][C]breakpoint index[/C][C]greater[/C][C]2-sided[/C][C]less[/C][/ROW]
[ROW][C]5[/C][C]0.000342369094410682[/C][C]0.000684738188821363[/C][C]0.99965763090559[/C][/ROW]
[ROW][C]6[/C][C]2.19631162840807e-05[/C][C]4.39262325681614e-05[/C][C]0.999978036883716[/C][/ROW]
[ROW][C]7[/C][C]1.04239163641696e-06[/C][C]2.08478327283392e-06[/C][C]0.999998957608364[/C][/ROW]
[ROW][C]8[/C][C]2.46188157367723e-06[/C][C]4.92376314735446e-06[/C][C]0.999997538118426[/C][/ROW]
[ROW][C]9[/C][C]1.51631937953053e-06[/C][C]3.03263875906105e-06[/C][C]0.99999848368062[/C][/ROW]
[ROW][C]10[/C][C]0.000109555781856124[/C][C]0.000219111563712248[/C][C]0.999890444218144[/C][/ROW]
[ROW][C]11[/C][C]0.000135767934125275[/C][C]0.00027153586825055[/C][C]0.999864232065875[/C][/ROW]
[ROW][C]12[/C][C]0.000202420202925220[/C][C]0.000404840405850441[/C][C]0.999797579797075[/C][/ROW]
[ROW][C]13[/C][C]7.13425922918265e-05[/C][C]0.000142685184583653[/C][C]0.999928657407708[/C][/ROW]
[ROW][C]14[/C][C]2.13539224248931e-05[/C][C]4.27078448497862e-05[/C][C]0.999978646077575[/C][/ROW]
[ROW][C]15[/C][C]6.10672489369811e-06[/C][C]1.22134497873962e-05[/C][C]0.999993893275106[/C][/ROW]
[ROW][C]16[/C][C]4.91325394364517e-06[/C][C]9.82650788729034e-06[/C][C]0.999995086746056[/C][/ROW]
[ROW][C]17[/C][C]1.41843882489512e-06[/C][C]2.83687764979024e-06[/C][C]0.999998581561175[/C][/ROW]
[ROW][C]18[/C][C]4.12411497536744e-07[/C][C]8.24822995073487e-07[/C][C]0.999999587588502[/C][/ROW]
[ROW][C]19[/C][C]9.85092500084599e-08[/C][C]1.97018500016920e-07[/C][C]0.99999990149075[/C][/ROW]
[ROW][C]20[/C][C]8.03774541945972e-08[/C][C]1.60754908389194e-07[/C][C]0.999999919622546[/C][/ROW]
[ROW][C]21[/C][C]6.6352821021149e-08[/C][C]1.32705642042298e-07[/C][C]0.999999933647179[/C][/ROW]
[ROW][C]22[/C][C]3.70526485351663e-08[/C][C]7.41052970703326e-08[/C][C]0.999999962947351[/C][/ROW]
[ROW][C]23[/C][C]9.65474930837686e-09[/C][C]1.93094986167537e-08[/C][C]0.99999999034525[/C][/ROW]
[ROW][C]24[/C][C]2.20421855835674e-09[/C][C]4.40843711671349e-09[/C][C]0.999999997795781[/C][/ROW]
[ROW][C]25[/C][C]6.97163422498064e-10[/C][C]1.39432684499613e-09[/C][C]0.999999999302837[/C][/ROW]
[ROW][C]26[/C][C]1.13440742382762e-09[/C][C]2.26881484765524e-09[/C][C]0.999999998865593[/C][/ROW]
[ROW][C]27[/C][C]7.55858612668382e-10[/C][C]1.51171722533676e-09[/C][C]0.999999999244141[/C][/ROW]
[ROW][C]28[/C][C]3.49207994486241e-09[/C][C]6.98415988972483e-09[/C][C]0.99999999650792[/C][/ROW]
[ROW][C]29[/C][C]9.73866646069665e-09[/C][C]1.94773329213933e-08[/C][C]0.999999990261333[/C][/ROW]
[ROW][C]30[/C][C]4.97482163301949e-08[/C][C]9.94964326603898e-08[/C][C]0.999999950251784[/C][/ROW]
[ROW][C]31[/C][C]4.57861652815101e-07[/C][C]9.15723305630201e-07[/C][C]0.999999542138347[/C][/ROW]
[ROW][C]32[/C][C]0.000156276012723636[/C][C]0.000312552025447273[/C][C]0.999843723987276[/C][/ROW]
[ROW][C]33[/C][C]0.1663009265904[/C][C]0.3326018531808[/C][C]0.8336990734096[/C][/ROW]
[ROW][C]34[/C][C]0.737515761424077[/C][C]0.524968477151847[/C][C]0.262484238575923[/C][/ROW]
[ROW][C]35[/C][C]0.90833899312973[/C][C]0.183322013740541[/C][C]0.0916610068702703[/C][/ROW]
[ROW][C]36[/C][C]0.93225260393449[/C][C]0.135494792131019[/C][C]0.0677473960655093[/C][/ROW]
[ROW][C]37[/C][C]0.95684529745877[/C][C]0.0863094050824605[/C][C]0.0431547025412303[/C][/ROW]
[ROW][C]38[/C][C]0.99595164773361[/C][C]0.00809670453277799[/C][C]0.00404835226638899[/C][/ROW]
[ROW][C]39[/C][C]0.997458906835098[/C][C]0.00508218632980332[/C][C]0.00254109316490166[/C][/ROW]
[ROW][C]40[/C][C]0.98960478848302[/C][C]0.0207904230339585[/C][C]0.0103952115169793[/C][/ROW]
[/TABLE]
Source: https://freestatistics.org/blog/index.php?pk=58462&T=5

Globally Unique Identifier (entire table): ba.freestatistics.org/blog/index.php?pk=58462&T=5

As an alternative you can also use a QR Code:  

The GUIDs for individual cells are displayed in the table below:

Goldfeld-Quandt test for Heteroskedasticity
p-valuesAlternative Hypothesis
breakpoint indexgreater2-sidedless
50.0003423690944106820.0006847381888213630.99965763090559
62.19631162840807e-054.39262325681614e-050.999978036883716
71.04239163641696e-062.08478327283392e-060.999998957608364
82.46188157367723e-064.92376314735446e-060.999997538118426
91.51631937953053e-063.03263875906105e-060.99999848368062
100.0001095557818561240.0002191115637122480.999890444218144
110.0001357679341252750.000271535868250550.999864232065875
120.0002024202029252200.0004048404058504410.999797579797075
137.13425922918265e-050.0001426851845836530.999928657407708
142.13539224248931e-054.27078448497862e-050.999978646077575
156.10672489369811e-061.22134497873962e-050.999993893275106
164.91325394364517e-069.82650788729034e-060.999995086746056
171.41843882489512e-062.83687764979024e-060.999998581561175
184.12411497536744e-078.24822995073487e-070.999999587588502
199.85092500084599e-081.97018500016920e-070.99999990149075
208.03774541945972e-081.60754908389194e-070.999999919622546
216.6352821021149e-081.32705642042298e-070.999999933647179
223.70526485351663e-087.41052970703326e-080.999999962947351
239.65474930837686e-091.93094986167537e-080.99999999034525
242.20421855835674e-094.40843711671349e-090.999999997795781
256.97163422498064e-101.39432684499613e-090.999999999302837
261.13440742382762e-092.26881484765524e-090.999999998865593
277.55858612668382e-101.51171722533676e-090.999999999244141
283.49207994486241e-096.98415988972483e-090.99999999650792
299.73866646069665e-091.94773329213933e-080.999999990261333
304.97482163301949e-089.94964326603898e-080.999999950251784
314.57861652815101e-079.15723305630201e-070.999999542138347
320.0001562760127236360.0003125520254472730.999843723987276
330.16630092659040.33260185318080.8336990734096
340.7375157614240770.5249684771518470.262484238575923
350.908338993129730.1833220137405410.0916610068702703
360.932252603934490.1354947921310190.0677473960655093
370.956845297458770.08630940508246050.0431547025412303
380.995951647733610.008096704532777990.00404835226638899
390.9974589068350980.005082186329803320.00254109316490166
400.989604788483020.02079042303395850.0103952115169793


Meta Analysis of Goldfeld-Quandt test for Heteroskedasticity
Description# significant tests% significant testsOK/NOK
1% type I error level300.833333333333333NOK
5% type I error level310.861111111111111NOK
10% type I error level320.888888888888889NOK

\begin{tabular}{lllllllll}
\hline
Meta Analysis of Goldfeld-Quandt test for Heteroskedasticity \tabularnewline
Description & # significant tests & % significant tests & OK/NOK \tabularnewline
1% type I error level & 30 & 0.833333333333333 & NOK \tabularnewline
5% type I error level & 31 & 0.861111111111111 & NOK \tabularnewline
10% type I error level & 32 & 0.888888888888889 & NOK \tabularnewline
\hline
\end{tabular}
%Source: https://freestatistics.org/blog/index.php?pk=58462&T=6

[TABLE]
[ROW][C]Meta Analysis of Goldfeld-Quandt test for Heteroskedasticity[/C][/ROW]
[ROW][C]Description[/C][C]# significant tests[/C][C]% significant tests[/C][C]OK/NOK[/C][/ROW]
[ROW][C]1% type I error level[/C][C]30[/C][C]0.833333333333333[/C][C]NOK[/C][/ROW]
[ROW][C]5% type I error level[/C][C]31[/C][C]0.861111111111111[/C][C]NOK[/C][/ROW]
[ROW][C]10% type I error level[/C][C]32[/C][C]0.888888888888889[/C][C]NOK[/C][/ROW]
[/TABLE]
Source: https://freestatistics.org/blog/index.php?pk=58462&T=6

Globally Unique Identifier (entire table): ba.freestatistics.org/blog/index.php?pk=58462&T=6

As an alternative you can also use a QR Code:  

The GUIDs for individual cells are displayed in the table below:

Meta Analysis of Goldfeld-Quandt test for Heteroskedasticity
Description# significant tests% significant testsOK/NOK
1% type I error level300.833333333333333NOK
5% type I error level310.861111111111111NOK
10% type I error level320.888888888888889NOK


Parameters (Session):
par1 = 1 ; par2 = Do not include Seasonal Dummies ; par3 = No Linear Trend ;
Parameters (R input):
par1 = 1 ; par2 = Do not include Seasonal Dummies ; par3 = No Linear Trend ;
R code (references can be found in the software module):
library(lattice)
library(lmtest)
n25 <- 25 #minimum number of obs. for Goldfeld-Quandt test
par1 <- as.numeric(par1)
x <- t(y)
k <- length(x[1,])
n <- length(x[,1])
x1 <- cbind(x[,par1], x[,1:k!=par1])
mycolnames <- c(colnames(x)[par1], colnames(x)[1:k!=par1])
colnames(x1) <- mycolnames #colnames(x)[par1]
x <- x1
if (par3 == 'First Differences'){
x2 <- array(0, dim=c(n-1,k), dimnames=list(1:(n-1), paste('(1-B)',colnames(x),sep='')))
for (i in 1:n-1) {
for (j in 1:k) {
x2[i,j] <- x[i+1,j] - x[i,j]
}
}
x <- x2
}
if (par2 == 'Include Monthly Dummies'){
x2 <- array(0, dim=c(n,11), dimnames=list(1:n, paste('M', seq(1:11), sep ='')))
for (i in 1:11){
x2[seq(i,n,12),i] <- 1
}
x <- cbind(x, x2)
}
if (par2 == 'Include Quarterly Dummies'){
x2 <- array(0, dim=c(n,3), dimnames=list(1:n, paste('Q', seq(1:3), sep ='')))
for (i in 1:3){
x2[seq(i,n,4),i] <- 1
}
x <- cbind(x, x2)
}
k <- length(x[1,])
if (par3 == 'Linear Trend'){
x <- cbind(x, c(1:n))
colnames(x)[k+1] <- 't'
}
x
k <- length(x[1,])
df <- as.data.frame(x)
(mylm <- lm(df))
(mysum <- summary(mylm))
if (n > n25) {
kp3 <- k + 3
nmkm3 <- n - k - 3
gqarr <- array(NA, dim=c(nmkm3-kp3+1,3))
numgqtests <- 0
numsignificant1 <- 0
numsignificant5 <- 0
numsignificant10 <- 0
for (mypoint in kp3:nmkm3) {
j <- 0
numgqtests <- numgqtests + 1
for (myalt in c('greater', 'two.sided', 'less')) {
j <- j + 1
gqarr[mypoint-kp3+1,j] <- gqtest(mylm, point=mypoint, alternative=myalt)$p.value
}
if (gqarr[mypoint-kp3+1,2] < 0.01) numsignificant1 <- numsignificant1 + 1
if (gqarr[mypoint-kp3+1,2] < 0.05) numsignificant5 <- numsignificant5 + 1
if (gqarr[mypoint-kp3+1,2] < 0.10) numsignificant10 <- numsignificant10 + 1
}
gqarr
}
bitmap(file='test0.png')
plot(x[,1], type='l', main='Actuals and Interpolation', ylab='value of Actuals and Interpolation (dots)', xlab='time or index')
points(x[,1]-mysum$resid)
grid()
dev.off()
bitmap(file='test1.png')
plot(mysum$resid, type='b', pch=19, main='Residuals', ylab='value of Residuals', xlab='time or index')
grid()
dev.off()
bitmap(file='test2.png')
hist(mysum$resid, main='Residual Histogram', xlab='values of Residuals')
grid()
dev.off()
bitmap(file='test3.png')
densityplot(~mysum$resid,col='black',main='Residual Density Plot', xlab='values of Residuals')
dev.off()
bitmap(file='test4.png')
qqnorm(mysum$resid, main='Residual Normal Q-Q Plot')
qqline(mysum$resid)
grid()
dev.off()
(myerror <- as.ts(mysum$resid))
bitmap(file='test5.png')
dum <- cbind(lag(myerror,k=1),myerror)
dum
dum1 <- dum[2:length(myerror),]
dum1
z <- as.data.frame(dum1)
z
plot(z,main=paste('Residual Lag plot, lowess, and regression line'), ylab='values of Residuals', xlab='lagged values of Residuals')
lines(lowess(z))
abline(lm(z))
grid()
dev.off()
bitmap(file='test6.png')
acf(mysum$resid, lag.max=length(mysum$resid)/2, main='Residual Autocorrelation Function')
grid()
dev.off()
bitmap(file='test7.png')
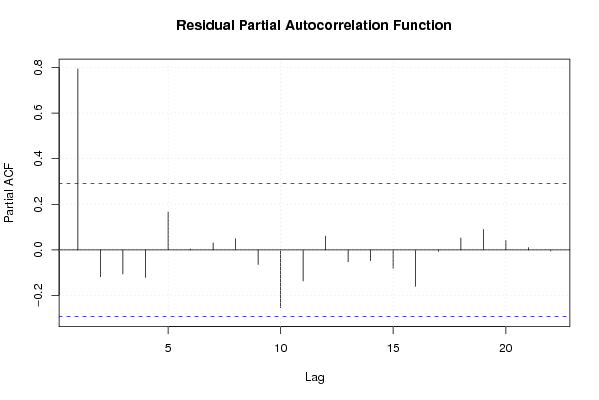
pacf(mysum$resid, lag.max=length(mysum$resid)/2, main='Residual Partial Autocorrelation Function')
grid()
dev.off()
bitmap(file='test8.png')
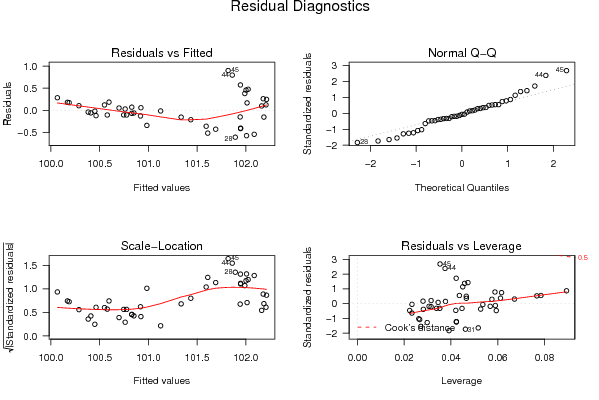
opar <- par(mfrow = c(2,2), oma = c(0, 0, 1.1, 0))
plot(mylm, las = 1, sub='Residual Diagnostics')
par(opar)
dev.off()
if (n > n25) {
bitmap(file='test9.png')
plot(kp3:nmkm3,gqarr[,2], main='Goldfeld-Quandt test',ylab='2-sided p-value',xlab='breakpoint')
grid()
dev.off()
}
load(file='createtable')
a<-table.start()
a<-table.row.start(a)
a<-table.element(a, 'Multiple Linear Regression - Estimated Regression Equation', 1, TRUE)
a<-table.row.end(a)
myeq <- colnames(x)[1]
myeq <- paste(myeq, '[t] = ', sep='')
for (i in 1:k){
if (mysum$coefficients[i,1] > 0) myeq <- paste(myeq, '+', '')
myeq <- paste(myeq, mysum$coefficients[i,1], sep=' ')
if (rownames(mysum$coefficients)[i] != '(Intercept)') {
myeq <- paste(myeq, rownames(mysum$coefficients)[i], sep='')
if (rownames(mysum$coefficients)[i] != 't') myeq <- paste(myeq, '[t]', sep='')
}
}
myeq <- paste(myeq, ' + e[t]')
a<-table.row.start(a)
a<-table.element(a, myeq)
a<-table.row.end(a)
a<-table.end(a)
table.save(a,file='mytable1.tab')
a<-table.start()
a<-table.row.start(a)
a<-table.element(a,hyperlink('ols1.htm','Multiple Linear Regression - Ordinary Least Squares',''), 6, TRUE)
a<-table.row.end(a)
a<-table.row.start(a)
a<-table.element(a,'Variable',header=TRUE)
a<-table.element(a,'Parameter',header=TRUE)
a<-table.element(a,'S.D.',header=TRUE)
a<-table.element(a,'T-STAT
H0: parameter = 0',header=TRUE)
a<-table.element(a,'2-tail p-value',header=TRUE)
a<-table.element(a,'1-tail p-value',header=TRUE)
a<-table.row.end(a)
for (i in 1:k){
a<-table.row.start(a)
a<-table.element(a,rownames(mysum$coefficients)[i],header=TRUE)
a<-table.element(a,mysum$coefficients[i,1])
a<-table.element(a, round(mysum$coefficients[i,2],6))
a<-table.element(a, round(mysum$coefficients[i,3],4))
a<-table.element(a, round(mysum$coefficients[i,4],6))
a<-table.element(a, round(mysum$coefficients[i,4]/2,6))
a<-table.row.end(a)
}
a<-table.end(a)
table.save(a,file='mytable2.tab')
a<-table.start()
a<-table.row.start(a)
a<-table.element(a, 'Multiple Linear Regression - Regression Statistics', 2, TRUE)
a<-table.row.end(a)
a<-table.row.start(a)
a<-table.element(a, 'Multiple R',1,TRUE)
a<-table.element(a, sqrt(mysum$r.squared))
a<-table.row.end(a)
a<-table.row.start(a)
a<-table.element(a, 'R-squared',1,TRUE)
a<-table.element(a, mysum$r.squared)
a<-table.row.end(a)
a<-table.row.start(a)
a<-table.element(a, 'Adjusted R-squared',1,TRUE)
a<-table.element(a, mysum$adj.r.squared)
a<-table.row.end(a)
a<-table.row.start(a)
a<-table.element(a, 'F-TEST (value)',1,TRUE)
a<-table.element(a, mysum$fstatistic[1])
a<-table.row.end(a)
a<-table.row.start(a)
a<-table.element(a, 'F-TEST (DF numerator)',1,TRUE)
a<-table.element(a, mysum$fstatistic[2])
a<-table.row.end(a)
a<-table.row.start(a)
a<-table.element(a, 'F-TEST (DF denominator)',1,TRUE)
a<-table.element(a, mysum$fstatistic[3])
a<-table.row.end(a)
a<-table.row.start(a)
a<-table.element(a, 'p-value',1,TRUE)
a<-table.element(a, 1-pf(mysum$fstatistic[1],mysum$fstatistic[2],mysum$fstatistic[3]))
a<-table.row.end(a)
a<-table.row.start(a)
a<-table.element(a, 'Multiple Linear Regression - Residual Statistics', 2, TRUE)
a<-table.row.end(a)
a<-table.row.start(a)
a<-table.element(a, 'Residual Standard Deviation',1,TRUE)
a<-table.element(a, mysum$sigma)
a<-table.row.end(a)
a<-table.row.start(a)
a<-table.element(a, 'Sum Squared Residuals',1,TRUE)
a<-table.element(a, sum(myerror*myerror))
a<-table.row.end(a)
a<-table.end(a)
table.save(a,file='mytable3.tab')
a<-table.start()
a<-table.row.start(a)
a<-table.element(a, 'Multiple Linear Regression - Actuals, Interpolation, and Residuals', 4, TRUE)
a<-table.row.end(a)
a<-table.row.start(a)
a<-table.element(a, 'Time or Index', 1, TRUE)
a<-table.element(a, 'Actuals', 1, TRUE)
a<-table.element(a, 'Interpolation
Forecast', 1, TRUE)
a<-table.element(a, 'Residuals
Prediction Error', 1, TRUE)
a<-table.row.end(a)
for (i in 1:n) {
a<-table.row.start(a)
a<-table.element(a,i, 1, TRUE)
a<-table.element(a,x[i])
a<-table.element(a,x[i]-mysum$resid[i])
a<-table.element(a,mysum$resid[i])
a<-table.row.end(a)
}
a<-table.end(a)
table.save(a,file='mytable4.tab')
if (n > n25) {
a<-table.start()
a<-table.row.start(a)
a<-table.element(a,'Goldfeld-Quandt test for Heteroskedasticity',4,TRUE)
a<-table.row.end(a)
a<-table.row.start(a)
a<-table.element(a,'p-values',header=TRUE)
a<-table.element(a,'Alternative Hypothesis',3,header=TRUE)
a<-table.row.end(a)
a<-table.row.start(a)
a<-table.element(a,'breakpoint index',header=TRUE)
a<-table.element(a,'greater',header=TRUE)
a<-table.element(a,'2-sided',header=TRUE)
a<-table.element(a,'less',header=TRUE)
a<-table.row.end(a)
for (mypoint in kp3:nmkm3) {
a<-table.row.start(a)
a<-table.element(a,mypoint,header=TRUE)
a<-table.element(a,gqarr[mypoint-kp3+1,1])
a<-table.element(a,gqarr[mypoint-kp3+1,2])
a<-table.element(a,gqarr[mypoint-kp3+1,3])
a<-table.row.end(a)
}
a<-table.end(a)
table.save(a,file='mytable5.tab')
a<-table.start()
a<-table.row.start(a)
a<-table.element(a,'Meta Analysis of Goldfeld-Quandt test for Heteroskedasticity',4,TRUE)
a<-table.row.end(a)
a<-table.row.start(a)
a<-table.element(a,'Description',header=TRUE)
a<-table.element(a,'# significant tests',header=TRUE)
a<-table.element(a,'% significant tests',header=TRUE)
a<-table.element(a,'OK/NOK',header=TRUE)
a<-table.row.end(a)
a<-table.row.start(a)
a<-table.element(a,'1% type I error level',header=TRUE)
a<-table.element(a,numsignificant1)
a<-table.element(a,numsignificant1/numgqtests)
if (numsignificant1/numgqtests < 0.01) dum <- 'OK' else dum <- 'NOK'
a<-table.element(a,dum)
a<-table.row.end(a)
a<-table.row.start(a)
a<-table.element(a,'5% type I error level',header=TRUE)
a<-table.element(a,numsignificant5)
a<-table.element(a,numsignificant5/numgqtests)
if (numsignificant5/numgqtests < 0.05) dum <- 'OK' else dum <- 'NOK'
a<-table.element(a,dum)
a<-table.row.end(a)
a<-table.row.start(a)
a<-table.element(a,'10% type I error level',header=TRUE)
a<-table.element(a,numsignificant10)
a<-table.element(a,numsignificant10/numgqtests)
if (numsignificant10/numgqtests < 0.1) dum <- 'OK' else dum <- 'NOK'
a<-table.element(a,dum)
a<-table.row.end(a)
a<-table.end(a)
table.save(a,file='mytable6.tab')
}