| Multiple Linear Regression - Estimated Regression Equation |
| Y[t] = + 2.42428661862928 -0.0117846612829053X[t] + 1.46617466855599Y1[t] -0.818010407458793Y2[t] -0.0404602516786089Y3[t] + 0.251899520029868Y4[t] + 0.0759909965765519M1[t] + 0.00922654169473366M2[t] -0.169015605044706M3[t] + 0.0500030192168811M4[t] -0.0214506584890375M5[t] -0.125440393745722M6[t] + 0.0393717349680023M7[t] + 0.336062911357132M8[t] -0.489194385002157M9[t] + 0.0466595620924516M10[t] + 0.149763779550361M11[t] -0.00298100774336668t + e[t] |
| Multiple Linear Regression - Ordinary Least Squares | |||||
| Variable | Parameter | S.D. | T-STAT H0: parameter = 0 | 2-tail p-value | 1-tail p-value |
| (Intercept) | 2.42428661862928 | 1.067172 | 2.2717 | 0.028852 | 0.014426 |
| X | -0.0117846612829053 | 0.004771 | -2.4702 | 0.018106 | 0.009053 |
| Y1 | 1.46617466855599 | 0.153913 | 9.526 | 0 | 0 |
| Y2 | -0.818010407458793 | 0.289833 | -2.8224 | 0.007544 | 0.003772 |
| Y3 | -0.0404602516786089 | 0.288756 | -0.1401 | 0.889306 | 0.444653 |
| Y4 | 0.251899520029868 | 0.157692 | 1.5974 | 0.118457 | 0.059228 |
| M1 | 0.0759909965765519 | 0.116485 | 0.6524 | 0.51809 | 0.259045 |
| M2 | 0.00922654169473366 | 0.123248 | 0.0749 | 0.940718 | 0.470359 |
| M3 | -0.169015605044706 | 0.126806 | -1.3329 | 0.190511 | 0.095255 |
| M4 | 0.0500030192168811 | 0.11772 | 0.4248 | 0.673405 | 0.336702 |
| M5 | -0.0214506584890375 | 0.113407 | -0.1891 | 0.850984 | 0.425492 |
| M6 | -0.125440393745722 | 0.107946 | -1.1621 | 0.252457 | 0.126228 |
| M7 | 0.0393717349680023 | 0.110079 | 0.3577 | 0.72257 | 0.361285 |
| M8 | 0.336062911357132 | 0.148666 | 2.2605 | 0.0296 | 0.0148 |
| M9 | -0.489194385002157 | 0.156086 | -3.1341 | 0.003316 | 0.001658 |
| M10 | 0.0466595620924516 | 0.166212 | 0.2807 | 0.780445 | 0.390223 |
| M11 | 0.149763779550361 | 0.14106 | 1.0617 | 0.295073 | 0.147536 |
| t | -0.00298100774336668 | 0.002959 | -1.0076 | 0.320033 | 0.160016 |
| Multiple Linear Regression - Regression Statistics | |
| Multiple R | 0.97972581791468 |
| R-squared | 0.95986267828859 |
| Adjusted R-squared | 0.941906508049273 |
| F-TEST (value) | 53.455868678887 |
| F-TEST (DF numerator) | 17 |
| F-TEST (DF denominator) | 38 |
| p-value | 0 |
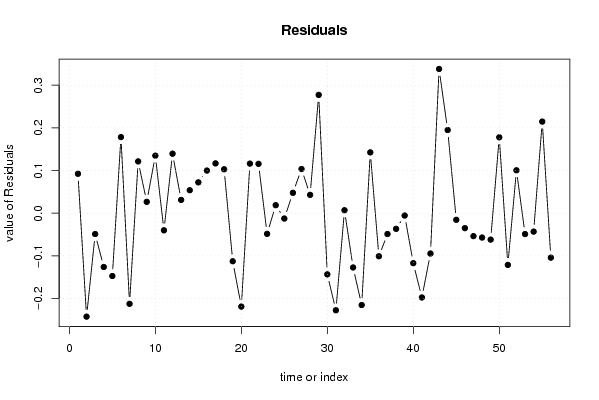
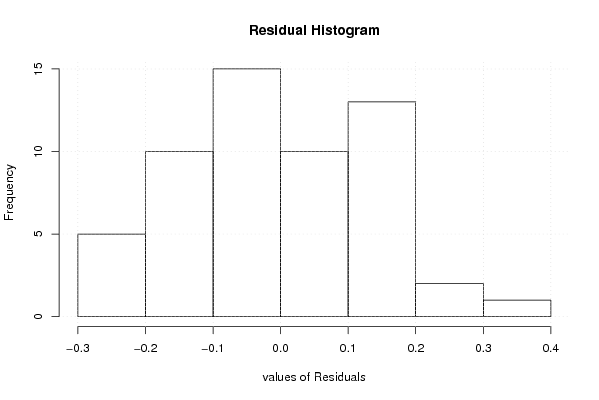
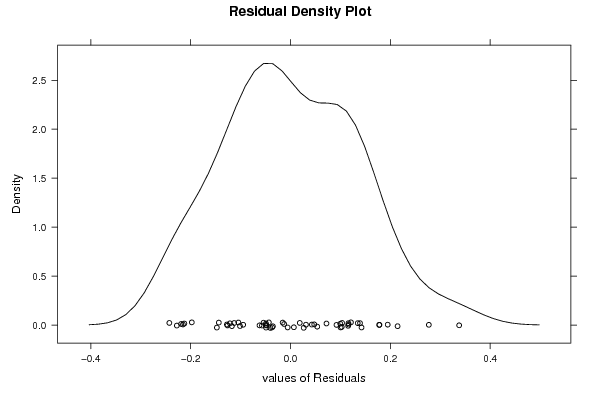
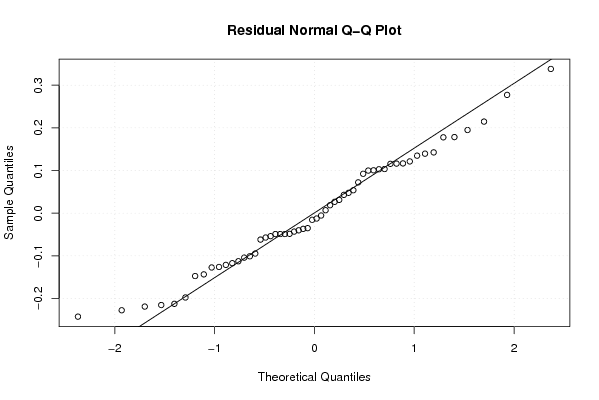
| Multiple Linear Regression - Residual Statistics | |
| Residual Standard Deviation | 0.160319121295799 |
| Sum Squared Residuals | 0.976684384816172 |
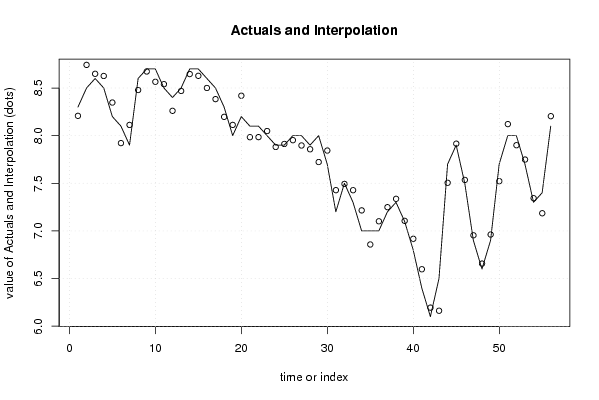
| Multiple Linear Regression - Actuals, Interpolation, and Residuals | |||
| Time or Index | Actuals | Interpolation Forecast | Residuals Prediction Error |
| 1 | 8.3 | 8.20765593790238 | 0.0923440620976185 |
| 2 | 8.5 | 8.74255708556345 | -0.242557085563449 |
| 3 | 8.6 | 8.64892903463709 | -0.0489290346370851 |
| 4 | 8.5 | 8.6260658933297 | -0.126065893329691 |
| 5 | 8.2 | 8.34738139871594 | -0.147381398715937 |
| 6 | 8.1 | 7.92162237796333 | 0.178377622036665 |
| 7 | 7.9 | 8.11248397671017 | -0.212483976710174 |
| 8 | 8.6 | 8.47868184022043 | 0.121318159779571 |
| 9 | 8.7 | 8.67338829836609 | 0.0266117016339067 |
| 10 | 8.7 | 8.5651912081317 | 0.134808791868295 |
| 11 | 8.5 | 8.54016528076808 | -0.0401652807680848 |
| 12 | 8.4 | 8.26057686797475 | 0.139423132025247 |
| 13 | 8.5 | 8.46886024758204 | 0.0311397524179634 |
| 14 | 8.7 | 8.64623153804867 | 0.0537684619513331 |
| 15 | 8.7 | 8.62775146543648 | 0.0722485345635147 |
| 16 | 8.6 | 8.50010735887091 | 0.0998926411290883 |
| 17 | 8.5 | 8.3833596017268 | 0.116640398273208 |
| 18 | 8.3 | 8.19713669956702 | 0.102863300432985 |
| 19 | 8 | 8.11269057050633 | -0.112690570506327 |
| 20 | 8.2 | 8.41894308498233 | -0.218943084982334 |
| 21 | 8.1 | 7.98379212717758 | 0.116207872822419 |
| 22 | 8.1 | 7.98436297366575 | 0.115637026334248 |
| 23 | 8 | 8.04844980006107 | -0.0484498000610658 |
| 24 | 7.9 | 7.88129223955275 | 0.0187077604472520 |
| 25 | 7.9 | 7.91261296153314 | -0.0126129615331387 |
| 26 | 8 | 7.9522838873875 | 0.0477161126124956 |
| 27 | 8 | 7.89653427292517 | 0.103465727074829 |
| 28 | 7.9 | 7.85709416452992 | 0.0429058354700816 |
| 29 | 8 | 7.72273787893555 | 0.277262121064455 |
| 30 | 7.7 | 7.84344934071757 | -0.143449340717567 |
| 31 | 7.2 | 7.42757127300029 | -0.227571273000291 |
| 32 | 7.5 | 7.49308545386603 | 0.00691454613397222 |
| 33 | 7.3 | 7.42729383809563 | -0.127293838095629 |
| 34 | 7 | 7.21534532690719 | -0.215345326907191 |
| 35 | 7 | 6.85752713528143 | 0.142472864718572 |
| 36 | 7 | 7.10101994588258 | -0.101019945882580 |
| 37 | 7.2 | 7.24892085452927 | -0.0489208545292653 |
| 38 | 7.3 | 7.3367386970635 | -0.0367386970635021 |
| 39 | 7.1 | 7.1055338763524 | -0.00553387635240147 |
| 40 | 6.8 | 6.91723107776859 | -0.117231077768592 |
| 41 | 6.4 | 6.5975598924146 | -0.197559892414603 |
| 42 | 6.1 | 6.19458906785141 | -0.0945890678514077 |
| 43 | 6.5 | 6.16192687598934 | 0.338073124010659 |
| 44 | 7.7 | 7.5050638191059 | 0.194936180894101 |
| 45 | 7.9 | 7.9155257363607 | -0.0155257363606966 |
| 46 | 7.5 | 7.53510049129535 | -0.0351004912953519 |
| 47 | 6.9 | 6.95385778388942 | -0.0538577838894216 |
| 48 | 6.6 | 6.65711094658992 | -0.0571109465899182 |
| 49 | 6.9 | 6.96194999845318 | -0.061949998453178 |
| 50 | 7.7 | 7.52218879193688 | 0.177811208063122 |
| 51 | 8 | 8.12125135064886 | -0.121251350648857 |
| 52 | 8 | 7.89950150550089 | 0.100498494499114 |
| 53 | 7.7 | 7.74896122820712 | -0.0489612282071236 |
| 54 | 7.3 | 7.34320251390068 | -0.0432025139006756 |
| 55 | 7.4 | 7.18532730379387 | 0.214672696206132 |
| 56 | 8.1 | 8.2042258018253 | -0.104225801825310 |
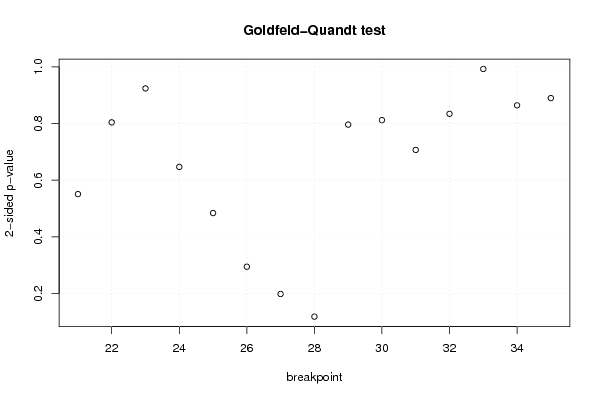
| Goldfeld-Quandt test for Heteroskedasticity | |||
| p-values | Alternative Hypothesis | ||
| breakpoint index | greater | 2-sided | less |
| 21 | 0.724374317667148 | 0.551251364665705 | 0.275625682332853 |
| 22 | 0.597862304208288 | 0.804275391583425 | 0.402137695791712 |
| 23 | 0.462094661380365 | 0.92418932276073 | 0.537905338619635 |
| 24 | 0.323558929560569 | 0.647117859121138 | 0.676441070439431 |
| 25 | 0.242095008985189 | 0.484190017970377 | 0.757904991014811 |
| 26 | 0.147464648512949 | 0.294929297025899 | 0.85253535148705 |
| 27 | 0.0992976801490494 | 0.198595360298099 | 0.90070231985095 |
| 28 | 0.0593390775665934 | 0.118678155133187 | 0.940660922433407 |
| 29 | 0.398156282693252 | 0.796312565386504 | 0.601843717306748 |
| 30 | 0.406069258918802 | 0.812138517837604 | 0.593930741081198 |
| 31 | 0.646502891293402 | 0.706994217413196 | 0.353497108706598 |
| 32 | 0.582804787341909 | 0.834390425316182 | 0.417195212658091 |
| 33 | 0.496355725269014 | 0.992711450538028 | 0.503644274730986 |
| 34 | 0.432167775379326 | 0.864335550758652 | 0.567832224620674 |
| 35 | 0.444949414085393 | 0.889898828170786 | 0.555050585914607 |
| Meta Analysis of Goldfeld-Quandt test for Heteroskedasticity | |||
| Description | # significant tests | % significant tests | OK/NOK |
| 1% type I error level | 0 | 0 | OK |
| 5% type I error level | 0 | 0 | OK |
| 10% type I error level | 0 | 0 | OK |