| Multiple Linear Regression - Estimated Regression Equation |
| Y[t] = + 39.038520381192 + 0.637407184691893X[t] -0.272539382924652M1[t] -0.00150391792607000M2[t] + 0.304227031804597M3[t] + 0.470522460723327M4[t] + 0.608184536264328M5[t] + 0.540258492164768M6[t] + 0.694706519912123M7[t] + 0.735689325948949M8[t] + 0.888275102075635M9[t] + 0.522867621037696M10[t] + 0.269330499234351M11[t] + 0.0686660801794755t + e[t] |
| Multiple Linear Regression - Ordinary Least Squares | |||||
| Variable | Parameter | S.D. | T-STAT H0: parameter = 0 | 2-tail p-value | 1-tail p-value |
| (Intercept) | 39.038520381192 | 23.271399 | 1.6775 | 0.100222 | 0.050111 |
| X | 0.637407184691893 | 0.218535 | 2.9167 | 0.005453 | 0.002727 |
| M1 | -0.272539382924652 | 0.387002 | -0.7042 | 0.484838 | 0.242419 |
| M2 | -0.00150391792607000 | 0.393409 | -0.0038 | 0.996966 | 0.498483 |
| M3 | 0.304227031804597 | 0.37954 | 0.8016 | 0.426925 | 0.213462 |
| M4 | 0.470522460723327 | 0.376334 | 1.2503 | 0.217521 | 0.108761 |
| M5 | 0.608184536264328 | 0.371008 | 1.6393 | 0.107978 | 0.053989 |
| M6 | 0.540258492164768 | 0.370173 | 1.4595 | 0.15123 | 0.075615 |
| M7 | 0.694706519912123 | 0.369284 | 1.8812 | 0.066279 | 0.03314 |
| M8 | 0.735689325948949 | 0.36833 | 1.9974 | 0.05172 | 0.02586 |
| M9 | 0.888275102075635 | 0.37138 | 2.3918 | 0.020909 | 0.010455 |
| M10 | 0.522867621037696 | 0.367904 | 1.4212 | 0.162 | 0.081 |
| M11 | 0.269330499234351 | 0.367935 | 0.732 | 0.467878 | 0.233939 |
| t | 0.0686660801794755 | 0.040555 | 1.6931 | 0.097191 | 0.048596 |
| Multiple Linear Regression - Regression Statistics | |
| Multiple R | 0.987885678348134 |
| R-squared | 0.975918113485352 |
| Adjusted R-squared | 0.969112362948604 |
| F-TEST (value) | 143.39610425269 |
| F-TEST (DF numerator) | 13 |
| F-TEST (DF denominator) | 46 |
| p-value | 0 |
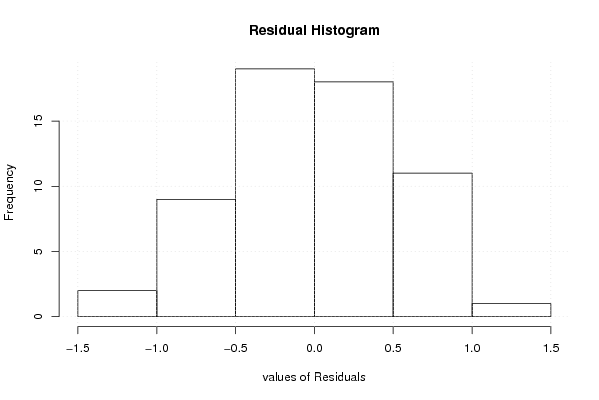
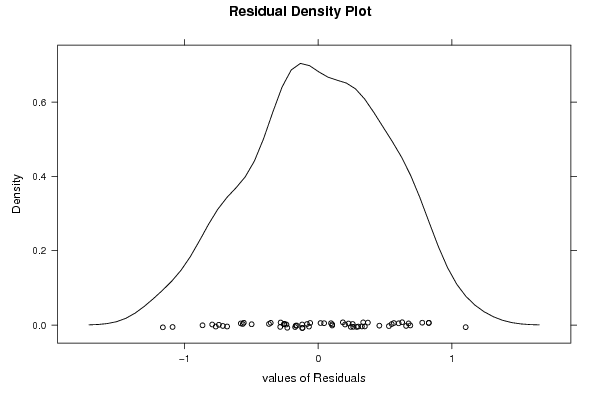
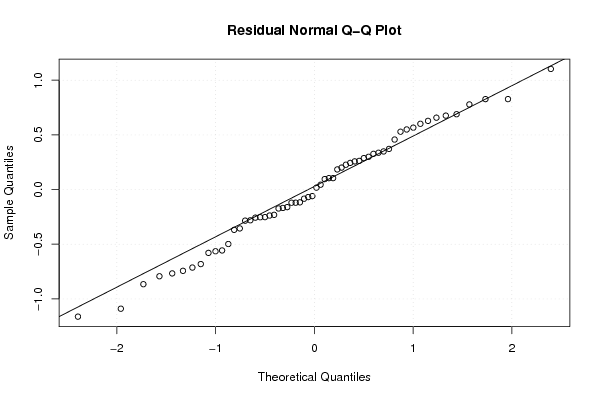
| Multiple Linear Regression - Residual Statistics | |
| Residual Standard Deviation | 0.581204328880177 |
| Sum Squared Residuals | 15.5387297078166 |
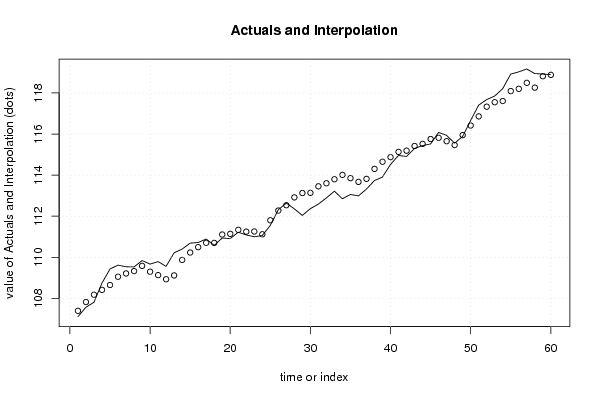
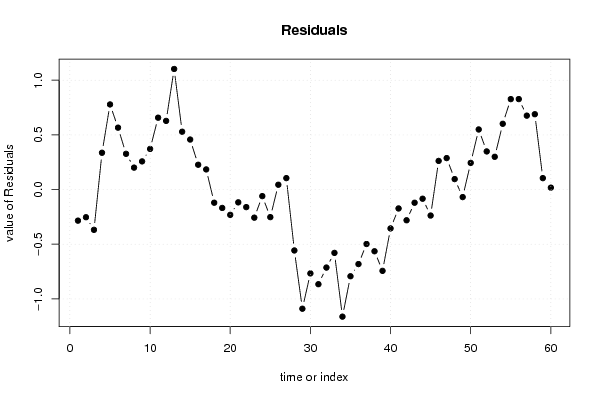
| Multiple Linear Regression - Actuals, Interpolation, and Residuals | |||
| Time or Index | Actuals | Interpolation Forecast | Residuals Prediction Error |
| 1 | 107.11 | 107.394163863906 | -0.284163863906472 |
| 2 | 107.57 | 107.823102414942 | -0.253102414941710 |
| 3 | 107.81 | 108.178377229311 | -0.368377229311087 |
| 4 | 108.75 | 108.413338738409 | 0.336661261590705 |
| 5 | 109.43 | 108.651537253364 | 0.778462746635643 |
| 6 | 109.62 | 109.053843815800 | 0.566156184199835 |
| 7 | 109.54 | 109.213217205258 | 0.326782794742190 |
| 8 | 109.53 | 109.329240163321 | 0.200759836678962 |
| 9 | 109.84 | 109.582362378862 | 0.257637621138211 |
| 10 | 109.67 | 109.298369121697 | 0.371630878302837 |
| 11 | 109.79 | 109.132620295614 | 0.657379704385954 |
| 12 | 109.56 | 108.931955876559 | 0.628044123440825 |
| 13 | 110.22 | 109.116900956476 | 1.10309904352394 |
| 14 | 110.4 | 109.870917171704 | 0.529082828296159 |
| 15 | 110.69 | 110.232566057920 | 0.457433942079853 |
| 16 | 110.72 | 110.493023854406 | 0.226976145593968 |
| 17 | 110.89 | 110.705726081973 | 0.184273918026572 |
| 18 | 110.58 | 110.700092046206 | -0.120092046206423 |
| 19 | 110.94 | 111.108054237694 | -0.168054237693908 |
| 20 | 110.91 | 111.141214261747 | -0.231214261747181 |
| 21 | 111.22 | 111.336969830666 | -0.116969830665660 |
| 22 | 111.09 | 111.250572800756 | -0.160572800755516 |
| 23 | 111 | 111.256923914539 | -0.256923914539225 |
| 24 | 111.06 | 111.120000213954 | -0.0600002139535328 |
| 25 | 111.55 | 111.802122897930 | -0.252122897930094 |
| 26 | 112.32 | 112.275679951893 | 0.0443200481065509 |
| 27 | 112.64 | 112.535343688559 | 0.104656311440953 |
| 28 | 112.36 | 112.916908850136 | -0.556908850136393 |
| 29 | 112.04 | 113.129611077704 | -1.08961107770377 |
| 30 | 112.37 | 113.136725185631 | -0.766725185630614 |
| 31 | 112.59 | 113.455450371261 | -0.865450371261225 |
| 32 | 112.89 | 113.603343688559 | -0.713343688559044 |
| 33 | 113.22 | 113.799099257478 | -0.579099257477537 |
| 34 | 112.85 | 114.012283604373 | -1.16228360437259 |
| 35 | 113.06 | 113.852908850136 | -0.792908850136393 |
| 36 | 112.99 | 113.671366646622 | -0.681366646622274 |
| 37 | 113.32 | 113.818067295458 | -0.498067295457647 |
| 38 | 113.74 | 114.304372493115 | -0.564372493114832 |
| 39 | 113.91 | 114.653273235637 | -0.743273235637301 |
| 40 | 114.52 | 114.875486601042 | -0.355486601041673 |
| 41 | 114.96 | 115.132807331537 | -0.172807331537501 |
| 42 | 114.91 | 115.190914014240 | -0.280914014239678 |
| 43 | 115.3 | 115.420402194013 | -0.120402194013431 |
| 44 | 115.44 | 115.523677008383 | -0.0836770083828088 |
| 45 | 115.52 | 115.757677008383 | -0.237677008382816 |
| 46 | 116.08 | 115.817883630952 | 0.262116369048187 |
| 47 | 115.94 | 115.652134804869 | 0.287865195131308 |
| 48 | 115.56 | 115.464218529508 | 0.0957814704923437 |
| 49 | 115.88 | 115.948744986230 | -0.0687449862297302 |
| 50 | 116.66 | 116.415927968346 | 0.244072031653832 |
| 51 | 117.41 | 116.860439788572 | 0.549560211427583 |
| 52 | 117.68 | 117.331241956007 | 0.348758043993392 |
| 53 | 117.85 | 117.550318255421 | 0.29968174457906 |
| 54 | 118.21 | 117.608424938123 | 0.60157506187688 |
| 55 | 118.92 | 118.092875991774 | 0.827124008226373 |
| 56 | 119.03 | 118.20252487799 | 0.827475122010071 |
| 57 | 119.17 | 118.493891524612 | 0.676108475387803 |
| 58 | 118.95 | 118.260890842223 | 0.689109157777082 |
| 59 | 118.92 | 118.815412134842 | 0.104587865158356 |
| 60 | 118.9 | 118.882458733357 | 0.0175412666426384 |
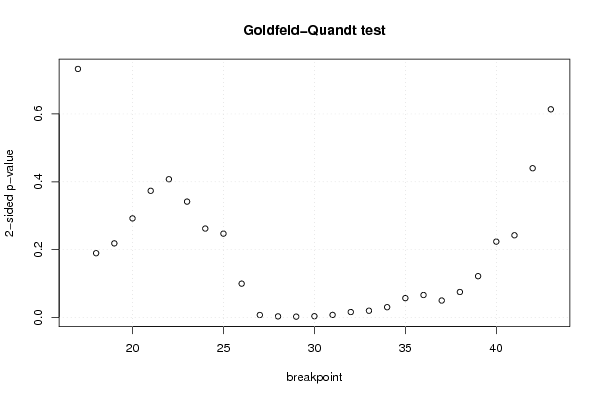
| Goldfeld-Quandt test for Heteroskedasticity | |||
| p-values | Alternative Hypothesis | ||
| breakpoint index | greater | 2-sided | less |
| 17 | 0.633714297600288 | 0.732571404799424 | 0.366285702399712 |
| 18 | 0.90525716021546 | 0.189485679569079 | 0.0947428397845394 |
| 19 | 0.890753582182928 | 0.218492835634143 | 0.109246417817072 |
| 20 | 0.853905320408213 | 0.292189359183575 | 0.146094679591787 |
| 21 | 0.813280553597438 | 0.373438892805123 | 0.186719446402562 |
| 22 | 0.796238745769839 | 0.407522508460323 | 0.203761254230161 |
| 23 | 0.829209460270261 | 0.341581079459477 | 0.170790539729739 |
| 24 | 0.868909749822972 | 0.262180500354055 | 0.131090250177028 |
| 25 | 0.876419112761868 | 0.247161774476263 | 0.123580887238132 |
| 26 | 0.950117758810563 | 0.0997644823788732 | 0.0498822411894366 |
| 27 | 0.996312501355267 | 0.0073749972894665 | 0.00368749864473325 |
| 28 | 0.998312556075217 | 0.00337488784956679 | 0.00168744392478340 |
| 29 | 0.998743015233992 | 0.00251396953201578 | 0.00125698476600789 |
| 30 | 0.998103863807995 | 0.00379227238401088 | 0.00189613619200544 |
| 31 | 0.996172086508782 | 0.00765582698243605 | 0.00382791349121802 |
| 32 | 0.991956301593036 | 0.0160873968139280 | 0.00804369840696402 |
| 33 | 0.990020938706614 | 0.0199581225867714 | 0.00997906129338571 |
| 34 | 0.984804172078043 | 0.0303916558439132 | 0.0151958279219566 |
| 35 | 0.971450543845248 | 0.0570989123095035 | 0.0285494561547517 |
| 36 | 0.966881730679948 | 0.066236538640105 | 0.0331182693200525 |
| 37 | 0.97498584549975 | 0.0500283090004985 | 0.0250141545002493 |
| 38 | 0.962402390807337 | 0.0751952183853261 | 0.0375976091926631 |
| 39 | 0.93909075358029 | 0.121818492839421 | 0.0609092464197106 |
| 40 | 0.88815966161468 | 0.223680676770639 | 0.111840338385320 |
| 41 | 0.87882963765185 | 0.242340724696299 | 0.121170362348150 |
| 42 | 0.780028043183241 | 0.439943913633518 | 0.219971956816759 |
| 43 | 0.693213423959328 | 0.613573152081344 | 0.306786576040672 |
| Meta Analysis of Goldfeld-Quandt test for Heteroskedasticity | |||
| Description | # significant tests | % significant tests | OK/NOK |
| 1% type I error level | 5 | 0.185185185185185 | NOK |
| 5% type I error level | 8 | 0.296296296296296 | NOK |
| 10% type I error level | 13 | 0.481481481481481 | NOK |