| Multiple Linear Regression - Estimated Regression Equation |
| TWIB[t] = + 8.60763772508468 -0.353182385451952GI[t] + 0.392854341237291M1[t] + 0.374045284364414M2[t] + 0.168172579782492M3[t] -0.110636477090391M4[t] -0.294127295418079M5[t] -0.360000000000001M6[t] + 0.421190943127117M7[t] + 0.485872704581921M8[t] + 0.35293635229096M9[t] + 0.0811909431271165M10[t] -0.147063647709040M11[t] + e[t] |
| Multiple Linear Regression - Ordinary Least Squares | |||||
| Variable | Parameter | S.D. | T-STAT H0: parameter = 0 | 2-tail p-value | 1-tail p-value |
| (Intercept) | 8.60763772508468 | 0.337874 | 25.4759 | 0 | 0 |
| GI | -0.353182385451952 | 0.077065 | -4.5829 | 3.4e-05 | 1.7e-05 |
| M1 | 0.392854341237291 | 0.400835 | 0.9801 | 0.33206 | 0.16603 |
| M2 | 0.374045284364414 | 0.400542 | 0.9338 | 0.355155 | 0.177578 |
| M3 | 0.168172579782492 | 0.400376 | 0.42 | 0.676372 | 0.338186 |
| M4 | -0.110636477090391 | 0.400171 | -0.2765 | 0.783397 | 0.391698 |
| M5 | -0.294127295418079 | 0.399886 | -0.7355 | 0.465673 | 0.232836 |
| M6 | -0.360000000000001 | 0.399874 | -0.9003 | 0.372559 | 0.18628 |
| M7 | 0.421190943127117 | 0.399901 | 1.0532 | 0.297616 | 0.148808 |
| M8 | 0.485872704581921 | 0.399886 | 1.215 | 0.230424 | 0.115212 |
| M9 | 0.35293635229096 | 0.399877 | 0.8826 | 0.381938 | 0.190969 |
| M10 | 0.0811909431271165 | 0.399901 | 0.203 | 0.83999 | 0.419995 |
| M11 | -0.147063647709040 | 0.399877 | -0.3678 | 0.714694 | 0.357347 |
| Multiple Linear Regression - Regression Statistics | |
| Multiple R | 0.65086810078016 |
| R-squared | 0.423629284613173 |
| Adjusted R-squared | 0.276470804088877 |
| F-TEST (value) | 2.87872831456174 |
| F-TEST (DF numerator) | 12 |
| F-TEST (DF denominator) | 47 |
| p-value | 0.00472867820596834 |
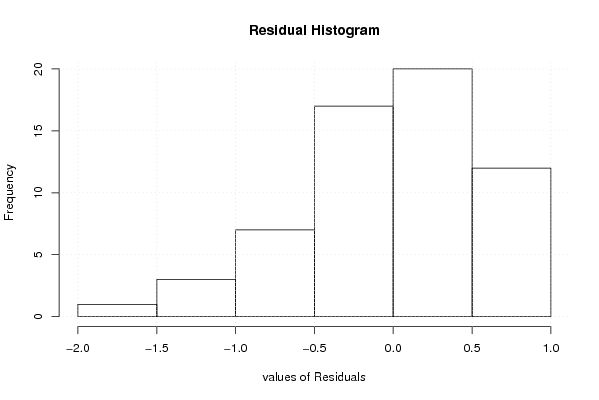
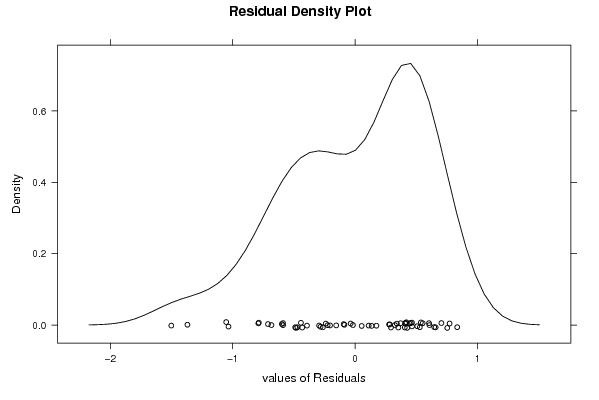
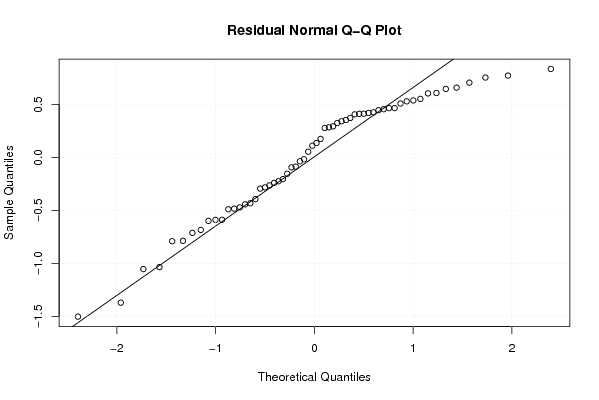
| Multiple Linear Regression - Residual Statistics | |
| Residual Standard Deviation | 0.632256148149712 |
| Sum Squared Residuals | 18.7881483330362 |
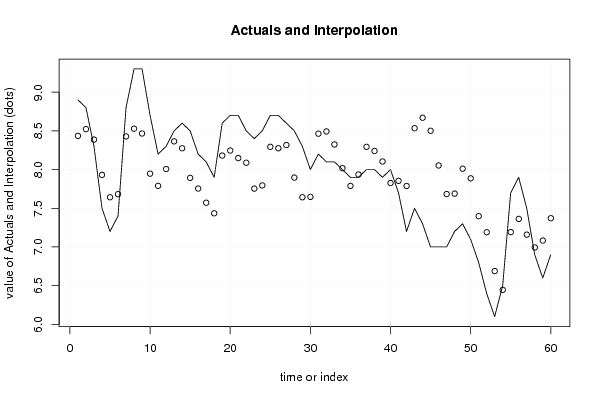
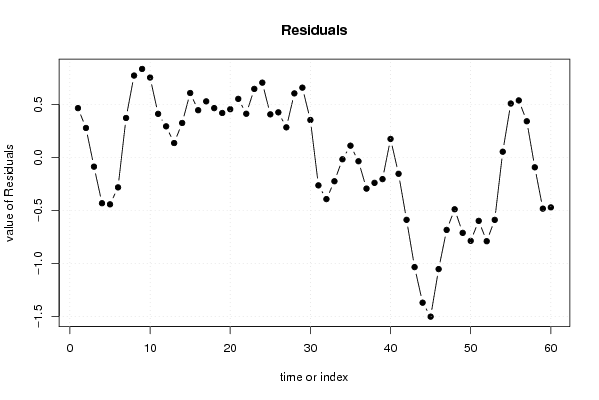
| Multiple Linear Regression - Actuals, Interpolation, and Residuals | |||
| Time or Index | Actuals | Interpolation Forecast | Residuals Prediction Error |
| 1 | 8.9 | 8.43540024959888 | 0.464599750401121 |
| 2 | 8.8 | 8.52254590836156 | 0.277454091638439 |
| 3 | 8.3 | 8.38730968087003 | -0.0873096808700303 |
| 4 | 7.5 | 7.93190943127117 | -0.431909431271172 |
| 5 | 7.2 | 7.6424638973079 | -0.442463897307898 |
| 6 | 7.4 | 7.68254590836156 | -0.282545908361562 |
| 7 | 8.8 | 8.42841861294348 | 0.371581387056518 |
| 8 | 9.3 | 8.52841861294348 | 0.771581387056518 |
| 9 | 9.3 | 8.46611873774291 | 0.833881262257088 |
| 10 | 8.7 | 7.9471456587627 | 0.752854341237297 |
| 11 | 8.2 | 7.78952754501694 | 0.410472454983062 |
| 12 | 8.3 | 8.00722766981637 | 0.292772330183634 |
| 13 | 8.5 | 8.36476377250846 | 0.135236227491537 |
| 14 | 8.6 | 8.2753182385452 | 0.324681761454805 |
| 15 | 8.5 | 7.8928543412373 | 0.607145658762702 |
| 16 | 8.2 | 7.7553182385452 | 0.444681761454804 |
| 17 | 8.1 | 7.57182742021751 | 0.528172579782492 |
| 18 | 7.9 | 7.4353182385452 | 0.464681761454805 |
| 19 | 8.6 | 8.18119094312712 | 0.418809056872882 |
| 20 | 8.7 | 8.24587270458192 | 0.454127295418077 |
| 21 | 8.7 | 8.14825459083616 | 0.551745409163843 |
| 22 | 8.5 | 8.08841861294348 | 0.411581387056516 |
| 23 | 8.4 | 7.75420930647174 | 0.645790693528259 |
| 24 | 8.5 | 7.7953182385452 | 0.704681761454804 |
| 25 | 8.7 | 8.29412729541807 | 0.405872704581927 |
| 26 | 8.7 | 8.2753182385452 | 0.424681761454804 |
| 27 | 8.6 | 8.31667320377964 | 0.28332679622036 |
| 28 | 8.5 | 7.89659119272598 | 0.603408807274024 |
| 29 | 8.3 | 7.6424638973079 | 0.657536102692103 |
| 30 | 8 | 7.64722766981637 | 0.352772330183633 |
| 31 | 8.2 | 8.46373685148868 | -0.263736851488680 |
| 32 | 8.1 | 8.49310037439829 | -0.393100374398289 |
| 33 | 8.1 | 8.32484578356213 | -0.224845783562133 |
| 34 | 8 | 8.0177821358531 | -0.0177821358530932 |
| 35 | 7.9 | 7.78952754501694 | 0.110472454983063 |
| 36 | 7.9 | 7.93659119272598 | -0.0365911927259764 |
| 37 | 8 | 8.29412729541807 | -0.294127295418073 |
| 38 | 8 | 8.24 | -0.24 |
| 39 | 7.9 | 8.10476377250847 | -0.204763772508468 |
| 40 | 8 | 7.82595471563559 | 0.174045284364415 |
| 41 | 7.7 | 7.85437332857907 | -0.154373328579069 |
| 42 | 7.2 | 7.78850062399715 | -0.588500623997148 |
| 43 | 7.5 | 8.53437332857907 | -1.03437332857907 |
| 44 | 7.3 | 8.66969156712426 | -1.36969156712426 |
| 45 | 7 | 8.50143697628811 | -1.50143697628811 |
| 46 | 7 | 8.05310037439829 | -1.05310037439829 |
| 47 | 7 | 7.68357282938135 | -0.683572829381351 |
| 48 | 7.2 | 7.68936352290961 | -0.48936352290961 |
| 49 | 7.3 | 8.01158138705651 | -0.711581387056511 |
| 50 | 7.1 | 7.88681761454805 | -0.786817614548048 |
| 51 | 6.8 | 7.39839900160456 | -0.598399001604565 |
| 52 | 6.4 | 7.19022642182207 | -0.790226421822071 |
| 53 | 6.1 | 6.68887145658763 | -0.588871456587628 |
| 54 | 6.5 | 6.44640755927973 | 0.0535924407202706 |
| 55 | 7.7 | 7.19228026386165 | 0.507719736138349 |
| 56 | 7.9 | 7.36291674095204 | 0.537083259047959 |
| 57 | 7.5 | 7.15934391157069 | 0.34065608842931 |
| 58 | 6.9 | 6.99355321804243 | -0.0935532180424317 |
| 59 | 6.6 | 7.08316277411303 | -0.483162774113033 |
| 60 | 6.9 | 7.37149937600285 | -0.471499376002853 |
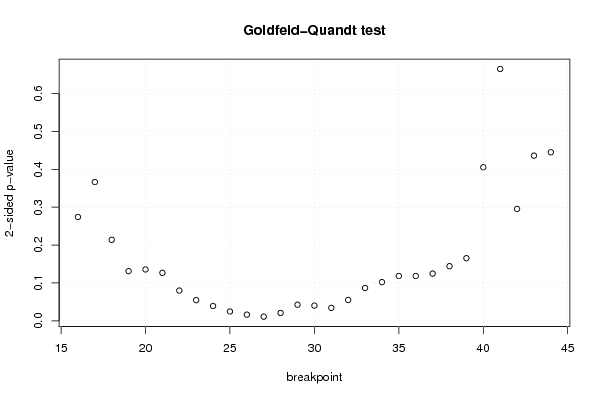
| Goldfeld-Quandt test for Heteroskedasticity | |||
| p-values | Alternative Hypothesis | ||
| breakpoint index | greater | 2-sided | less |
| 16 | 0.137131864230522 | 0.274263728461043 | 0.862868135769478 |
| 17 | 0.183265914157754 | 0.366531828315508 | 0.816734085842246 |
| 18 | 0.106944309658697 | 0.213888619317394 | 0.893055690341303 |
| 19 | 0.0656363183912584 | 0.131272636782517 | 0.934363681608742 |
| 20 | 0.0678727928025737 | 0.135745585605147 | 0.932127207197426 |
| 21 | 0.0633767214806115 | 0.126753442961223 | 0.936623278519388 |
| 22 | 0.039984051266795 | 0.07996810253359 | 0.960015948733205 |
| 23 | 0.0272920432912573 | 0.0545840865825146 | 0.972707956708743 |
| 24 | 0.0195943489384082 | 0.0391886978768163 | 0.980405651061592 |
| 25 | 0.0122971280938679 | 0.0245942561877358 | 0.987702871906132 |
| 26 | 0.00814074004471278 | 0.0162814800894256 | 0.991859259955287 |
| 27 | 0.00551291287994843 | 0.0110258257598969 | 0.994487087120052 |
| 28 | 0.0103628550259667 | 0.0207257100519333 | 0.989637144974033 |
| 29 | 0.0213198915970755 | 0.0426397831941511 | 0.978680108402924 |
| 30 | 0.0201054472101092 | 0.0402108944202184 | 0.97989455278989 |
| 31 | 0.0171065499792461 | 0.0342130999584922 | 0.982893450020754 |
| 32 | 0.0275980588693543 | 0.0551961177387085 | 0.972401941130646 |
| 33 | 0.0433881974510744 | 0.0867763949021488 | 0.956611802548926 |
| 34 | 0.051120578365403 | 0.102241156730806 | 0.948879421634597 |
| 35 | 0.0592118104646421 | 0.118423620929284 | 0.940788189535358 |
| 36 | 0.0591438199298446 | 0.118287639859689 | 0.940856180070155 |
| 37 | 0.0624043755829381 | 0.124808751165876 | 0.937595624417062 |
| 38 | 0.0721441672557746 | 0.144288334511549 | 0.927855832744225 |
| 39 | 0.0827058208301824 | 0.165411641660365 | 0.917294179169818 |
| 40 | 0.20276950789919 | 0.40553901579838 | 0.79723049210081 |
| 41 | 0.667402999938511 | 0.665194000122977 | 0.332597000061489 |
| 42 | 0.852162565608627 | 0.295674868782747 | 0.147837434391373 |
| 43 | 0.781878129806175 | 0.436243740387649 | 0.218121870193825 |
| 44 | 0.777428403724546 | 0.445143192550907 | 0.222571596275454 |
| Meta Analysis of Goldfeld-Quandt test for Heteroskedasticity | |||
| Description | # significant tests | % significant tests | OK/NOK |
| 1% type I error level | 0 | 0 | OK |
| 5% type I error level | 8 | 0.275862068965517 | NOK |
| 10% type I error level | 12 | 0.413793103448276 | NOK |