| Multiple Linear Regression - Estimated Regression Equation |
| TWIB[t] = + 0.86793374916331 + 0.0509126058020017GI[t] + 1.47563767426721TWIB1[t] -0.787676888382591TWIB2[t] -0.140644079346224TWIB3[t] + 0.349848893647999TWIB4[t] -0.144827600397996M1[t] -0.118927642048376M2[t] + 0.608833924114353M3[t] -0.392339280785223M4[t] -0.00254042804679102M5[t] + 0.120655167502287M6[t] + 0.0123581916177904M7[t] + 0.162523576349744M8[t] + 0.0094586184244671M9[t] -0.104618718579842M10[t] -0.0223453107403499M11[t] -0.00703422898260113t + e[t] |
| Multiple Linear Regression - Ordinary Least Squares | |||||
| Variable | Parameter | S.D. | T-STAT H0: parameter = 0 | 2-tail p-value | 1-tail p-value |
| (Intercept) | 0.86793374916331 | 0.677724 | 1.2807 | 0.208075 | 0.104037 |
| GI | 0.0509126058020017 | 0.028725 | 1.7724 | 0.084341 | 0.042171 |
| TWIB1 | 1.47563767426721 | 0.136411 | 10.8176 | 0 | 0 |
| TWIB2 | -0.787676888382591 | 0.261456 | -3.0127 | 0.00459 | 0.002295 |
| TWIB3 | -0.140644079346224 | 0.262464 | -0.5359 | 0.595177 | 0.297589 |
| TWIB4 | 0.349848893647999 | 0.144111 | 2.4276 | 0.020045 | 0.010022 |
| M1 | -0.144827600397996 | 0.102505 | -1.4129 | 0.16583 | 0.082915 |
| M2 | -0.118927642048376 | 0.105678 | -1.1254 | 0.267487 | 0.133743 |
| M3 | 0.608833924114353 | 0.107385 | 5.6697 | 2e-06 | 1e-06 |
| M4 | -0.392339280785223 | 0.140127 | -2.7999 | 0.007991 | 0.003996 |
| M5 | -0.00254042804679102 | 0.154355 | -0.0165 | 0.986955 | 0.493477 |
| M6 | 0.120655167502287 | 0.12274 | 0.983 | 0.33182 | 0.16591 |
| M7 | 0.0123581916177904 | 0.10025 | 0.1233 | 0.90254 | 0.45127 |
| M8 | 0.162523576349744 | 0.103143 | 1.5757 | 0.123384 | 0.061692 |
| M9 | 0.0094586184244671 | 0.11174 | 0.0846 | 0.932985 | 0.466493 |
| M10 | -0.104618718579842 | 0.11305 | -0.9254 | 0.360586 | 0.180293 |
| M11 | -0.0223453107403499 | 0.106781 | -0.2093 | 0.83536 | 0.41768 |
| t | -0.00703422898260113 | 0.002396 | -2.9355 | 0.005625 | 0.002812 |
| Multiple Linear Regression - Regression Statistics | |
| Multiple R | 0.986273371796106 |
| R-squared | 0.97273516391406 |
| Adjusted R-squared | 0.960537737244034 |
| F-TEST (value) | 79.7492118812622 |
| F-TEST (DF numerator) | 17 |
| F-TEST (DF denominator) | 38 |
| p-value | 0 |
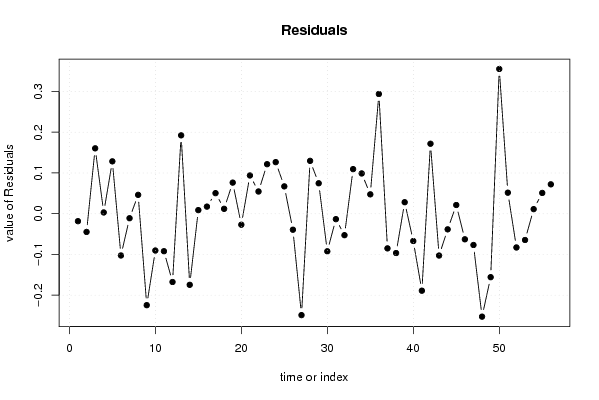
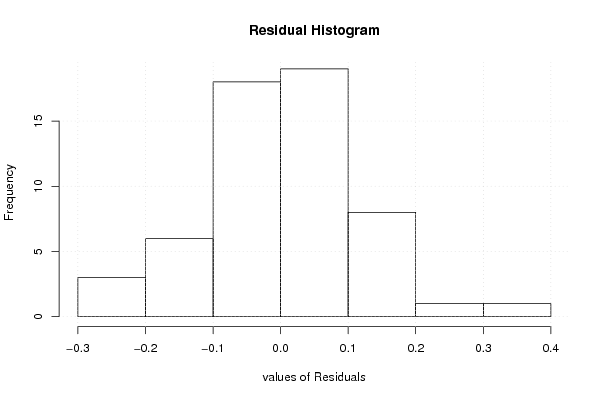
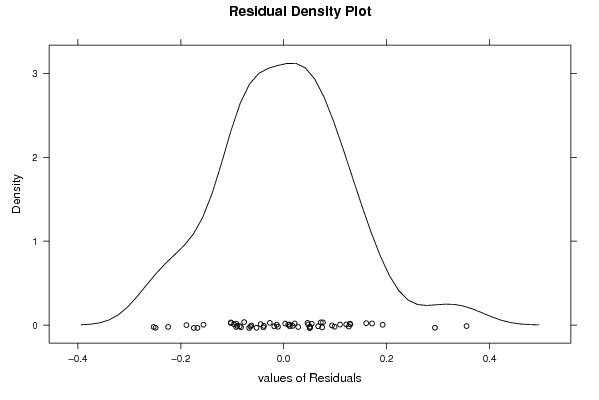
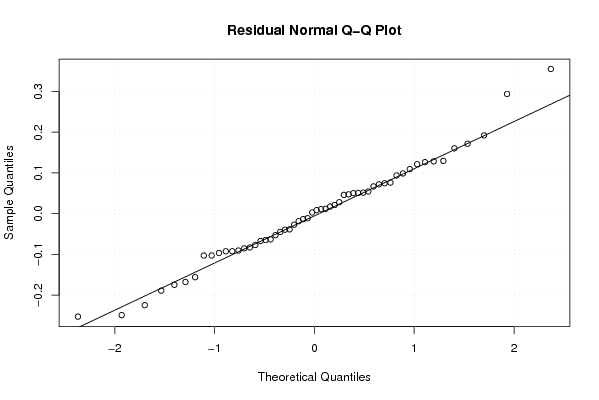
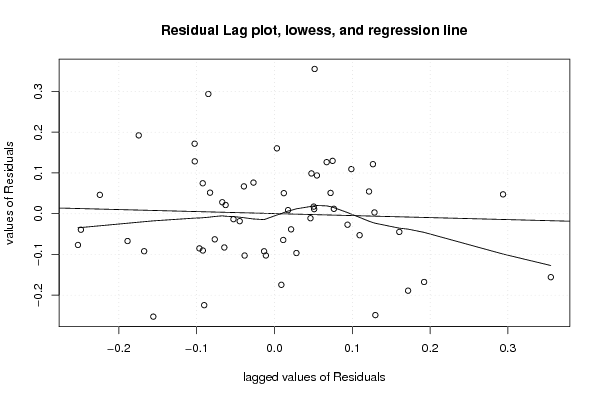
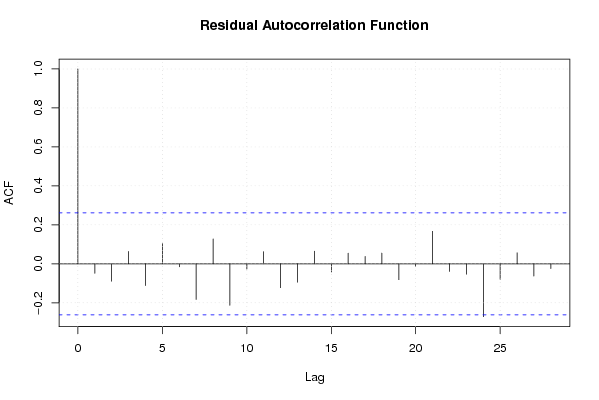
| Multiple Linear Regression - Residual Statistics | |
| Residual Standard Deviation | 0.147760839247470 |
| Sum Squared Residuals | 0.829664093374437 |
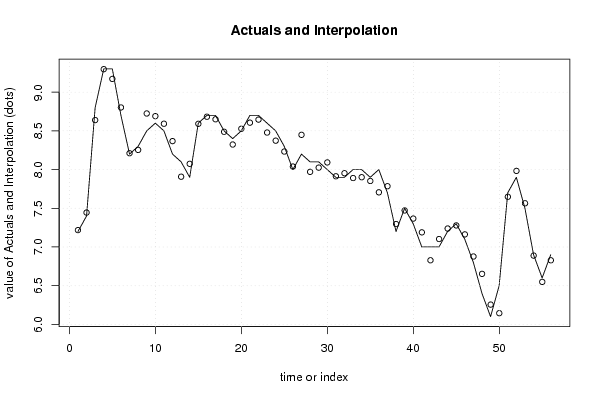
| Multiple Linear Regression - Actuals, Interpolation, and Residuals | |||
| Time or Index | Actuals | Interpolation Forecast | Residuals Prediction Error |
| 1 | 7.2 | 7.21835750945546 | -0.0183575094554583 |
| 2 | 7.4 | 7.44473681581612 | -0.0447368158161163 |
| 3 | 8.8 | 8.63957683159764 | 0.160423168402361 |
| 4 | 9.3 | 9.2969496123183 | 0.00305038768170033 |
| 5 | 9.3 | 9.17151942434806 | 0.128480575651940 |
| 6 | 8.7 | 8.80254923842953 | -0.102549238429532 |
| 7 | 8.2 | 8.2111193192758 | -0.0111193192757963 |
| 8 | 8.3 | 8.2537796965847 | 0.0462203034153002 |
| 9 | 8.5 | 8.72456042948277 | -0.224560429482775 |
| 10 | 8.6 | 8.69040393415576 | -0.0904039341557564 |
| 11 | 8.5 | 8.59213895090523 | -0.0921389509052281 |
| 12 | 8.2 | 8.36760960757275 | -0.167609607572754 |
| 13 | 8.1 | 7.90772953554523 | 0.19227046445477 |
| 14 | 7.9 | 8.07456638246013 | -0.174566382460129 |
| 15 | 8.6 | 8.59123346864434 | 0.00876653135565657 |
| 16 | 8.7 | 8.68261752426595 | 0.0173824757340503 |
| 17 | 8.7 | 8.64962475950493 | 0.0503752404950684 |
| 18 | 8.5 | 8.48805023947999 | 0.0119497605200076 |
| 19 | 8.4 | 8.32369509911903 | 0.0763049008809687 |
| 20 | 8.5 | 8.52705653622358 | -0.0270565362235826 |
| 21 | 8.7 | 8.60614383970933 | 0.0938561602906723 |
| 22 | 8.7 | 8.64548674894262 | 0.0545132510573787 |
| 23 | 8.6 | 8.47850242876217 | 0.121497571237829 |
| 24 | 8.5 | 8.37347085890956 | 0.126529141090445 |
| 25 | 8.3 | 8.2329652508305 | 0.0670347491695038 |
| 26 | 8 | 8.03935302095656 | -0.039353020956557 |
| 27 | 8.2 | 8.44891269152266 | -0.248912691522662 |
| 28 | 8.1 | 7.97037104609335 | 0.129628953906652 |
| 29 | 8.1 | 8.02535123040041 | 0.0746487695995913 |
| 30 | 8 | 8.0922880624217 | -0.0922880624216998 |
| 31 | 7.9 | 7.9134272767921 | -0.0134272767921033 |
| 32 | 7.9 | 7.9527774645882 | -0.0527774645881952 |
| 33 | 8 | 7.8906016350334 | 0.109398364966601 |
| 34 | 8 | 7.90122461562323 | 0.098775384376769 |
| 35 | 7.9 | 7.85252869511666 | 0.0474713048833375 |
| 36 | 8 | 7.70621160151307 | 0.293788398486931 |
| 37 | 7.7 | 7.78511855428105 | -0.0851185542810496 |
| 38 | 7.2 | 7.29658970046427 | -0.096589700464271 |
| 39 | 7.5 | 7.47184323030635 | 0.0281567696936487 |
| 40 | 7.3 | 7.3671611349039 | -0.067161134903898 |
| 41 | 7 | 7.18895378945042 | -0.188953789450422 |
| 42 | 7 | 6.82829786368639 | 0.171702136313610 |
| 43 | 7 | 7.10271825161851 | -0.102718251618515 |
| 44 | 7.2 | 7.23843789476294 | -0.038437894762935 |
| 45 | 7.3 | 7.2786940957745 | 0.0213059042255011 |
| 46 | 7.1 | 7.16288470127839 | -0.0628847012783912 |
| 47 | 6.8 | 6.87682992521594 | -0.0768299252159383 |
| 48 | 6.4 | 6.65270793200462 | -0.252707932004621 |
| 49 | 6.1 | 6.25582914988777 | -0.155829149887766 |
| 50 | 6.5 | 6.14475408030293 | 0.355245919697073 |
| 51 | 7.7 | 7.648433777929 | 0.0515662220709958 |
| 52 | 7.9 | 7.9829006824185 | -0.0829006824185043 |
| 53 | 7.5 | 7.56455079629618 | -0.0645507962961778 |
| 54 | 6.9 | 6.88881459598239 | 0.0111854040176149 |
| 55 | 6.6 | 6.54904005319455 | 0.0509599468054454 |
| 56 | 6.9 | 6.82794840784059 | 0.0720515921594126 |
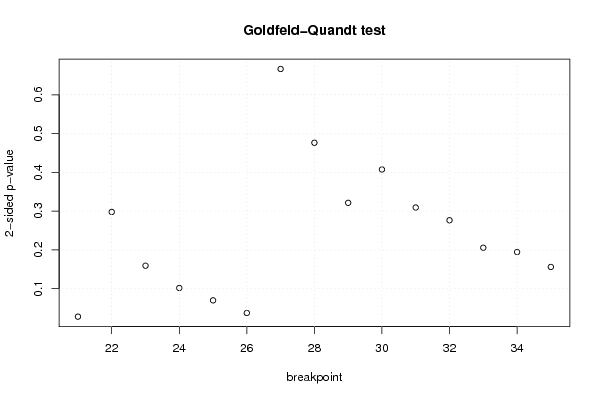
| Goldfeld-Quandt test for Heteroskedasticity | |||
| p-values | Alternative Hypothesis | ||
| breakpoint index | greater | 2-sided | less |
| 21 | 0.0139035117817499 | 0.0278070235634999 | 0.98609648821825 |
| 22 | 0.148972647864848 | 0.297945295729697 | 0.851027352135152 |
| 23 | 0.0795953210646793 | 0.159190642129359 | 0.92040467893532 |
| 24 | 0.0508452612096893 | 0.101690522419379 | 0.94915473879031 |
| 25 | 0.0349366492121456 | 0.0698732984242912 | 0.965063350787854 |
| 26 | 0.0186254335708494 | 0.0372508671416988 | 0.98137456642915 |
| 27 | 0.333318578890394 | 0.666637157780787 | 0.666681421109606 |
| 28 | 0.238143867425734 | 0.476287734851468 | 0.761856132574266 |
| 29 | 0.160672825485881 | 0.321345650971763 | 0.839327174514119 |
| 30 | 0.203686178917709 | 0.407372357835417 | 0.796313821082291 |
| 31 | 0.154623016112308 | 0.309246032224616 | 0.845376983887692 |
| 32 | 0.138215763811601 | 0.276431527623202 | 0.861784236188399 |
| 33 | 0.102779537436283 | 0.205559074872566 | 0.897220462563717 |
| 34 | 0.0972451230109546 | 0.194490246021909 | 0.902754876989045 |
| 35 | 0.0779957692425929 | 0.155991538485186 | 0.922004230757407 |
| Meta Analysis of Goldfeld-Quandt test for Heteroskedasticity | |||
| Description | # significant tests | % significant tests | OK/NOK |
| 1% type I error level | 0 | 0 | OK |
| 5% type I error level | 2 | 0.133333333333333 | NOK |
| 10% type I error level | 3 | 0.2 | NOK |