Free Statistics

of Irreproducible Research!

Author's title

Author*The author of this computation has been verified*
R Software Modulerwasp_multipleregression.wasp
Title produced by softwareMultiple Regression
Date of computationFri, 20 Nov 2009 15:52:44 -0700
Cite this page as followsStatistical Computations at FreeStatistics.org, Office for Research Development and Education, URL https://freestatistics.org/blog/index.php?v=date/2009/Nov/20/t1258757703xs8mix3ikv1zve7.htm/, Retrieved Sat, 20 Apr 2024 10:36:00 +0000
Statistical Computations at FreeStatistics.org, Office for Research Development and Education, URL https://freestatistics.org/blog/index.php?pk=58484, Retrieved Sat, 20 Apr 2024 10:36:00 +0000
QR Codes:

Original text written by user:
IsPrivate?No (this computation is public)
User-defined keywords
Estimated Impact153
Family? (F = Feedback message, R = changed R code, M = changed R Module, P = changed Parameters, D = changed Data)
-     [Multiple Regression] [Q1 The Seatbeltlaw] [2007-11-14 19:27:43] [8cd6641b921d30ebe00b648d1481bba0]
- RMPD  [Multiple Regression] [Seatbelt] [2009-11-12 13:54:52] [b98453cac15ba1066b407e146608df68]
-    D    [Multiple Regression] [] [2009-11-20 07:36:00] [5d885a68c2332cc44f6191ec94766bfa]
-   PD        [Multiple Regression] [Model2] [2009-11-20 22:52:44] [82f29a5d509ab8039aab37a0145f886d] [Current]
Feedback Forum

Post a new message
Dataseries X:
562	13.9
561	15.9
555	18.2
544	19.7
537	20.1
543	19.9
594	20
611	22.6
613	20.6
611	20.1
594	20.2
595	21.8
591	22
589	19.5
584	17.5
573	18.2
567	18.8
569	19.7
621	18.8
629	18.5
628	18.7
612	18.5
595	19.3
597	18.9
593	21.4
590	22.5
580	25
574	22.9
573	22.9
573	21.3
620	22.3
626	20.9
620	19.9
588	20.2
566	19.8
557	17.7
561	18.1
549	17.6
532	18.2
526	16
511	16.3
499	17.3
555	19
565	18.6
542	18
527	17.9
510	17.8
514	18.5
517	17.4
508	19
493	17.4
490	20.6
469	18.5
478	20
528	18.8
534	18.8
518	19.7
506	15.3
502	10.6
516	6.1
528	0.9


Summary of computational transaction
Raw Inputview raw input (R code)
Raw Outputview raw output of R engine
Computing time4 seconds
R Server'Gwilym Jenkins' @ 72.249.127.135

\begin{tabular}{lllllllll}
\hline
Summary of computational transaction \tabularnewline
Raw Input & view raw input (R code)  \tabularnewline
Raw Output & view raw output of R engine  \tabularnewline
Computing time & 4 seconds \tabularnewline
R Server & 'Gwilym Jenkins' @ 72.249.127.135 \tabularnewline
\hline
\end{tabular}
%Source: https://freestatistics.org/blog/index.php?pk=58484&T=0

[TABLE]
[ROW][C]Summary of computational transaction[/C][/ROW]
[ROW][C]Raw Input[/C][C]view raw input (R code) [/C][/ROW]
[ROW][C]Raw Output[/C][C]view raw output of R engine [/C][/ROW]
[ROW][C]Computing time[/C][C]4 seconds[/C][/ROW]
[ROW][C]R Server[/C][C]'Gwilym Jenkins' @ 72.249.127.135[/C][/ROW]
[/TABLE]
Source: https://freestatistics.org/blog/index.php?pk=58484&T=0

Globally Unique Identifier (entire table): ba.freestatistics.org/blog/index.php?pk=58484&T=0

As an alternative you can also use a QR Code:  

The GUIDs for individual cells are displayed in the table below:

Summary of computational transaction
Raw Inputview raw input (R code)
Raw Outputview raw output of R engine
Computing time4 seconds
R Server'Gwilym Jenkins' @ 72.249.127.135


Multiple Linear Regression - Estimated Regression Equation
Y[t] = + 471.932069124408 + 5.05228499250553X[t] + 7.83474690929715M1[t] -8.0202554827627M2[t] -20.4390780800647M3[t] -28.9505807784159M4[t] -38.1422151796150M5[t] -38.7589463772168M6[t] + 11.7337337238324M7[t] + 20.6285052245819M8[t] + 14.3546477208346M9[t] + 3.90588701349005M10[t] -7.14914789295519M11[t] + e[t]

\begin{tabular}{lllllllll}
\hline
Multiple Linear Regression - Estimated Regression Equation \tabularnewline
Y[t] =  +  471.932069124408 +  5.05228499250553X[t] +  7.83474690929715M1[t] -8.0202554827627M2[t] -20.4390780800647M3[t] -28.9505807784159M4[t] -38.1422151796150M5[t] -38.7589463772168M6[t] +  11.7337337238324M7[t] +  20.6285052245819M8[t] +  14.3546477208346M9[t] +  3.90588701349005M10[t] -7.14914789295519M11[t]  + e[t] \tabularnewline
\hline
\end{tabular}
%Source: https://freestatistics.org/blog/index.php?pk=58484&T=1

[TABLE]
[ROW][C]Multiple Linear Regression - Estimated Regression Equation[/C][/ROW]
[ROW][C]Y[t] =  +  471.932069124408 +  5.05228499250553X[t] +  7.83474690929715M1[t] -8.0202554827627M2[t] -20.4390780800647M3[t] -28.9505807784159M4[t] -38.1422151796150M5[t] -38.7589463772168M6[t] +  11.7337337238324M7[t] +  20.6285052245819M8[t] +  14.3546477208346M9[t] +  3.90588701349005M10[t] -7.14914789295519M11[t]  + e[t][/C][/ROW]
[/TABLE]
Source: https://freestatistics.org/blog/index.php?pk=58484&T=1

Globally Unique Identifier (entire table): ba.freestatistics.org/blog/index.php?pk=58484&T=1

As an alternative you can also use a QR Code:  

The GUIDs for individual cells are displayed in the table below:

Multiple Linear Regression - Estimated Regression Equation
Y[t] = + 471.932069124408 + 5.05228499250553X[t] + 7.83474690929715M1[t] -8.0202554827627M2[t] -20.4390780800647M3[t] -28.9505807784159M4[t] -38.1422151796150M5[t] -38.7589463772168M6[t] + 11.7337337238324M7[t] + 20.6285052245819M8[t] + 14.3546477208346M9[t] + 3.90588701349005M10[t] -7.14914789295519M11[t] + e[t]


Multiple Linear Regression - Ordinary Least Squares
VariableParameterS.D.T-STATH0: parameter = 02-tail p-value1-tail p-value
(Intercept)471.93206912440828.71932616.432600
X5.052284992505531.4154073.56950.0008240.000412
M17.8347469092971522.4048580.34970.7281010.364051
M2-8.020255482762723.5817-0.34010.7352610.367631
M3-20.439078080064723.657426-0.8640.3919070.195953
M4-28.950580778415923.708976-1.22110.2280190.11401
M5-38.142215179615023.67109-1.61130.1136620.056831
M6-38.758946377216823.748961-1.6320.1092180.054609
M711.733733723832423.7856610.49330.6240420.312021
M820.628505224581923.8128510.86630.3906480.195324
M914.354647720834623.6850510.60610.5473280.273664
M103.9058870134900523.494460.16620.8686610.43433
M11-7.1491478929551923.393779-0.30560.761230.380615

\begin{tabular}{lllllllll}
\hline
Multiple Linear Regression - Ordinary Least Squares \tabularnewline
Variable & Parameter & S.D. & T-STATH0: parameter = 0 & 2-tail p-value & 1-tail p-value \tabularnewline
(Intercept) & 471.932069124408 & 28.719326 & 16.4326 & 0 & 0 \tabularnewline
X & 5.05228499250553 & 1.415407 & 3.5695 & 0.000824 & 0.000412 \tabularnewline
M1 & 7.83474690929715 & 22.404858 & 0.3497 & 0.728101 & 0.364051 \tabularnewline
M2 & -8.0202554827627 & 23.5817 & -0.3401 & 0.735261 & 0.367631 \tabularnewline
M3 & -20.4390780800647 & 23.657426 & -0.864 & 0.391907 & 0.195953 \tabularnewline
M4 & -28.9505807784159 & 23.708976 & -1.2211 & 0.228019 & 0.11401 \tabularnewline
M5 & -38.1422151796150 & 23.67109 & -1.6113 & 0.113662 & 0.056831 \tabularnewline
M6 & -38.7589463772168 & 23.748961 & -1.632 & 0.109218 & 0.054609 \tabularnewline
M7 & 11.7337337238324 & 23.785661 & 0.4933 & 0.624042 & 0.312021 \tabularnewline
M8 & 20.6285052245819 & 23.812851 & 0.8663 & 0.390648 & 0.195324 \tabularnewline
M9 & 14.3546477208346 & 23.685051 & 0.6061 & 0.547328 & 0.273664 \tabularnewline
M10 & 3.90588701349005 & 23.49446 & 0.1662 & 0.868661 & 0.43433 \tabularnewline
M11 & -7.14914789295519 & 23.393779 & -0.3056 & 0.76123 & 0.380615 \tabularnewline
\hline
\end{tabular}
%Source: https://freestatistics.org/blog/index.php?pk=58484&T=2

[TABLE]
[ROW][C]Multiple Linear Regression - Ordinary Least Squares[/C][/ROW]
[ROW][C]Variable[/C][C]Parameter[/C][C]S.D.[/C][C]T-STATH0: parameter = 0[/C][C]2-tail p-value[/C][C]1-tail p-value[/C][/ROW]
[ROW][C](Intercept)[/C][C]471.932069124408[/C][C]28.719326[/C][C]16.4326[/C][C]0[/C][C]0[/C][/ROW]
[ROW][C]X[/C][C]5.05228499250553[/C][C]1.415407[/C][C]3.5695[/C][C]0.000824[/C][C]0.000412[/C][/ROW]
[ROW][C]M1[/C][C]7.83474690929715[/C][C]22.404858[/C][C]0.3497[/C][C]0.728101[/C][C]0.364051[/C][/ROW]
[ROW][C]M2[/C][C]-8.0202554827627[/C][C]23.5817[/C][C]-0.3401[/C][C]0.735261[/C][C]0.367631[/C][/ROW]
[ROW][C]M3[/C][C]-20.4390780800647[/C][C]23.657426[/C][C]-0.864[/C][C]0.391907[/C][C]0.195953[/C][/ROW]
[ROW][C]M4[/C][C]-28.9505807784159[/C][C]23.708976[/C][C]-1.2211[/C][C]0.228019[/C][C]0.11401[/C][/ROW]
[ROW][C]M5[/C][C]-38.1422151796150[/C][C]23.67109[/C][C]-1.6113[/C][C]0.113662[/C][C]0.056831[/C][/ROW]
[ROW][C]M6[/C][C]-38.7589463772168[/C][C]23.748961[/C][C]-1.632[/C][C]0.109218[/C][C]0.054609[/C][/ROW]
[ROW][C]M7[/C][C]11.7337337238324[/C][C]23.785661[/C][C]0.4933[/C][C]0.624042[/C][C]0.312021[/C][/ROW]
[ROW][C]M8[/C][C]20.6285052245819[/C][C]23.812851[/C][C]0.8663[/C][C]0.390648[/C][C]0.195324[/C][/ROW]
[ROW][C]M9[/C][C]14.3546477208346[/C][C]23.685051[/C][C]0.6061[/C][C]0.547328[/C][C]0.273664[/C][/ROW]
[ROW][C]M10[/C][C]3.90588701349005[/C][C]23.49446[/C][C]0.1662[/C][C]0.868661[/C][C]0.43433[/C][/ROW]
[ROW][C]M11[/C][C]-7.14914789295519[/C][C]23.393779[/C][C]-0.3056[/C][C]0.76123[/C][C]0.380615[/C][/ROW]
[/TABLE]
Source: https://freestatistics.org/blog/index.php?pk=58484&T=2

Globally Unique Identifier (entire table): ba.freestatistics.org/blog/index.php?pk=58484&T=2

As an alternative you can also use a QR Code:  

The GUIDs for individual cells are displayed in the table below:

Multiple Linear Regression - Ordinary Least Squares
VariableParameterS.D.T-STATH0: parameter = 02-tail p-value1-tail p-value
(Intercept)471.93206912440828.71932616.432600
X5.052284992505531.4154073.56950.0008240.000412
M17.8347469092971522.4048580.34970.7281010.364051
M2-8.020255482762723.5817-0.34010.7352610.367631
M3-20.439078080064723.657426-0.8640.3919070.195953
M4-28.950580778415923.708976-1.22110.2280190.11401
M5-38.142215179615023.67109-1.61130.1136620.056831
M6-38.758946377216823.748961-1.6320.1092180.054609
M711.733733723832423.7856610.49330.6240420.312021
M820.628505224581923.8128510.86630.3906480.195324
M914.354647720834623.6850510.60610.5473280.273664
M103.9058870134900523.494460.16620.8686610.43433
M11-7.1491478929551923.393779-0.30560.761230.380615


Multiple Linear Regression - Regression Statistics
Multiple R0.61326202686736
R-squared0.376090313597463
Adjusted R-squared0.220112891996828
F-TEST (value)2.41118432230792
F-TEST (DF numerator)12
F-TEST (DF denominator)48
p-value0.0155093066966934
Multiple Linear Regression - Residual Statistics
Residual Standard Deviation36.9289428676062
Sum Squared Residuals65459.8474233084

\begin{tabular}{lllllllll}
\hline
Multiple Linear Regression - Regression Statistics \tabularnewline
Multiple R & 0.61326202686736 \tabularnewline
R-squared & 0.376090313597463 \tabularnewline
Adjusted R-squared & 0.220112891996828 \tabularnewline
F-TEST (value) & 2.41118432230792 \tabularnewline
F-TEST (DF numerator) & 12 \tabularnewline
F-TEST (DF denominator) & 48 \tabularnewline
p-value & 0.0155093066966934 \tabularnewline
Multiple Linear Regression - Residual Statistics \tabularnewline
Residual Standard Deviation & 36.9289428676062 \tabularnewline
Sum Squared Residuals & 65459.8474233084 \tabularnewline
\hline
\end{tabular}
%Source: https://freestatistics.org/blog/index.php?pk=58484&T=3

[TABLE]
[ROW][C]Multiple Linear Regression - Regression Statistics[/C][/ROW]
[ROW][C]Multiple R[/C][C]0.61326202686736[/C][/ROW]
[ROW][C]R-squared[/C][C]0.376090313597463[/C][/ROW]
[ROW][C]Adjusted R-squared[/C][C]0.220112891996828[/C][/ROW]
[ROW][C]F-TEST (value)[/C][C]2.41118432230792[/C][/ROW]
[ROW][C]F-TEST (DF numerator)[/C][C]12[/C][/ROW]
[ROW][C]F-TEST (DF denominator)[/C][C]48[/C][/ROW]
[ROW][C]p-value[/C][C]0.0155093066966934[/C][/ROW]
[ROW][C]Multiple Linear Regression - Residual Statistics[/C][/ROW]
[ROW][C]Residual Standard Deviation[/C][C]36.9289428676062[/C][/ROW]
[ROW][C]Sum Squared Residuals[/C][C]65459.8474233084[/C][/ROW]
[/TABLE]
Source: https://freestatistics.org/blog/index.php?pk=58484&T=3

Globally Unique Identifier (entire table): ba.freestatistics.org/blog/index.php?pk=58484&T=3

As an alternative you can also use a QR Code:  

The GUIDs for individual cells are displayed in the table below:

Multiple Linear Regression - Regression Statistics
Multiple R0.61326202686736
R-squared0.376090313597463
Adjusted R-squared0.220112891996828
F-TEST (value)2.41118432230792
F-TEST (DF numerator)12
F-TEST (DF denominator)48
p-value0.0155093066966934
Multiple Linear Regression - Residual Statistics
Residual Standard Deviation36.9289428676062
Sum Squared Residuals65459.8474233084


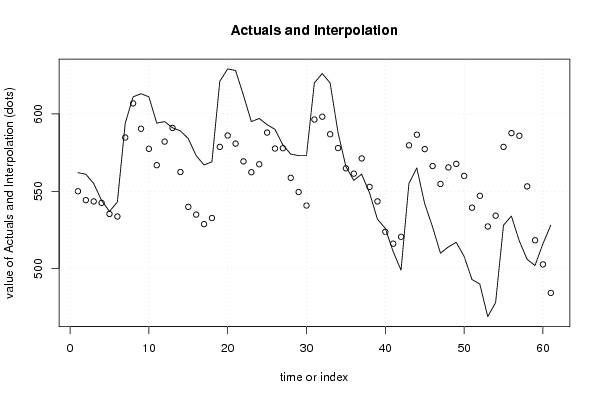
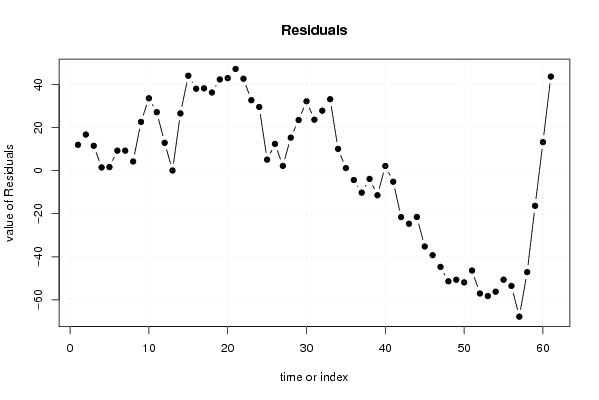
Multiple Linear Regression - Actuals, Interpolation, and Residuals
Time or IndexActualsInterpolationForecastResidualsPrediction Error
1562549.99357742953212.006422570468
2561544.24314502248316.7568549775166
3555543.44457790794411.5554220920558
4544542.5115026983511.48849730164874
5537535.3407822941541.65921770584570
6543533.7135940980519.28640590194859
7594584.7115026983519.28849730164879
8611606.7422151796154.25778482038498
9613590.36378769085722.6362123091432
10611577.38888448725933.6111155127406
11594566.83907808006527.1609219199353
12595582.07188196102912.9281180389712
13591590.9170858688270.08291413117299
14589562.43137099550326.5686290044967
15584539.9079784131944.0920215868097
16573534.93307520959338.0669247904071
17567528.77281180389738.2271881961029
18569532.7031370995536.2968629004497
19621578.64876070734542.3512392926554
20629586.02784671034242.9721532896576
21628580.76444620509647.2355537949038
22612569.3052284992542.6947715007494
23595562.2920215868132.7079784131903
24597567.42025548276329.5797445172373
25593587.8857148733245.11428512667632
26590577.5882259730212.4117740269801
27580577.8001158569822.19988414301825
28574558.67881467436915.3211853256311
29573549.4871802731723.5128197268302
30573540.78679308755932.2132069124408
31620596.33175818111423.6682418188861
32626598.15333069235627.8466693076443
33620586.82718819610333.1728118038971
34588577.8941129865110.1058870134900
35566564.8181640830621.18183591693749
36557561.357513491756-4.35751349175607
37561571.213174398055-10.2131743980554
38549552.832029509743-3.83202950974282
39532543.444577907944-11.4445779079441
40526523.8180482260812.18195177391925
41511516.142099322633-5.14209932263331
42499520.577653117537-21.5776531175371
43555579.659217705846-24.6592177058457
44565586.533075209593-21.5330752095929
45542577.227846710342-35.2278467103424
46527566.273857503747-39.2738575037472
47510554.713594098051-44.7135940980514
48514565.39934148576-51.3993414857605
49517567.676574903302-50.6765749033016
50508559.90522849925-51.9052284992505
51493539.40274991394-46.4027499139397
52490547.058559191606-57.0585591916062
53469527.257126306145-58.2571263061455
54478534.218822597302-56.218822597302
55528578.648760707345-50.6487607073446
56534587.543532208094-53.543532208094
57518585.816731197602-67.8167311976017
58506553.137916523233-47.1379165232329
59502518.337142152012-16.3371421520116
60516502.75100757869213.2489924213081
61528484.3138725269643.6861274730397

\begin{tabular}{lllllllll}
\hline
Multiple Linear Regression - Actuals, Interpolation, and Residuals \tabularnewline
Time or Index & Actuals & InterpolationForecast & ResidualsPrediction Error \tabularnewline
1 & 562 & 549.993577429532 & 12.006422570468 \tabularnewline
2 & 561 & 544.243145022483 & 16.7568549775166 \tabularnewline
3 & 555 & 543.444577907944 & 11.5554220920558 \tabularnewline
4 & 544 & 542.511502698351 & 1.48849730164874 \tabularnewline
5 & 537 & 535.340782294154 & 1.65921770584570 \tabularnewline
6 & 543 & 533.713594098051 & 9.28640590194859 \tabularnewline
7 & 594 & 584.711502698351 & 9.28849730164879 \tabularnewline
8 & 611 & 606.742215179615 & 4.25778482038498 \tabularnewline
9 & 613 & 590.363787690857 & 22.6362123091432 \tabularnewline
10 & 611 & 577.388884487259 & 33.6111155127406 \tabularnewline
11 & 594 & 566.839078080065 & 27.1609219199353 \tabularnewline
12 & 595 & 582.071881961029 & 12.9281180389712 \tabularnewline
13 & 591 & 590.917085868827 & 0.08291413117299 \tabularnewline
14 & 589 & 562.431370995503 & 26.5686290044967 \tabularnewline
15 & 584 & 539.90797841319 & 44.0920215868097 \tabularnewline
16 & 573 & 534.933075209593 & 38.0669247904071 \tabularnewline
17 & 567 & 528.772811803897 & 38.2271881961029 \tabularnewline
18 & 569 & 532.70313709955 & 36.2968629004497 \tabularnewline
19 & 621 & 578.648760707345 & 42.3512392926554 \tabularnewline
20 & 629 & 586.027846710342 & 42.9721532896576 \tabularnewline
21 & 628 & 580.764446205096 & 47.2355537949038 \tabularnewline
22 & 612 & 569.30522849925 & 42.6947715007494 \tabularnewline
23 & 595 & 562.29202158681 & 32.7079784131903 \tabularnewline
24 & 597 & 567.420255482763 & 29.5797445172373 \tabularnewline
25 & 593 & 587.885714873324 & 5.11428512667632 \tabularnewline
26 & 590 & 577.58822597302 & 12.4117740269801 \tabularnewline
27 & 580 & 577.800115856982 & 2.19988414301825 \tabularnewline
28 & 574 & 558.678814674369 & 15.3211853256311 \tabularnewline
29 & 573 & 549.48718027317 & 23.5128197268302 \tabularnewline
30 & 573 & 540.786793087559 & 32.2132069124408 \tabularnewline
31 & 620 & 596.331758181114 & 23.6682418188861 \tabularnewline
32 & 626 & 598.153330692356 & 27.8466693076443 \tabularnewline
33 & 620 & 586.827188196103 & 33.1728118038971 \tabularnewline
34 & 588 & 577.89411298651 & 10.1058870134900 \tabularnewline
35 & 566 & 564.818164083062 & 1.18183591693749 \tabularnewline
36 & 557 & 561.357513491756 & -4.35751349175607 \tabularnewline
37 & 561 & 571.213174398055 & -10.2131743980554 \tabularnewline
38 & 549 & 552.832029509743 & -3.83202950974282 \tabularnewline
39 & 532 & 543.444577907944 & -11.4445779079441 \tabularnewline
40 & 526 & 523.818048226081 & 2.18195177391925 \tabularnewline
41 & 511 & 516.142099322633 & -5.14209932263331 \tabularnewline
42 & 499 & 520.577653117537 & -21.5776531175371 \tabularnewline
43 & 555 & 579.659217705846 & -24.6592177058457 \tabularnewline
44 & 565 & 586.533075209593 & -21.5330752095929 \tabularnewline
45 & 542 & 577.227846710342 & -35.2278467103424 \tabularnewline
46 & 527 & 566.273857503747 & -39.2738575037472 \tabularnewline
47 & 510 & 554.713594098051 & -44.7135940980514 \tabularnewline
48 & 514 & 565.39934148576 & -51.3993414857605 \tabularnewline
49 & 517 & 567.676574903302 & -50.6765749033016 \tabularnewline
50 & 508 & 559.90522849925 & -51.9052284992505 \tabularnewline
51 & 493 & 539.40274991394 & -46.4027499139397 \tabularnewline
52 & 490 & 547.058559191606 & -57.0585591916062 \tabularnewline
53 & 469 & 527.257126306145 & -58.2571263061455 \tabularnewline
54 & 478 & 534.218822597302 & -56.218822597302 \tabularnewline
55 & 528 & 578.648760707345 & -50.6487607073446 \tabularnewline
56 & 534 & 587.543532208094 & -53.543532208094 \tabularnewline
57 & 518 & 585.816731197602 & -67.8167311976017 \tabularnewline
58 & 506 & 553.137916523233 & -47.1379165232329 \tabularnewline
59 & 502 & 518.337142152012 & -16.3371421520116 \tabularnewline
60 & 516 & 502.751007578692 & 13.2489924213081 \tabularnewline
61 & 528 & 484.31387252696 & 43.6861274730397 \tabularnewline
\hline
\end{tabular}
%Source: https://freestatistics.org/blog/index.php?pk=58484&T=4

[TABLE]
[ROW][C]Multiple Linear Regression - Actuals, Interpolation, and Residuals[/C][/ROW]
[ROW][C]Time or Index[/C][C]Actuals[/C][C]InterpolationForecast[/C][C]ResidualsPrediction Error[/C][/ROW]
[ROW][C]1[/C][C]562[/C][C]549.993577429532[/C][C]12.006422570468[/C][/ROW]
[ROW][C]2[/C][C]561[/C][C]544.243145022483[/C][C]16.7568549775166[/C][/ROW]
[ROW][C]3[/C][C]555[/C][C]543.444577907944[/C][C]11.5554220920558[/C][/ROW]
[ROW][C]4[/C][C]544[/C][C]542.511502698351[/C][C]1.48849730164874[/C][/ROW]
[ROW][C]5[/C][C]537[/C][C]535.340782294154[/C][C]1.65921770584570[/C][/ROW]
[ROW][C]6[/C][C]543[/C][C]533.713594098051[/C][C]9.28640590194859[/C][/ROW]
[ROW][C]7[/C][C]594[/C][C]584.711502698351[/C][C]9.28849730164879[/C][/ROW]
[ROW][C]8[/C][C]611[/C][C]606.742215179615[/C][C]4.25778482038498[/C][/ROW]
[ROW][C]9[/C][C]613[/C][C]590.363787690857[/C][C]22.6362123091432[/C][/ROW]
[ROW][C]10[/C][C]611[/C][C]577.388884487259[/C][C]33.6111155127406[/C][/ROW]
[ROW][C]11[/C][C]594[/C][C]566.839078080065[/C][C]27.1609219199353[/C][/ROW]
[ROW][C]12[/C][C]595[/C][C]582.071881961029[/C][C]12.9281180389712[/C][/ROW]
[ROW][C]13[/C][C]591[/C][C]590.917085868827[/C][C]0.08291413117299[/C][/ROW]
[ROW][C]14[/C][C]589[/C][C]562.431370995503[/C][C]26.5686290044967[/C][/ROW]
[ROW][C]15[/C][C]584[/C][C]539.90797841319[/C][C]44.0920215868097[/C][/ROW]
[ROW][C]16[/C][C]573[/C][C]534.933075209593[/C][C]38.0669247904071[/C][/ROW]
[ROW][C]17[/C][C]567[/C][C]528.772811803897[/C][C]38.2271881961029[/C][/ROW]
[ROW][C]18[/C][C]569[/C][C]532.70313709955[/C][C]36.2968629004497[/C][/ROW]
[ROW][C]19[/C][C]621[/C][C]578.648760707345[/C][C]42.3512392926554[/C][/ROW]
[ROW][C]20[/C][C]629[/C][C]586.027846710342[/C][C]42.9721532896576[/C][/ROW]
[ROW][C]21[/C][C]628[/C][C]580.764446205096[/C][C]47.2355537949038[/C][/ROW]
[ROW][C]22[/C][C]612[/C][C]569.30522849925[/C][C]42.6947715007494[/C][/ROW]
[ROW][C]23[/C][C]595[/C][C]562.29202158681[/C][C]32.7079784131903[/C][/ROW]
[ROW][C]24[/C][C]597[/C][C]567.420255482763[/C][C]29.5797445172373[/C][/ROW]
[ROW][C]25[/C][C]593[/C][C]587.885714873324[/C][C]5.11428512667632[/C][/ROW]
[ROW][C]26[/C][C]590[/C][C]577.58822597302[/C][C]12.4117740269801[/C][/ROW]
[ROW][C]27[/C][C]580[/C][C]577.800115856982[/C][C]2.19988414301825[/C][/ROW]
[ROW][C]28[/C][C]574[/C][C]558.678814674369[/C][C]15.3211853256311[/C][/ROW]
[ROW][C]29[/C][C]573[/C][C]549.48718027317[/C][C]23.5128197268302[/C][/ROW]
[ROW][C]30[/C][C]573[/C][C]540.786793087559[/C][C]32.2132069124408[/C][/ROW]
[ROW][C]31[/C][C]620[/C][C]596.331758181114[/C][C]23.6682418188861[/C][/ROW]
[ROW][C]32[/C][C]626[/C][C]598.153330692356[/C][C]27.8466693076443[/C][/ROW]
[ROW][C]33[/C][C]620[/C][C]586.827188196103[/C][C]33.1728118038971[/C][/ROW]
[ROW][C]34[/C][C]588[/C][C]577.89411298651[/C][C]10.1058870134900[/C][/ROW]
[ROW][C]35[/C][C]566[/C][C]564.818164083062[/C][C]1.18183591693749[/C][/ROW]
[ROW][C]36[/C][C]557[/C][C]561.357513491756[/C][C]-4.35751349175607[/C][/ROW]
[ROW][C]37[/C][C]561[/C][C]571.213174398055[/C][C]-10.2131743980554[/C][/ROW]
[ROW][C]38[/C][C]549[/C][C]552.832029509743[/C][C]-3.83202950974282[/C][/ROW]
[ROW][C]39[/C][C]532[/C][C]543.444577907944[/C][C]-11.4445779079441[/C][/ROW]
[ROW][C]40[/C][C]526[/C][C]523.818048226081[/C][C]2.18195177391925[/C][/ROW]
[ROW][C]41[/C][C]511[/C][C]516.142099322633[/C][C]-5.14209932263331[/C][/ROW]
[ROW][C]42[/C][C]499[/C][C]520.577653117537[/C][C]-21.5776531175371[/C][/ROW]
[ROW][C]43[/C][C]555[/C][C]579.659217705846[/C][C]-24.6592177058457[/C][/ROW]
[ROW][C]44[/C][C]565[/C][C]586.533075209593[/C][C]-21.5330752095929[/C][/ROW]
[ROW][C]45[/C][C]542[/C][C]577.227846710342[/C][C]-35.2278467103424[/C][/ROW]
[ROW][C]46[/C][C]527[/C][C]566.273857503747[/C][C]-39.2738575037472[/C][/ROW]
[ROW][C]47[/C][C]510[/C][C]554.713594098051[/C][C]-44.7135940980514[/C][/ROW]
[ROW][C]48[/C][C]514[/C][C]565.39934148576[/C][C]-51.3993414857605[/C][/ROW]
[ROW][C]49[/C][C]517[/C][C]567.676574903302[/C][C]-50.6765749033016[/C][/ROW]
[ROW][C]50[/C][C]508[/C][C]559.90522849925[/C][C]-51.9052284992505[/C][/ROW]
[ROW][C]51[/C][C]493[/C][C]539.40274991394[/C][C]-46.4027499139397[/C][/ROW]
[ROW][C]52[/C][C]490[/C][C]547.058559191606[/C][C]-57.0585591916062[/C][/ROW]
[ROW][C]53[/C][C]469[/C][C]527.257126306145[/C][C]-58.2571263061455[/C][/ROW]
[ROW][C]54[/C][C]478[/C][C]534.218822597302[/C][C]-56.218822597302[/C][/ROW]
[ROW][C]55[/C][C]528[/C][C]578.648760707345[/C][C]-50.6487607073446[/C][/ROW]
[ROW][C]56[/C][C]534[/C][C]587.543532208094[/C][C]-53.543532208094[/C][/ROW]
[ROW][C]57[/C][C]518[/C][C]585.816731197602[/C][C]-67.8167311976017[/C][/ROW]
[ROW][C]58[/C][C]506[/C][C]553.137916523233[/C][C]-47.1379165232329[/C][/ROW]
[ROW][C]59[/C][C]502[/C][C]518.337142152012[/C][C]-16.3371421520116[/C][/ROW]
[ROW][C]60[/C][C]516[/C][C]502.751007578692[/C][C]13.2489924213081[/C][/ROW]
[ROW][C]61[/C][C]528[/C][C]484.31387252696[/C][C]43.6861274730397[/C][/ROW]
[/TABLE]
Source: https://freestatistics.org/blog/index.php?pk=58484&T=4

Globally Unique Identifier (entire table): ba.freestatistics.org/blog/index.php?pk=58484&T=4

As an alternative you can also use a QR Code:  

The GUIDs for individual cells are displayed in the table below:

Multiple Linear Regression - Actuals, Interpolation, and Residuals
Time or IndexActualsInterpolationForecastResidualsPrediction Error
1562549.99357742953212.006422570468
2561544.24314502248316.7568549775166
3555543.44457790794411.5554220920558
4544542.5115026983511.48849730164874
5537535.3407822941541.65921770584570
6543533.7135940980519.28640590194859
7594584.7115026983519.28849730164879
8611606.7422151796154.25778482038498
9613590.36378769085722.6362123091432
10611577.38888448725933.6111155127406
11594566.83907808006527.1609219199353
12595582.07188196102912.9281180389712
13591590.9170858688270.08291413117299
14589562.43137099550326.5686290044967
15584539.9079784131944.0920215868097
16573534.93307520959338.0669247904071
17567528.77281180389738.2271881961029
18569532.7031370995536.2968629004497
19621578.64876070734542.3512392926554
20629586.02784671034242.9721532896576
21628580.76444620509647.2355537949038
22612569.3052284992542.6947715007494
23595562.2920215868132.7079784131903
24597567.42025548276329.5797445172373
25593587.8857148733245.11428512667632
26590577.5882259730212.4117740269801
27580577.8001158569822.19988414301825
28574558.67881467436915.3211853256311
29573549.4871802731723.5128197268302
30573540.78679308755932.2132069124408
31620596.33175818111423.6682418188861
32626598.15333069235627.8466693076443
33620586.82718819610333.1728118038971
34588577.8941129865110.1058870134900
35566564.8181640830621.18183591693749
36557561.357513491756-4.35751349175607
37561571.213174398055-10.2131743980554
38549552.832029509743-3.83202950974282
39532543.444577907944-11.4445779079441
40526523.8180482260812.18195177391925
41511516.142099322633-5.14209932263331
42499520.577653117537-21.5776531175371
43555579.659217705846-24.6592177058457
44565586.533075209593-21.5330752095929
45542577.227846710342-35.2278467103424
46527566.273857503747-39.2738575037472
47510554.713594098051-44.7135940980514
48514565.39934148576-51.3993414857605
49517567.676574903302-50.6765749033016
50508559.90522849925-51.9052284992505
51493539.40274991394-46.4027499139397
52490547.058559191606-57.0585591916062
53469527.257126306145-58.2571263061455
54478534.218822597302-56.218822597302
55528578.648760707345-50.6487607073446
56534587.543532208094-53.543532208094
57518585.816731197602-67.8167311976017
58506553.137916523233-47.1379165232329
59502518.337142152012-16.3371421520116
60516502.75100757869213.2489924213081
61528484.3138725269643.6861274730397


Goldfeld-Quandt test for Heteroskedasticity
p-valuesAlternative Hypothesis
breakpoint indexgreater2-sidedless
160.1264859148075310.2529718296150620.873514085192469
170.09807724381021420.1961544876204280.901922756189786
180.06329810307690380.1265962061538080.936701896923096
190.04768899980181850.0953779996036370.952311000198181
200.03282984857906370.06565969715812750.967170151420936
210.02154907829787370.04309815659574740.978450921702126
220.01254459397405940.02508918794811880.98745540602594
230.006533580990059560.01306716198011910.99346641900994
240.003212470409035320.006424940818070640.996787529590965
250.001527222152062090.003054444304124190.998472777847938
260.0007452623950863580.001490524790172720.999254737604914
270.0003208698928384870.0006417397856769730.999679130107161
280.0001689310029776790.0003378620059553590.999831068997022
290.0001423248207343320.0002846496414686650.999857675179266
300.0001762065899774570.0003524131799549150.999823793410022
310.0001866880212769920.0003733760425539850.999813311978723
320.0002592076999642950.0005184153999285910.999740792300036
330.001162934036472700.002325868072945400.998837065963527
340.006119082820379220.01223816564075840.99388091717962
350.02504120813841260.05008241627682520.974958791861587
360.06110729354175230.1222145870835050.938892706458248
370.109665726489020.219331452978040.89033427351098
380.1759090465473500.3518180930947010.82409095345265
390.3127884331969910.6255768663939820.687211566803009
400.3760675174264480.7521350348528950.623932482573552
410.5905882561680920.8188234876638170.409411743831908
420.6546092457614720.6907815084770560.345390754238528
430.7436135039183490.5127729921633020.256386496081651
440.8499643762218820.3000712475562360.150035623778118
450.9003556859674510.1992886280650970.0996443140325487

\begin{tabular}{lllllllll}
\hline
Goldfeld-Quandt test for Heteroskedasticity \tabularnewline
p-values & Alternative Hypothesis \tabularnewline
breakpoint index & greater & 2-sided & less \tabularnewline
16 & 0.126485914807531 & 0.252971829615062 & 0.873514085192469 \tabularnewline
17 & 0.0980772438102142 & 0.196154487620428 & 0.901922756189786 \tabularnewline
18 & 0.0632981030769038 & 0.126596206153808 & 0.936701896923096 \tabularnewline
19 & 0.0476889998018185 & 0.095377999603637 & 0.952311000198181 \tabularnewline
20 & 0.0328298485790637 & 0.0656596971581275 & 0.967170151420936 \tabularnewline
21 & 0.0215490782978737 & 0.0430981565957474 & 0.978450921702126 \tabularnewline
22 & 0.0125445939740594 & 0.0250891879481188 & 0.98745540602594 \tabularnewline
23 & 0.00653358099005956 & 0.0130671619801191 & 0.99346641900994 \tabularnewline
24 & 0.00321247040903532 & 0.00642494081807064 & 0.996787529590965 \tabularnewline
25 & 0.00152722215206209 & 0.00305444430412419 & 0.998472777847938 \tabularnewline
26 & 0.000745262395086358 & 0.00149052479017272 & 0.999254737604914 \tabularnewline
27 & 0.000320869892838487 & 0.000641739785676973 & 0.999679130107161 \tabularnewline
28 & 0.000168931002977679 & 0.000337862005955359 & 0.999831068997022 \tabularnewline
29 & 0.000142324820734332 & 0.000284649641468665 & 0.999857675179266 \tabularnewline
30 & 0.000176206589977457 & 0.000352413179954915 & 0.999823793410022 \tabularnewline
31 & 0.000186688021276992 & 0.000373376042553985 & 0.999813311978723 \tabularnewline
32 & 0.000259207699964295 & 0.000518415399928591 & 0.999740792300036 \tabularnewline
33 & 0.00116293403647270 & 0.00232586807294540 & 0.998837065963527 \tabularnewline
34 & 0.00611908282037922 & 0.0122381656407584 & 0.99388091717962 \tabularnewline
35 & 0.0250412081384126 & 0.0500824162768252 & 0.974958791861587 \tabularnewline
36 & 0.0611072935417523 & 0.122214587083505 & 0.938892706458248 \tabularnewline
37 & 0.10966572648902 & 0.21933145297804 & 0.89033427351098 \tabularnewline
38 & 0.175909046547350 & 0.351818093094701 & 0.82409095345265 \tabularnewline
39 & 0.312788433196991 & 0.625576866393982 & 0.687211566803009 \tabularnewline
40 & 0.376067517426448 & 0.752135034852895 & 0.623932482573552 \tabularnewline
41 & 0.590588256168092 & 0.818823487663817 & 0.409411743831908 \tabularnewline
42 & 0.654609245761472 & 0.690781508477056 & 0.345390754238528 \tabularnewline
43 & 0.743613503918349 & 0.512772992163302 & 0.256386496081651 \tabularnewline
44 & 0.849964376221882 & 0.300071247556236 & 0.150035623778118 \tabularnewline
45 & 0.900355685967451 & 0.199288628065097 & 0.0996443140325487 \tabularnewline
\hline
\end{tabular}
%Source: https://freestatistics.org/blog/index.php?pk=58484&T=5

[TABLE]
[ROW][C]Goldfeld-Quandt test for Heteroskedasticity[/C][/ROW]
[ROW][C]p-values[/C][C]Alternative Hypothesis[/C][/ROW]
[ROW][C]breakpoint index[/C][C]greater[/C][C]2-sided[/C][C]less[/C][/ROW]
[ROW][C]16[/C][C]0.126485914807531[/C][C]0.252971829615062[/C][C]0.873514085192469[/C][/ROW]
[ROW][C]17[/C][C]0.0980772438102142[/C][C]0.196154487620428[/C][C]0.901922756189786[/C][/ROW]
[ROW][C]18[/C][C]0.0632981030769038[/C][C]0.126596206153808[/C][C]0.936701896923096[/C][/ROW]
[ROW][C]19[/C][C]0.0476889998018185[/C][C]0.095377999603637[/C][C]0.952311000198181[/C][/ROW]
[ROW][C]20[/C][C]0.0328298485790637[/C][C]0.0656596971581275[/C][C]0.967170151420936[/C][/ROW]
[ROW][C]21[/C][C]0.0215490782978737[/C][C]0.0430981565957474[/C][C]0.978450921702126[/C][/ROW]
[ROW][C]22[/C][C]0.0125445939740594[/C][C]0.0250891879481188[/C][C]0.98745540602594[/C][/ROW]
[ROW][C]23[/C][C]0.00653358099005956[/C][C]0.0130671619801191[/C][C]0.99346641900994[/C][/ROW]
[ROW][C]24[/C][C]0.00321247040903532[/C][C]0.00642494081807064[/C][C]0.996787529590965[/C][/ROW]
[ROW][C]25[/C][C]0.00152722215206209[/C][C]0.00305444430412419[/C][C]0.998472777847938[/C][/ROW]
[ROW][C]26[/C][C]0.000745262395086358[/C][C]0.00149052479017272[/C][C]0.999254737604914[/C][/ROW]
[ROW][C]27[/C][C]0.000320869892838487[/C][C]0.000641739785676973[/C][C]0.999679130107161[/C][/ROW]
[ROW][C]28[/C][C]0.000168931002977679[/C][C]0.000337862005955359[/C][C]0.999831068997022[/C][/ROW]
[ROW][C]29[/C][C]0.000142324820734332[/C][C]0.000284649641468665[/C][C]0.999857675179266[/C][/ROW]
[ROW][C]30[/C][C]0.000176206589977457[/C][C]0.000352413179954915[/C][C]0.999823793410022[/C][/ROW]
[ROW][C]31[/C][C]0.000186688021276992[/C][C]0.000373376042553985[/C][C]0.999813311978723[/C][/ROW]
[ROW][C]32[/C][C]0.000259207699964295[/C][C]0.000518415399928591[/C][C]0.999740792300036[/C][/ROW]
[ROW][C]33[/C][C]0.00116293403647270[/C][C]0.00232586807294540[/C][C]0.998837065963527[/C][/ROW]
[ROW][C]34[/C][C]0.00611908282037922[/C][C]0.0122381656407584[/C][C]0.99388091717962[/C][/ROW]
[ROW][C]35[/C][C]0.0250412081384126[/C][C]0.0500824162768252[/C][C]0.974958791861587[/C][/ROW]
[ROW][C]36[/C][C]0.0611072935417523[/C][C]0.122214587083505[/C][C]0.938892706458248[/C][/ROW]
[ROW][C]37[/C][C]0.10966572648902[/C][C]0.21933145297804[/C][C]0.89033427351098[/C][/ROW]
[ROW][C]38[/C][C]0.175909046547350[/C][C]0.351818093094701[/C][C]0.82409095345265[/C][/ROW]
[ROW][C]39[/C][C]0.312788433196991[/C][C]0.625576866393982[/C][C]0.687211566803009[/C][/ROW]
[ROW][C]40[/C][C]0.376067517426448[/C][C]0.752135034852895[/C][C]0.623932482573552[/C][/ROW]
[ROW][C]41[/C][C]0.590588256168092[/C][C]0.818823487663817[/C][C]0.409411743831908[/C][/ROW]
[ROW][C]42[/C][C]0.654609245761472[/C][C]0.690781508477056[/C][C]0.345390754238528[/C][/ROW]
[ROW][C]43[/C][C]0.743613503918349[/C][C]0.512772992163302[/C][C]0.256386496081651[/C][/ROW]
[ROW][C]44[/C][C]0.849964376221882[/C][C]0.300071247556236[/C][C]0.150035623778118[/C][/ROW]
[ROW][C]45[/C][C]0.900355685967451[/C][C]0.199288628065097[/C][C]0.0996443140325487[/C][/ROW]
[/TABLE]
Source: https://freestatistics.org/blog/index.php?pk=58484&T=5

Globally Unique Identifier (entire table): ba.freestatistics.org/blog/index.php?pk=58484&T=5

As an alternative you can also use a QR Code:  

The GUIDs for individual cells are displayed in the table below:

Goldfeld-Quandt test for Heteroskedasticity
p-valuesAlternative Hypothesis
breakpoint indexgreater2-sidedless
160.1264859148075310.2529718296150620.873514085192469
170.09807724381021420.1961544876204280.901922756189786
180.06329810307690380.1265962061538080.936701896923096
190.04768899980181850.0953779996036370.952311000198181
200.03282984857906370.06565969715812750.967170151420936
210.02154907829787370.04309815659574740.978450921702126
220.01254459397405940.02508918794811880.98745540602594
230.006533580990059560.01306716198011910.99346641900994
240.003212470409035320.006424940818070640.996787529590965
250.001527222152062090.003054444304124190.998472777847938
260.0007452623950863580.001490524790172720.999254737604914
270.0003208698928384870.0006417397856769730.999679130107161
280.0001689310029776790.0003378620059553590.999831068997022
290.0001423248207343320.0002846496414686650.999857675179266
300.0001762065899774570.0003524131799549150.999823793410022
310.0001866880212769920.0003733760425539850.999813311978723
320.0002592076999642950.0005184153999285910.999740792300036
330.001162934036472700.002325868072945400.998837065963527
340.006119082820379220.01223816564075840.99388091717962
350.02504120813841260.05008241627682520.974958791861587
360.06110729354175230.1222145870835050.938892706458248
370.109665726489020.219331452978040.89033427351098
380.1759090465473500.3518180930947010.82409095345265
390.3127884331969910.6255768663939820.687211566803009
400.3760675174264480.7521350348528950.623932482573552
410.5905882561680920.8188234876638170.409411743831908
420.6546092457614720.6907815084770560.345390754238528
430.7436135039183490.5127729921633020.256386496081651
440.8499643762218820.3000712475562360.150035623778118
450.9003556859674510.1992886280650970.0996443140325487


Meta Analysis of Goldfeld-Quandt test for Heteroskedasticity
Description# significant tests% significant testsOK/NOK
1% type I error level100.333333333333333NOK
5% type I error level140.466666666666667NOK
10% type I error level170.566666666666667NOK

\begin{tabular}{lllllllll}
\hline
Meta Analysis of Goldfeld-Quandt test for Heteroskedasticity \tabularnewline
Description & # significant tests & % significant tests & OK/NOK \tabularnewline
1% type I error level & 10 & 0.333333333333333 & NOK \tabularnewline
5% type I error level & 14 & 0.466666666666667 & NOK \tabularnewline
10% type I error level & 17 & 0.566666666666667 & NOK \tabularnewline
\hline
\end{tabular}
%Source: https://freestatistics.org/blog/index.php?pk=58484&T=6

[TABLE]
[ROW][C]Meta Analysis of Goldfeld-Quandt test for Heteroskedasticity[/C][/ROW]
[ROW][C]Description[/C][C]# significant tests[/C][C]% significant tests[/C][C]OK/NOK[/C][/ROW]
[ROW][C]1% type I error level[/C][C]10[/C][C]0.333333333333333[/C][C]NOK[/C][/ROW]
[ROW][C]5% type I error level[/C][C]14[/C][C]0.466666666666667[/C][C]NOK[/C][/ROW]
[ROW][C]10% type I error level[/C][C]17[/C][C]0.566666666666667[/C][C]NOK[/C][/ROW]
[/TABLE]
Source: https://freestatistics.org/blog/index.php?pk=58484&T=6

Globally Unique Identifier (entire table): ba.freestatistics.org/blog/index.php?pk=58484&T=6

As an alternative you can also use a QR Code:  

The GUIDs for individual cells are displayed in the table below:

Meta Analysis of Goldfeld-Quandt test for Heteroskedasticity
Description# significant tests% significant testsOK/NOK
1% type I error level100.333333333333333NOK
5% type I error level140.466666666666667NOK
10% type I error level170.566666666666667NOK


Parameters (Session):
par1 = 1 ; par2 = Include Monthly Dummies ; par3 = No Linear Trend ;
Parameters (R input):
par1 = 1 ; par2 = Include Monthly Dummies ; par3 = No Linear Trend ;
R code (references can be found in the software module):
library(lattice)
library(lmtest)
n25 <- 25 #minimum number of obs. for Goldfeld-Quandt test
par1 <- as.numeric(par1)
x <- t(y)
k <- length(x[1,])
n <- length(x[,1])
x1 <- cbind(x[,par1], x[,1:k!=par1])
mycolnames <- c(colnames(x)[par1], colnames(x)[1:k!=par1])
colnames(x1) <- mycolnames #colnames(x)[par1]
x <- x1
if (par3 == 'First Differences'){
x2 <- array(0, dim=c(n-1,k), dimnames=list(1:(n-1), paste('(1-B)',colnames(x),sep='')))
for (i in 1:n-1) {
for (j in 1:k) {
x2[i,j] <- x[i+1,j] - x[i,j]
}
}
x <- x2
}
if (par2 == 'Include Monthly Dummies'){
x2 <- array(0, dim=c(n,11), dimnames=list(1:n, paste('M', seq(1:11), sep ='')))
for (i in 1:11){
x2[seq(i,n,12),i] <- 1
}
x <- cbind(x, x2)
}
if (par2 == 'Include Quarterly Dummies'){
x2 <- array(0, dim=c(n,3), dimnames=list(1:n, paste('Q', seq(1:3), sep ='')))
for (i in 1:3){
x2[seq(i,n,4),i] <- 1
}
x <- cbind(x, x2)
}
k <- length(x[1,])
if (par3 == 'Linear Trend'){
x <- cbind(x, c(1:n))
colnames(x)[k+1] <- 't'
}
x
k <- length(x[1,])
df <- as.data.frame(x)
(mylm <- lm(df))
(mysum <- summary(mylm))
if (n > n25) {
kp3 <- k + 3
nmkm3 <- n - k - 3
gqarr <- array(NA, dim=c(nmkm3-kp3+1,3))
numgqtests <- 0
numsignificant1 <- 0
numsignificant5 <- 0
numsignificant10 <- 0
for (mypoint in kp3:nmkm3) {
j <- 0
numgqtests <- numgqtests + 1
for (myalt in c('greater', 'two.sided', 'less')) {
j <- j + 1
gqarr[mypoint-kp3+1,j] <- gqtest(mylm, point=mypoint, alternative=myalt)$p.value
}
if (gqarr[mypoint-kp3+1,2] < 0.01) numsignificant1 <- numsignificant1 + 1
if (gqarr[mypoint-kp3+1,2] < 0.05) numsignificant5 <- numsignificant5 + 1
if (gqarr[mypoint-kp3+1,2] < 0.10) numsignificant10 <- numsignificant10 + 1
}
gqarr
}
bitmap(file='test0.png')
plot(x[,1], type='l', main='Actuals and Interpolation', ylab='value of Actuals and Interpolation (dots)', xlab='time or index')
points(x[,1]-mysum$resid)
grid()
dev.off()
bitmap(file='test1.png')
plot(mysum$resid, type='b', pch=19, main='Residuals', ylab='value of Residuals', xlab='time or index')
grid()
dev.off()
bitmap(file='test2.png')
hist(mysum$resid, main='Residual Histogram', xlab='values of Residuals')
grid()
dev.off()
bitmap(file='test3.png')
densityplot(~mysum$resid,col='black',main='Residual Density Plot', xlab='values of Residuals')
dev.off()
bitmap(file='test4.png')
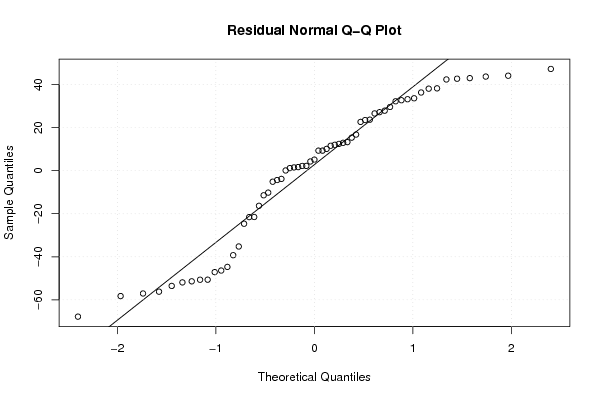
qqnorm(mysum$resid, main='Residual Normal Q-Q Plot')
qqline(mysum$resid)
grid()
dev.off()
(myerror <- as.ts(mysum$resid))
bitmap(file='test5.png')
dum <- cbind(lag(myerror,k=1),myerror)
dum
dum1 <- dum[2:length(myerror),]
dum1
z <- as.data.frame(dum1)
z
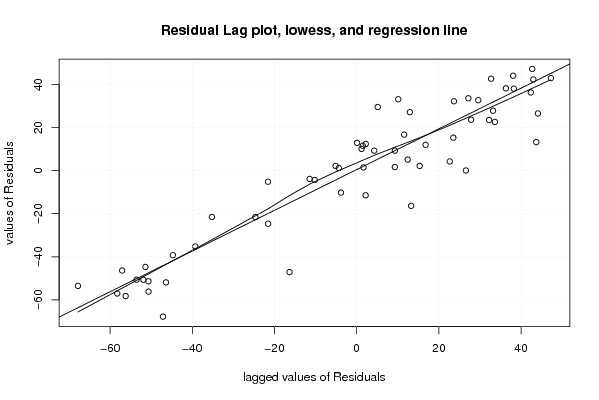
plot(z,main=paste('Residual Lag plot, lowess, and regression line'), ylab='values of Residuals', xlab='lagged values of Residuals')
lines(lowess(z))
abline(lm(z))
grid()
dev.off()
bitmap(file='test6.png')
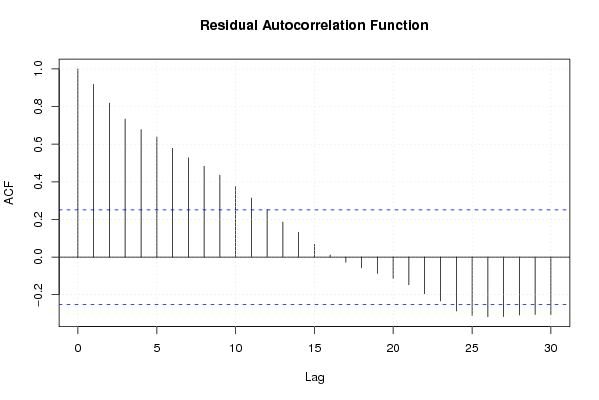
acf(mysum$resid, lag.max=length(mysum$resid)/2, main='Residual Autocorrelation Function')
grid()
dev.off()
bitmap(file='test7.png')
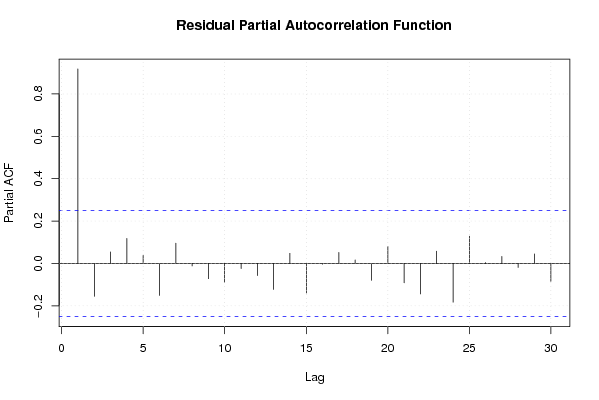
pacf(mysum$resid, lag.max=length(mysum$resid)/2, main='Residual Partial Autocorrelation Function')
grid()
dev.off()
bitmap(file='test8.png')
opar <- par(mfrow = c(2,2), oma = c(0, 0, 1.1, 0))
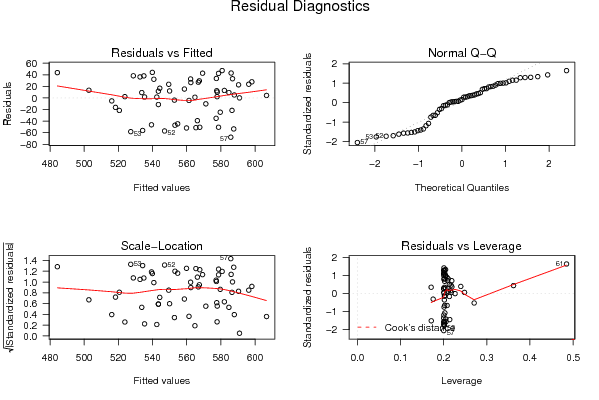
plot(mylm, las = 1, sub='Residual Diagnostics')
par(opar)
dev.off()
if (n > n25) {
bitmap(file='test9.png')
plot(kp3:nmkm3,gqarr[,2], main='Goldfeld-Quandt test',ylab='2-sided p-value',xlab='breakpoint')
grid()
dev.off()
}
load(file='createtable')
a<-table.start()
a<-table.row.start(a)
a<-table.element(a, 'Multiple Linear Regression - Estimated Regression Equation', 1, TRUE)
a<-table.row.end(a)
myeq <- colnames(x)[1]
myeq <- paste(myeq, '[t] = ', sep='')
for (i in 1:k){
if (mysum$coefficients[i,1] > 0) myeq <- paste(myeq, '+', '')
myeq <- paste(myeq, mysum$coefficients[i,1], sep=' ')
if (rownames(mysum$coefficients)[i] != '(Intercept)') {
myeq <- paste(myeq, rownames(mysum$coefficients)[i], sep='')
if (rownames(mysum$coefficients)[i] != 't') myeq <- paste(myeq, '[t]', sep='')
}
}
myeq <- paste(myeq, ' + e[t]')
a<-table.row.start(a)
a<-table.element(a, myeq)
a<-table.row.end(a)
a<-table.end(a)
table.save(a,file='mytable1.tab')
a<-table.start()
a<-table.row.start(a)
a<-table.element(a,hyperlink('ols1.htm','Multiple Linear Regression - Ordinary Least Squares',''), 6, TRUE)
a<-table.row.end(a)
a<-table.row.start(a)
a<-table.element(a,'Variable',header=TRUE)
a<-table.element(a,'Parameter',header=TRUE)
a<-table.element(a,'S.D.',header=TRUE)
a<-table.element(a,'T-STAT
H0: parameter = 0',header=TRUE)
a<-table.element(a,'2-tail p-value',header=TRUE)
a<-table.element(a,'1-tail p-value',header=TRUE)
a<-table.row.end(a)
for (i in 1:k){
a<-table.row.start(a)
a<-table.element(a,rownames(mysum$coefficients)[i],header=TRUE)
a<-table.element(a,mysum$coefficients[i,1])
a<-table.element(a, round(mysum$coefficients[i,2],6))
a<-table.element(a, round(mysum$coefficients[i,3],4))
a<-table.element(a, round(mysum$coefficients[i,4],6))
a<-table.element(a, round(mysum$coefficients[i,4]/2,6))
a<-table.row.end(a)
}
a<-table.end(a)
table.save(a,file='mytable2.tab')
a<-table.start()
a<-table.row.start(a)
a<-table.element(a, 'Multiple Linear Regression - Regression Statistics', 2, TRUE)
a<-table.row.end(a)
a<-table.row.start(a)
a<-table.element(a, 'Multiple R',1,TRUE)
a<-table.element(a, sqrt(mysum$r.squared))
a<-table.row.end(a)
a<-table.row.start(a)
a<-table.element(a, 'R-squared',1,TRUE)
a<-table.element(a, mysum$r.squared)
a<-table.row.end(a)
a<-table.row.start(a)
a<-table.element(a, 'Adjusted R-squared',1,TRUE)
a<-table.element(a, mysum$adj.r.squared)
a<-table.row.end(a)
a<-table.row.start(a)
a<-table.element(a, 'F-TEST (value)',1,TRUE)
a<-table.element(a, mysum$fstatistic[1])
a<-table.row.end(a)
a<-table.row.start(a)
a<-table.element(a, 'F-TEST (DF numerator)',1,TRUE)
a<-table.element(a, mysum$fstatistic[2])
a<-table.row.end(a)
a<-table.row.start(a)
a<-table.element(a, 'F-TEST (DF denominator)',1,TRUE)
a<-table.element(a, mysum$fstatistic[3])
a<-table.row.end(a)
a<-table.row.start(a)
a<-table.element(a, 'p-value',1,TRUE)
a<-table.element(a, 1-pf(mysum$fstatistic[1],mysum$fstatistic[2],mysum$fstatistic[3]))
a<-table.row.end(a)
a<-table.row.start(a)
a<-table.element(a, 'Multiple Linear Regression - Residual Statistics', 2, TRUE)
a<-table.row.end(a)
a<-table.row.start(a)
a<-table.element(a, 'Residual Standard Deviation',1,TRUE)
a<-table.element(a, mysum$sigma)
a<-table.row.end(a)
a<-table.row.start(a)
a<-table.element(a, 'Sum Squared Residuals',1,TRUE)
a<-table.element(a, sum(myerror*myerror))
a<-table.row.end(a)
a<-table.end(a)
table.save(a,file='mytable3.tab')
a<-table.start()
a<-table.row.start(a)
a<-table.element(a, 'Multiple Linear Regression - Actuals, Interpolation, and Residuals', 4, TRUE)
a<-table.row.end(a)
a<-table.row.start(a)
a<-table.element(a, 'Time or Index', 1, TRUE)
a<-table.element(a, 'Actuals', 1, TRUE)
a<-table.element(a, 'Interpolation
Forecast', 1, TRUE)
a<-table.element(a, 'Residuals
Prediction Error', 1, TRUE)
a<-table.row.end(a)
for (i in 1:n) {
a<-table.row.start(a)
a<-table.element(a,i, 1, TRUE)
a<-table.element(a,x[i])
a<-table.element(a,x[i]-mysum$resid[i])
a<-table.element(a,mysum$resid[i])
a<-table.row.end(a)
}
a<-table.end(a)
table.save(a,file='mytable4.tab')
if (n > n25) {
a<-table.start()
a<-table.row.start(a)
a<-table.element(a,'Goldfeld-Quandt test for Heteroskedasticity',4,TRUE)
a<-table.row.end(a)
a<-table.row.start(a)
a<-table.element(a,'p-values',header=TRUE)
a<-table.element(a,'Alternative Hypothesis',3,header=TRUE)
a<-table.row.end(a)
a<-table.row.start(a)
a<-table.element(a,'breakpoint index',header=TRUE)
a<-table.element(a,'greater',header=TRUE)
a<-table.element(a,'2-sided',header=TRUE)
a<-table.element(a,'less',header=TRUE)
a<-table.row.end(a)
for (mypoint in kp3:nmkm3) {
a<-table.row.start(a)
a<-table.element(a,mypoint,header=TRUE)
a<-table.element(a,gqarr[mypoint-kp3+1,1])
a<-table.element(a,gqarr[mypoint-kp3+1,2])
a<-table.element(a,gqarr[mypoint-kp3+1,3])
a<-table.row.end(a)
}
a<-table.end(a)
table.save(a,file='mytable5.tab')
a<-table.start()
a<-table.row.start(a)
a<-table.element(a,'Meta Analysis of Goldfeld-Quandt test for Heteroskedasticity',4,TRUE)
a<-table.row.end(a)
a<-table.row.start(a)
a<-table.element(a,'Description',header=TRUE)
a<-table.element(a,'# significant tests',header=TRUE)
a<-table.element(a,'% significant tests',header=TRUE)
a<-table.element(a,'OK/NOK',header=TRUE)
a<-table.row.end(a)
a<-table.row.start(a)
a<-table.element(a,'1% type I error level',header=TRUE)
a<-table.element(a,numsignificant1)
a<-table.element(a,numsignificant1/numgqtests)
if (numsignificant1/numgqtests < 0.01) dum <- 'OK' else dum <- 'NOK'
a<-table.element(a,dum)
a<-table.row.end(a)
a<-table.row.start(a)
a<-table.element(a,'5% type I error level',header=TRUE)
a<-table.element(a,numsignificant5)
a<-table.element(a,numsignificant5/numgqtests)
if (numsignificant5/numgqtests < 0.05) dum <- 'OK' else dum <- 'NOK'
a<-table.element(a,dum)
a<-table.row.end(a)
a<-table.row.start(a)
a<-table.element(a,'10% type I error level',header=TRUE)
a<-table.element(a,numsignificant10)
a<-table.element(a,numsignificant10/numgqtests)
if (numsignificant10/numgqtests < 0.1) dum <- 'OK' else dum <- 'NOK'
a<-table.element(a,dum)
a<-table.row.end(a)
a<-table.end(a)
table.save(a,file='mytable6.tab')
}