| Multiple Linear Regression - Estimated Regression Equation |
| Y[t] = + 471.932069124408 + 5.05228499250553X[t] + 7.83474690929715M1[t] -8.0202554827627M2[t] -20.4390780800647M3[t] -28.9505807784159M4[t] -38.1422151796150M5[t] -38.7589463772168M6[t] + 11.7337337238324M7[t] + 20.6285052245819M8[t] + 14.3546477208346M9[t] + 3.90588701349005M10[t] -7.14914789295519M11[t] + e[t] |
| Multiple Linear Regression - Ordinary Least Squares | |||||
| Variable | Parameter | S.D. | T-STAT H0: parameter = 0 | 2-tail p-value | 1-tail p-value |
| (Intercept) | 471.932069124408 | 28.719326 | 16.4326 | 0 | 0 |
| X | 5.05228499250553 | 1.415407 | 3.5695 | 0.000824 | 0.000412 |
| M1 | 7.83474690929715 | 22.404858 | 0.3497 | 0.728101 | 0.364051 |
| M2 | -8.0202554827627 | 23.5817 | -0.3401 | 0.735261 | 0.367631 |
| M3 | -20.4390780800647 | 23.657426 | -0.864 | 0.391907 | 0.195953 |
| M4 | -28.9505807784159 | 23.708976 | -1.2211 | 0.228019 | 0.11401 |
| M5 | -38.1422151796150 | 23.67109 | -1.6113 | 0.113662 | 0.056831 |
| M6 | -38.7589463772168 | 23.748961 | -1.632 | 0.109218 | 0.054609 |
| M7 | 11.7337337238324 | 23.785661 | 0.4933 | 0.624042 | 0.312021 |
| M8 | 20.6285052245819 | 23.812851 | 0.8663 | 0.390648 | 0.195324 |
| M9 | 14.3546477208346 | 23.685051 | 0.6061 | 0.547328 | 0.273664 |
| M10 | 3.90588701349005 | 23.49446 | 0.1662 | 0.868661 | 0.43433 |
| M11 | -7.14914789295519 | 23.393779 | -0.3056 | 0.76123 | 0.380615 |
| Multiple Linear Regression - Regression Statistics | |
| Multiple R | 0.61326202686736 |
| R-squared | 0.376090313597463 |
| Adjusted R-squared | 0.220112891996828 |
| F-TEST (value) | 2.41118432230792 |
| F-TEST (DF numerator) | 12 |
| F-TEST (DF denominator) | 48 |
| p-value | 0.0155093066966934 |
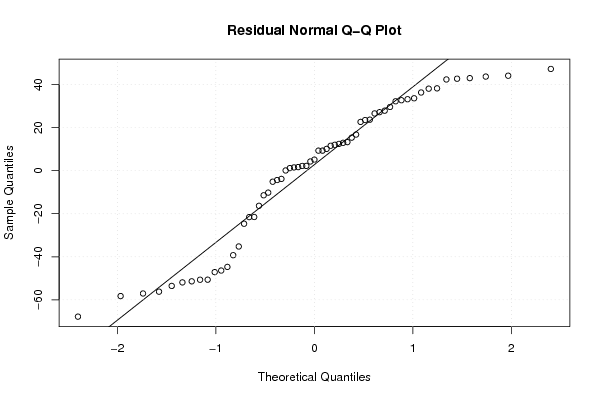
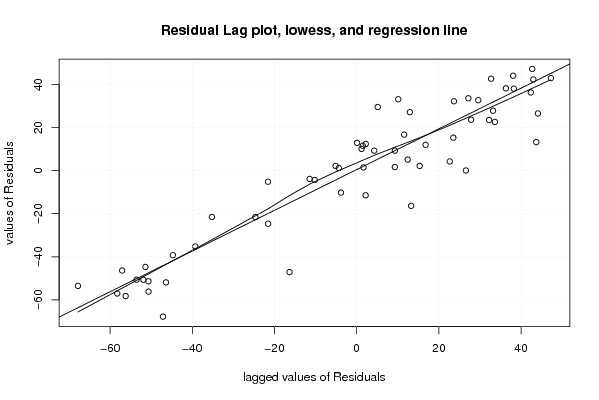
| Multiple Linear Regression - Residual Statistics | |
| Residual Standard Deviation | 36.9289428676062 |
| Sum Squared Residuals | 65459.8474233084 |
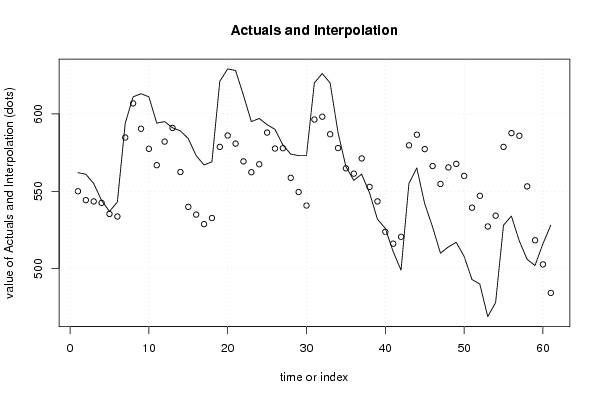
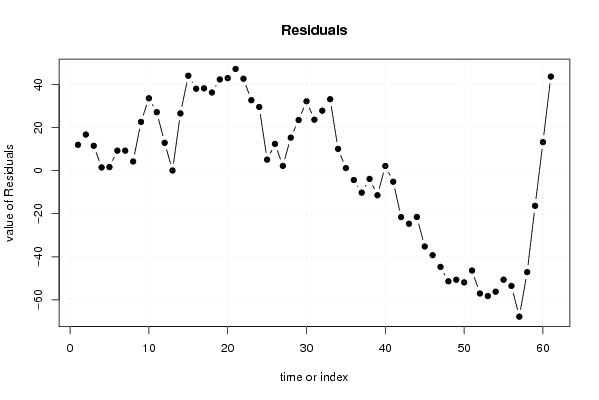
| Multiple Linear Regression - Actuals, Interpolation, and Residuals | |||
| Time or Index | Actuals | Interpolation Forecast | Residuals Prediction Error |
| 1 | 562 | 549.993577429532 | 12.006422570468 |
| 2 | 561 | 544.243145022483 | 16.7568549775166 |
| 3 | 555 | 543.444577907944 | 11.5554220920558 |
| 4 | 544 | 542.511502698351 | 1.48849730164874 |
| 5 | 537 | 535.340782294154 | 1.65921770584570 |
| 6 | 543 | 533.713594098051 | 9.28640590194859 |
| 7 | 594 | 584.711502698351 | 9.28849730164879 |
| 8 | 611 | 606.742215179615 | 4.25778482038498 |
| 9 | 613 | 590.363787690857 | 22.6362123091432 |
| 10 | 611 | 577.388884487259 | 33.6111155127406 |
| 11 | 594 | 566.839078080065 | 27.1609219199353 |
| 12 | 595 | 582.071881961029 | 12.9281180389712 |
| 13 | 591 | 590.917085868827 | 0.08291413117299 |
| 14 | 589 | 562.431370995503 | 26.5686290044967 |
| 15 | 584 | 539.90797841319 | 44.0920215868097 |
| 16 | 573 | 534.933075209593 | 38.0669247904071 |
| 17 | 567 | 528.772811803897 | 38.2271881961029 |
| 18 | 569 | 532.70313709955 | 36.2968629004497 |
| 19 | 621 | 578.648760707345 | 42.3512392926554 |
| 20 | 629 | 586.027846710342 | 42.9721532896576 |
| 21 | 628 | 580.764446205096 | 47.2355537949038 |
| 22 | 612 | 569.30522849925 | 42.6947715007494 |
| 23 | 595 | 562.29202158681 | 32.7079784131903 |
| 24 | 597 | 567.420255482763 | 29.5797445172373 |
| 25 | 593 | 587.885714873324 | 5.11428512667632 |
| 26 | 590 | 577.58822597302 | 12.4117740269801 |
| 27 | 580 | 577.800115856982 | 2.19988414301825 |
| 28 | 574 | 558.678814674369 | 15.3211853256311 |
| 29 | 573 | 549.48718027317 | 23.5128197268302 |
| 30 | 573 | 540.786793087559 | 32.2132069124408 |
| 31 | 620 | 596.331758181114 | 23.6682418188861 |
| 32 | 626 | 598.153330692356 | 27.8466693076443 |
| 33 | 620 | 586.827188196103 | 33.1728118038971 |
| 34 | 588 | 577.89411298651 | 10.1058870134900 |
| 35 | 566 | 564.818164083062 | 1.18183591693749 |
| 36 | 557 | 561.357513491756 | -4.35751349175607 |
| 37 | 561 | 571.213174398055 | -10.2131743980554 |
| 38 | 549 | 552.832029509743 | -3.83202950974282 |
| 39 | 532 | 543.444577907944 | -11.4445779079441 |
| 40 | 526 | 523.818048226081 | 2.18195177391925 |
| 41 | 511 | 516.142099322633 | -5.14209932263331 |
| 42 | 499 | 520.577653117537 | -21.5776531175371 |
| 43 | 555 | 579.659217705846 | -24.6592177058457 |
| 44 | 565 | 586.533075209593 | -21.5330752095929 |
| 45 | 542 | 577.227846710342 | -35.2278467103424 |
| 46 | 527 | 566.273857503747 | -39.2738575037472 |
| 47 | 510 | 554.713594098051 | -44.7135940980514 |
| 48 | 514 | 565.39934148576 | -51.3993414857605 |
| 49 | 517 | 567.676574903302 | -50.6765749033016 |
| 50 | 508 | 559.90522849925 | -51.9052284992505 |
| 51 | 493 | 539.40274991394 | -46.4027499139397 |
| 52 | 490 | 547.058559191606 | -57.0585591916062 |
| 53 | 469 | 527.257126306145 | -58.2571263061455 |
| 54 | 478 | 534.218822597302 | -56.218822597302 |
| 55 | 528 | 578.648760707345 | -50.6487607073446 |
| 56 | 534 | 587.543532208094 | -53.543532208094 |
| 57 | 518 | 585.816731197602 | -67.8167311976017 |
| 58 | 506 | 553.137916523233 | -47.1379165232329 |
| 59 | 502 | 518.337142152012 | -16.3371421520116 |
| 60 | 516 | 502.751007578692 | 13.2489924213081 |
| 61 | 528 | 484.31387252696 | 43.6861274730397 |
| Goldfeld-Quandt test for Heteroskedasticity | |||
| p-values | Alternative Hypothesis | ||
| breakpoint index | greater | 2-sided | less |
| 16 | 0.126485914807531 | 0.252971829615062 | 0.873514085192469 |
| 17 | 0.0980772438102142 | 0.196154487620428 | 0.901922756189786 |
| 18 | 0.0632981030769038 | 0.126596206153808 | 0.936701896923096 |
| 19 | 0.0476889998018185 | 0.095377999603637 | 0.952311000198181 |
| 20 | 0.0328298485790637 | 0.0656596971581275 | 0.967170151420936 |
| 21 | 0.0215490782978737 | 0.0430981565957474 | 0.978450921702126 |
| 22 | 0.0125445939740594 | 0.0250891879481188 | 0.98745540602594 |
| 23 | 0.00653358099005956 | 0.0130671619801191 | 0.99346641900994 |
| 24 | 0.00321247040903532 | 0.00642494081807064 | 0.996787529590965 |
| 25 | 0.00152722215206209 | 0.00305444430412419 | 0.998472777847938 |
| 26 | 0.000745262395086358 | 0.00149052479017272 | 0.999254737604914 |
| 27 | 0.000320869892838487 | 0.000641739785676973 | 0.999679130107161 |
| 28 | 0.000168931002977679 | 0.000337862005955359 | 0.999831068997022 |
| 29 | 0.000142324820734332 | 0.000284649641468665 | 0.999857675179266 |
| 30 | 0.000176206589977457 | 0.000352413179954915 | 0.999823793410022 |
| 31 | 0.000186688021276992 | 0.000373376042553985 | 0.999813311978723 |
| 32 | 0.000259207699964295 | 0.000518415399928591 | 0.999740792300036 |
| 33 | 0.00116293403647270 | 0.00232586807294540 | 0.998837065963527 |
| 34 | 0.00611908282037922 | 0.0122381656407584 | 0.99388091717962 |
| 35 | 0.0250412081384126 | 0.0500824162768252 | 0.974958791861587 |
| 36 | 0.0611072935417523 | 0.122214587083505 | 0.938892706458248 |
| 37 | 0.10966572648902 | 0.21933145297804 | 0.89033427351098 |
| 38 | 0.175909046547350 | 0.351818093094701 | 0.82409095345265 |
| 39 | 0.312788433196991 | 0.625576866393982 | 0.687211566803009 |
| 40 | 0.376067517426448 | 0.752135034852895 | 0.623932482573552 |
| 41 | 0.590588256168092 | 0.818823487663817 | 0.409411743831908 |
| 42 | 0.654609245761472 | 0.690781508477056 | 0.345390754238528 |
| 43 | 0.743613503918349 | 0.512772992163302 | 0.256386496081651 |
| 44 | 0.849964376221882 | 0.300071247556236 | 0.150035623778118 |
| 45 | 0.900355685967451 | 0.199288628065097 | 0.0996443140325487 |
| Meta Analysis of Goldfeld-Quandt test for Heteroskedasticity | |||
| Description | # significant tests | % significant tests | OK/NOK |
| 1% type I error level | 10 | 0.333333333333333 | NOK |
| 5% type I error level | 14 | 0.466666666666667 | NOK |
| 10% type I error level | 17 | 0.566666666666667 | NOK |