| Multiple Linear Regression - Estimated Regression Equation |
| Y[t] = + 582.265639057551 + 1.75858938712907X[t] -3.13436250319707M1[t] -15.9053730581449M2[t] -25.5924034907366M3[t] -31.8332314091302M4[t] -40.0057953604147M5[t] -38.0224822175212M6[t] + 14.4773770150556M7[t] + 25.2475798231175M8[t] + 18.8729362634568M9[t] + 6.74241560961807M10[t] -5.59913577067612M11[t] -1.54606174677481t + e[t] |
| Multiple Linear Regression - Ordinary Least Squares | |||||
| Variable | Parameter | S.D. | T-STAT H0: parameter = 0 | 2-tail p-value | 1-tail p-value |
| (Intercept) | 582.265639057551 | 24.044391 | 24.2163 | 0 | 0 |
| X | 1.75858938712907 | 1.04319 | 1.6858 | 0.098467 | 0.049234 |
| M1 | -3.13436250319707 | 15.126943 | -0.2072 | 0.836746 | 0.418373 |
| M2 | -15.9053730581449 | 15.88376 | -1.0014 | 0.32178 | 0.16089 |
| M3 | -25.5924034907366 | 15.915677 | -1.608 | 0.114533 | 0.057267 |
| M4 | -31.8332314091302 | 15.940638 | -1.997 | 0.051636 | 0.025818 |
| M5 | -40.0057953604147 | 15.912614 | -2.5141 | 0.015417 | 0.007708 |
| M6 | -38.0224822175212 | 15.9634 | -2.3819 | 0.021326 | 0.010663 |
| M7 | 14.4773770150556 | 15.991756 | 0.9053 | 0.369923 | 0.184961 |
| M8 | 25.2475798231175 | 16.017304 | 1.5763 | 0.121672 | 0.060836 |
| M9 | 18.8729362634568 | 15.930975 | 1.1847 | 0.242104 | 0.121052 |
| M10 | 6.74241560961807 | 15.796348 | 0.4268 | 0.671449 | 0.335725 |
| M11 | -5.59913577067612 | 15.725664 | -0.3561 | 0.723396 | 0.361698 |
| t | -1.54606174677481 | 0.200869 | -7.6969 | 0 | 0 |
| Multiple Linear Regression - Regression Statistics | |
| Multiple R | 0.850876194482518 |
| R-squared | 0.723990298337052 |
| Adjusted R-squared | 0.647647189366449 |
| F-TEST (value) | 9.48337457170938 |
| F-TEST (DF numerator) | 13 |
| F-TEST (DF denominator) | 47 |
| p-value | 3.27576876735236e-09 |
| Multiple Linear Regression - Residual Statistics | |
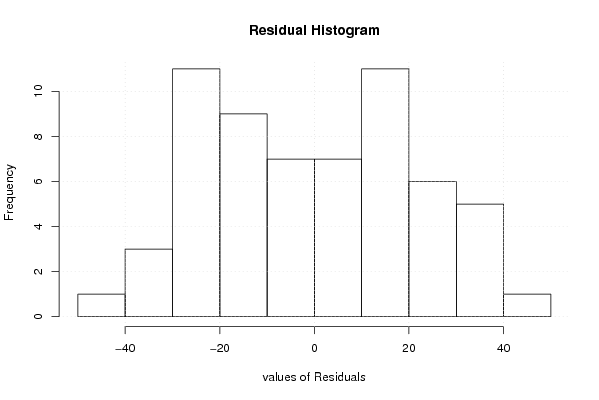
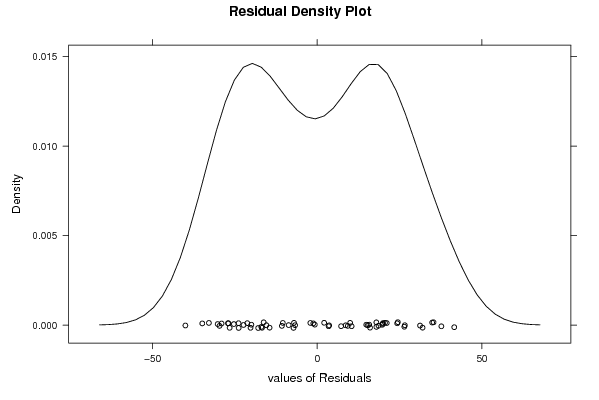
| Residual Standard Deviation | 24.8221773982055 |
| Sum Squared Residuals | 28958.6030670352 |
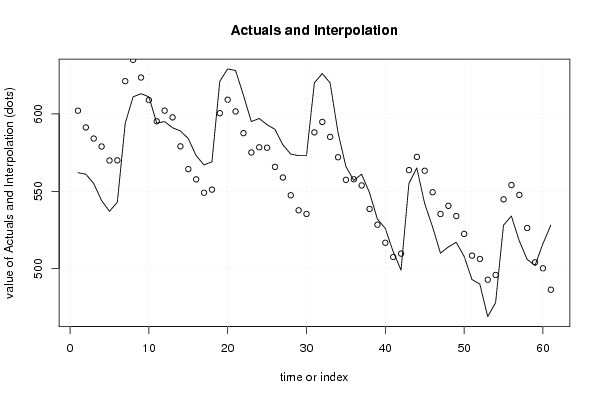
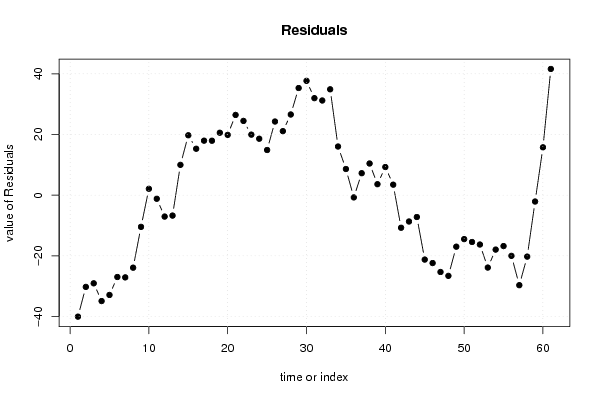
| Multiple Linear Regression - Actuals, Interpolation, and Residuals | |||
| Time or Index | Actuals | Interpolation Forecast | Residuals Prediction Error |
| 1 | 562 | 602.029607288672 | -40.0296072886724 |
| 2 | 561 | 591.229713761208 | -30.2297137612081 |
| 3 | 555 | 584.041377172239 | -29.0413771722385 |
| 4 | 544 | 578.892371587764 | -34.8923715877638 |
| 5 | 537 | 569.877181644556 | -32.877181644556 |
| 6 | 543 | 569.962715163249 | -26.9627151632489 |
| 7 | 594 | 621.092371587764 | -27.0923715877637 |
| 8 | 611 | 634.888845055586 | -23.8888450555864 |
| 9 | 613 | 623.450960974893 | -10.4509609748928 |
| 10 | 611 | 608.895083880715 | 2.10491611928523 |
| 11 | 594 | 595.183329692359 | -1.18332969235863 |
| 12 | 595 | 602.050146735666 | -7.05014673566647 |
| 13 | 591 | 597.72144036312 | -6.72144036312042 |
| 14 | 589 | 579.007894593575 | 9.99210540642488 |
| 15 | 584 | 564.257623639951 | 19.7423763600495 |
| 16 | 573 | 557.701746545772 | 15.2982534542275 |
| 17 | 567 | 549.03827447999 | 17.9617255200094 |
| 18 | 569 | 551.058256324525 | 17.9417436754746 |
| 19 | 621 | 600.429323361911 | 20.5706766380888 |
| 20 | 629 | 609.12588760706 | 19.8741123929404 |
| 21 | 628 | 601.55690017805 | 26.4430998219501 |
| 22 | 612 | 587.528599900011 | 24.4714000999894 |
| 23 | 595 | 575.047858282645 | 19.9521417173552 |
| 24 | 597 | 578.397496551695 | 18.6025034483055 |
| 25 | 593 | 578.113545769545 | 14.8864542304547 |
| 26 | 590 | 565.730921793665 | 24.2690782063354 |
| 27 | 580 | 558.894303082121 | 21.1056969178792 |
| 28 | 574 | 547.414375703981 | 26.5856242960186 |
| 29 | 573 | 537.695750005922 | 35.3042499940779 |
| 30 | 573 | 535.319258382634 | 37.6807416173657 |
| 31 | 620 | 588.031645255565 | 31.9683547444348 |
| 32 | 626 | 594.793761174872 | 31.2062388251283 |
| 33 | 620 | 585.114466481307 | 34.8855335186929 |
| 34 | 588 | 571.965460896832 | 16.0345391031677 |
| 35 | 566 | 557.374412014912 | 8.62558798508829 |
| 36 | 557 | 557.734448325842 | -0.734448325841977 |
| 37 | 561 | 553.757459830722 | 7.24254016927827 |
| 38 | 549 | 538.561092835435 | 10.4389071645655 |
| 39 | 532 | 528.383154288346 | 3.61684571165448 |
| 40 | 526 | 516.727367971493 | 9.27263202850682 |
| 41 | 511 | 507.536319089573 | 3.46368091042744 |
| 42 | 499 | 509.73215987282 | -10.7321598728203 |
| 43 | 555 | 563.675559316742 | -8.67555931674166 |
| 44 | 565 | 572.196264623177 | -7.19626462317713 |
| 45 | 542 | 563.220405684464 | -21.2204056844642 |
| 46 | 527 | 549.367964345138 | -22.3679643451378 |
| 47 | 510 | 535.304492279356 | -25.3044922793559 |
| 48 | 514 | 540.588578874248 | -26.5885788742476 |
| 49 | 517 | 533.973706298434 | -16.9737062984337 |
| 50 | 508 | 522.470377016118 | -14.4703770161176 |
| 51 | 493 | 508.423541817345 | -15.4235418173446 |
| 52 | 490 | 506.264138190989 | -16.2641381909892 |
| 53 | 469 | 492.852474779959 | -23.8524747799588 |
| 54 | 478 | 495.927610256771 | -17.9276102567711 |
| 55 | 528 | 544.771100478018 | -16.7711004780182 |
| 56 | 534 | 553.995241539305 | -19.9952415393053 |
| 57 | 518 | 547.657266681286 | -29.6572666812860 |
| 58 | 506 | 526.242890977305 | -20.2428909773046 |
| 59 | 502 | 504.089907730729 | -2.08990773072896 |
| 60 | 516 | 500.22932951255 | 15.7706704874505 |
| 61 | 528 | 486.404240449506 | 41.5957595504935 |
| Goldfeld-Quandt test for Heteroskedasticity | |||
| p-values | Alternative Hypothesis | ||
| breakpoint index | greater | 2-sided | less |
| 17 | 6.29250140119729e-05 | 0.000125850028023946 | 0.999937074985988 |
| 18 | 6.60327958204104e-05 | 0.000132065591640821 | 0.99993396720418 |
| 19 | 8.0168944908761e-06 | 1.60337889817522e-05 | 0.99999198310551 |
| 20 | 0.000249454799432816 | 0.000498909598865632 | 0.999750545200567 |
| 21 | 0.000758197502507031 | 0.00151639500501406 | 0.999241802497493 |
| 22 | 0.0190189651825651 | 0.0380379303651303 | 0.980981034817435 |
| 23 | 0.0441770430497985 | 0.088354086099597 | 0.955822956950201 |
| 24 | 0.0448755965427485 | 0.089751193085497 | 0.955124403457251 |
| 25 | 0.0568812560796435 | 0.113762512159287 | 0.943118743920357 |
| 26 | 0.0511367989144467 | 0.102273597828893 | 0.948863201085553 |
| 27 | 0.052512207118005 | 0.10502441423601 | 0.947487792881995 |
| 28 | 0.0341472890791498 | 0.0682945781582996 | 0.96585271092085 |
| 29 | 0.036318693806574 | 0.072637387613148 | 0.963681306193426 |
| 30 | 0.0388393257290556 | 0.0776786514581111 | 0.961160674270944 |
| 31 | 0.0472481993459507 | 0.0944963986919014 | 0.95275180065405 |
| 32 | 0.072513997550545 | 0.145027995101090 | 0.927486002449455 |
| 33 | 0.345238179383169 | 0.690476358766339 | 0.65476182061683 |
| 34 | 0.888513856423247 | 0.222972287153506 | 0.111486143576753 |
| 35 | 0.99392819931754 | 0.0121436013649206 | 0.00607180068246028 |
| 36 | 0.99728748080554 | 0.0054250383889217 | 0.00271251919446085 |
| 37 | 0.999075001592098 | 0.00184999681580371 | 0.000924998407901855 |
| 38 | 0.999103108520628 | 0.0017937829587431 | 0.00089689147937155 |
| 39 | 0.999714858093225 | 0.000570283813549708 | 0.000285141906774854 |
| 40 | 0.998982397377822 | 0.00203520524435637 | 0.00101760262217819 |
| 41 | 0.99958577928494 | 0.00082844143012013 | 0.000414220715060065 |
| 42 | 0.999831467894593 | 0.000337064210813316 | 0.000168532105406658 |
| 43 | 0.999086622986417 | 0.00182675402716551 | 0.000913377013582753 |
| 44 | 0.99898711560189 | 0.00202576879622052 | 0.00101288439811026 |
| Meta Analysis of Goldfeld-Quandt test for Heteroskedasticity | |||
| Description | # significant tests | % significant tests | OK/NOK |
| 1% type I error level | 14 | 0.5 | NOK |
| 5% type I error level | 16 | 0.571428571428571 | NOK |
| 10% type I error level | 22 | 0.785714285714286 | NOK |