| Multiple Linear Regression - Estimated Regression Equation |
| Ktot[t] = + 86.3391357853997 + 0.135840111929575Vmtot[t] -0.0930657133231456M1[t] -0.292394135429237M2[t] -0.208940544943249M3[t] -0.324968665267545M4[t] -0.269297087373633M5[t] -0.153197830849198M6[t] -0.182251863028952M7[t] -0.0314922067843380M8[t] + 0.0321993571183724M9[t] -0.0516553718996217M10[t] -0.0506165310947364M11[t] + e[t] |
| Multiple Linear Regression - Ordinary Least Squares | |||||
| Variable | Parameter | S.D. | T-STAT H0: parameter = 0 | 2-tail p-value | 1-tail p-value |
| (Intercept) | 86.3391357853997 | 1.223227 | 70.5831 | 0 | 0 |
| Vmtot | 0.135840111929575 | 0.0108 | 12.5776 | 0 | 0 |
| M1 | -0.0930657133231456 | 0.283748 | -0.328 | 0.745058 | 0.372529 |
| M2 | -0.292394135429237 | 0.283645 | -1.0308 | 0.310341 | 0.155171 |
| M3 | -0.208940544943249 | 0.283605 | -0.7367 | 0.466654 | 0.233327 |
| M4 | -0.324968665267545 | 0.283362 | -1.1468 | 0.259954 | 0.129977 |
| M5 | -0.269297087373633 | 0.283369 | -0.9503 | 0.349062 | 0.174531 |
| M6 | -0.153197830849198 | 0.283383 | -0.5406 | 0.592524 | 0.296262 |
| M7 | -0.182251863028952 | 0.283362 | -0.6432 | 0.524692 | 0.262346 |
| M8 | -0.0314922067843380 | 0.283421 | -0.1111 | 0.912219 | 0.45611 |
| M9 | 0.0321993571183724 | 0.283371 | 0.1136 | 0.910241 | 0.455121 |
| M10 | -0.0516553718996217 | 0.303065 | -0.1704 | 0.865734 | 0.432867 |
| M11 | -0.0506165310947364 | 0.302927 | -0.1671 | 0.868349 | 0.434175 |
| Multiple Linear Regression - Regression Statistics | |
| Multiple R | 0.914861614224816 |
| R-squared | 0.836971773182037 |
| Adjusted R-squared | 0.7758361881253 |
| F-TEST (value) | 13.6904189663891 |
| F-TEST (DF numerator) | 12 |
| F-TEST (DF denominator) | 32 |
| p-value | 2.20569318365449e-09 |
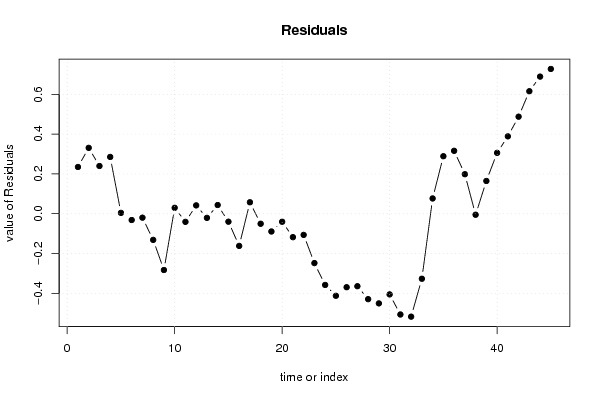
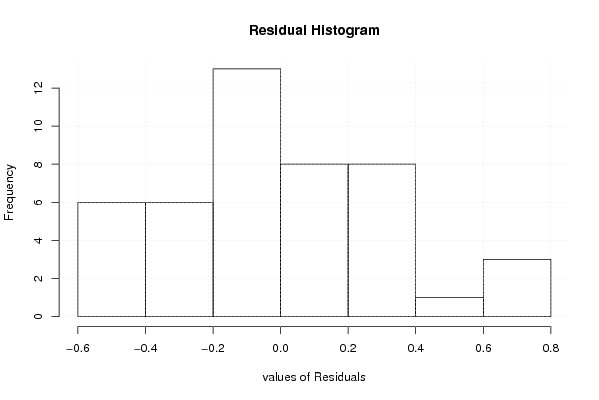
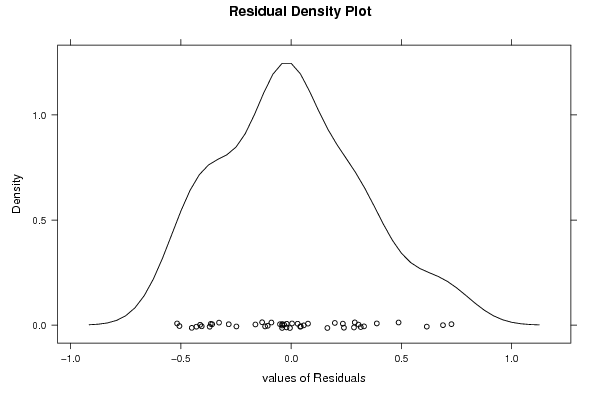
| Multiple Linear Regression - Residual Statistics | |
| Residual Standard Deviation | 0.371007714838415 |
| Sum Squared Residuals | 4.40469518302793 |
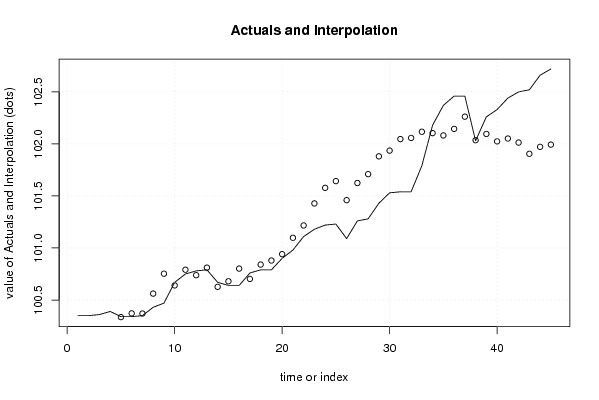
| Multiple Linear Regression - Actuals, Interpolation, and Residuals | |||
| Time or Index | Actuals | Interpolation Forecast | Residuals Prediction Error |
| 1 | 100.35 | 100.115345500086 | 0.234654499913785 |
| 2 | 100.35 | 100.019255563047 | 0.330744436953394 |
| 3 | 100.36 | 100.120368368083 | 0.239631631916567 |
| 4 | 100.39 | 100.104861930587 | 0.285138069412977 |
| 5 | 100.34 | 100.33576725287 | 0.0042327471299166 |
| 6 | 100.34 | 100.371720843356 | -0.0317208433560704 |
| 7 | 100.35 | 100.369834833562 | -0.0198348335622384 |
| 8 | 100.43 | 100.561346523386 | -0.131346523385714 |
| 9 | 100.47 | 100.752727792502 | -0.282727792502233 |
| 10 | 100.67 | 100.640346639979 | 0.0296533600209756 |
| 11 | 100.75 | 100.790809603906 | -0.0408096039064457 |
| 12 | 100.78 | 100.738187649935 | 0.0418123500652971 |
| 13 | 100.79 | 100.810846873166 | -0.0208468731656339 |
| 14 | 100.67 | 100.626460863372 | 0.0435391366281996 |
| 15 | 100.64 | 100.680029629233 | -0.0400296292332835 |
| 16 | 100.64 | 100.801721704786 | -0.161721704785744 |
| 17 | 100.76 | 100.70253555508 | 0.0574644449200642 |
| 18 | 100.79 | 100.840369229513 | -0.0503692295131011 |
| 19 | 100.79 | 100.879235253298 | -0.0892352532981342 |
| 20 | 100.9 | 100.940340435669 | -0.0403404356692299 |
| 21 | 100.98 | 101.097761676803 | -0.117761676803349 |
| 22 | 101.11 | 101.216308714560 | -0.106308714560428 |
| 23 | 101.18 | 101.427899728856 | -0.247899728856147 |
| 24 | 101.22 | 101.577679541659 | -0.357679541659482 |
| 25 | 101.23 | 101.642188358175 | -0.412188358174638 |
| 26 | 101.09 | 101.459160749500 | -0.369160749500095 |
| 27 | 101.26 | 101.624118407144 | -0.364118407143828 |
| 28 | 101.28 | 101.709133652475 | -0.429133652475308 |
| 29 | 101.43 | 101.880269325509 | -0.450269325509353 |
| 30 | 101.53 | 101.935240531665 | -0.405240531665484 |
| 31 | 101.54 | 102.046101814773 | -0.506101814773187 |
| 32 | 101.54 | 102.056946155730 | -0.516946155730339 |
| 33 | 101.79 | 102.116562516275 | -0.326562516275162 |
| 34 | 102.18 | 102.103344645461 | 0.0766553545394522 |
| 35 | 102.37 | 102.081290667237 | 0.288709332762593 |
| 36 | 102.46 | 102.144132808406 | 0.315867191594185 |
| 37 | 102.46 | 102.261619268574 | 0.198380731426487 |
| 38 | 102.03 | 102.035122824081 | -0.00512282408149841 |
| 39 | 102.26 | 102.095483595539 | 0.164516404460545 |
| 40 | 102.33 | 102.024282712152 | 0.305717287848075 |
| 41 | 102.44 | 102.051427866541 | 0.388572133459372 |
| 42 | 102.5 | 102.012669395465 | 0.487330604534655 |
| 43 | 102.52 | 101.904828098366 | 0.61517190163356 |
| 44 | 102.66 | 101.971366885215 | 0.688633114785283 |
| 45 | 102.72 | 101.992948014419 | 0.727051985580744 |
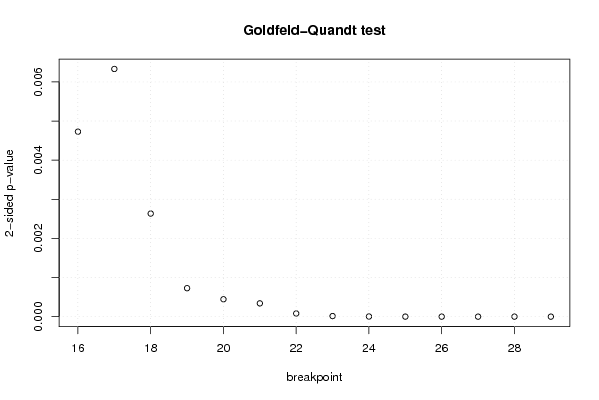
| Goldfeld-Quandt test for Heteroskedasticity | |||
| p-values | Alternative Hypothesis | ||
| breakpoint index | greater | 2-sided | less |
| 16 | 0.00236432803753876 | 0.00472865607507751 | 0.997635671962461 |
| 17 | 0.00316598264273963 | 0.00633196528547925 | 0.99683401735726 |
| 18 | 0.00131760454579263 | 0.00263520909158525 | 0.998682395454207 |
| 19 | 0.000363828085264164 | 0.000727656170528328 | 0.999636171914736 |
| 20 | 0.000222413522485996 | 0.000444827044971993 | 0.999777586477514 |
| 21 | 0.000169890567029765 | 0.000339781134059529 | 0.99983010943297 |
| 22 | 4.0370384181367e-05 | 8.0740768362734e-05 | 0.999959629615819 |
| 23 | 7.39208768021937e-06 | 1.47841753604387e-05 | 0.99999260791232 |
| 24 | 1.82987597126666e-06 | 3.65975194253331e-06 | 0.999998170124029 |
| 25 | 3.95702080261132e-07 | 7.91404160522265e-07 | 0.99999960429792 |
| 26 | 8.59616489586631e-08 | 1.71923297917326e-07 | 0.999999914038351 |
| 27 | 1.17329899633525e-08 | 2.34659799267050e-08 | 0.99999998826701 |
| 28 | 4.35262142090784e-09 | 8.70524284181568e-09 | 0.999999995647379 |
| 29 | 6.784875984883e-08 | 1.3569751969766e-07 | 0.99999993215124 |
| Meta Analysis of Goldfeld-Quandt test for Heteroskedasticity | |||
| Description | # significant tests | % significant tests | OK/NOK |
| 1% type I error level | 14 | 1 | NOK |
| 5% type I error level | 14 | 1 | NOK |
| 10% type I error level | 14 | 1 | NOK |